Copyright
©The Author(s) 2020.
World J Clin Cases. Jan 6, 2020; 8(1): 38-45
Published online Jan 6, 2020. doi: 10.12998/wjcc.v8.i1.38
Published online Jan 6, 2020. doi: 10.12998/wjcc.v8.i1.38
Figure 1 Surgical position setting.
The traditional position (A and B) and the modified position (C and D) are shown.
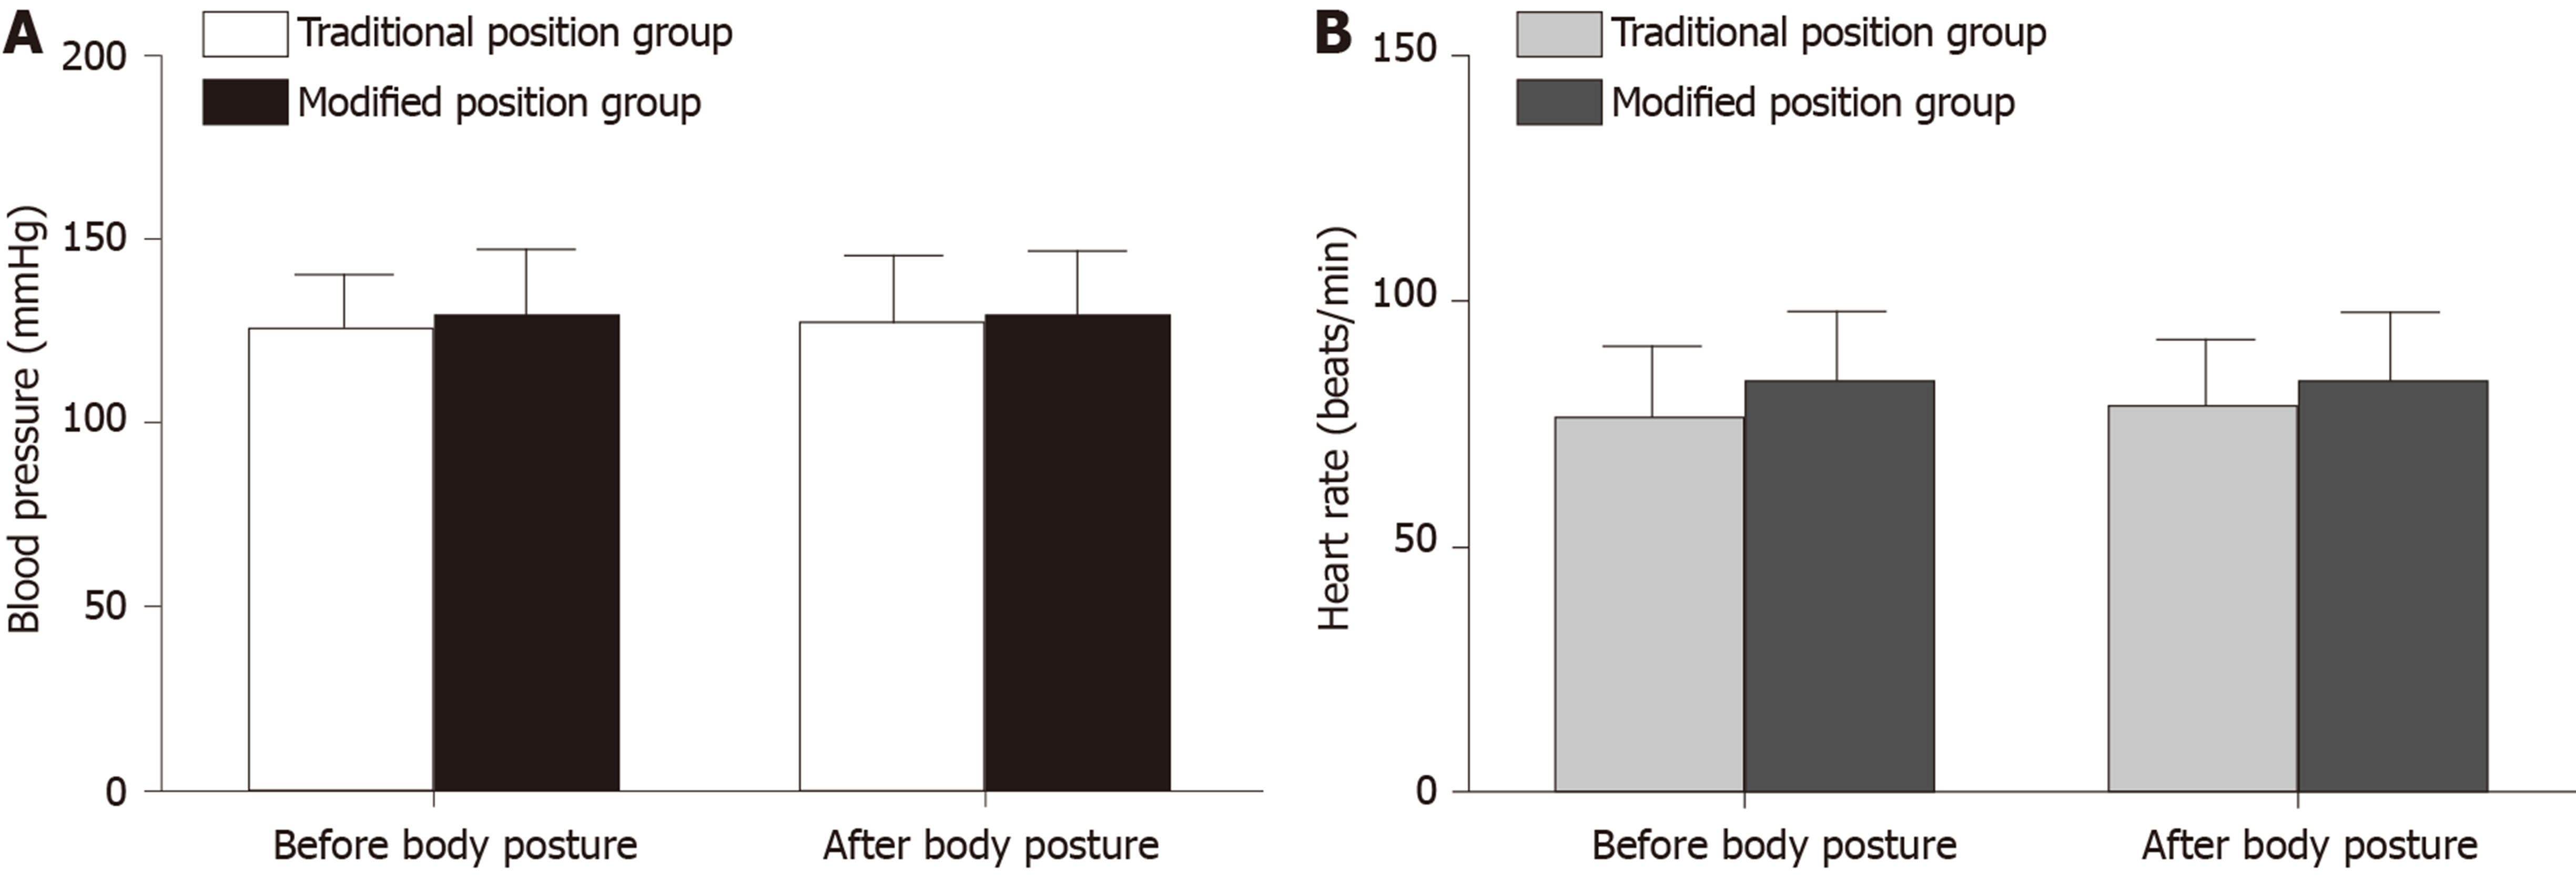
Figure 2 Patients’ blood pressure and heart rate before and after body positioning.
A: Blood pressure before and after body positioning; B: Heart rate before and after body positioning. Each value is the mean ± SD.
Figure 3 Position setting time and total operation time in the two groups.
Each value is the mean ± SD. aP < 0.05, statistical significance was considered according to the independent-samples t-test.
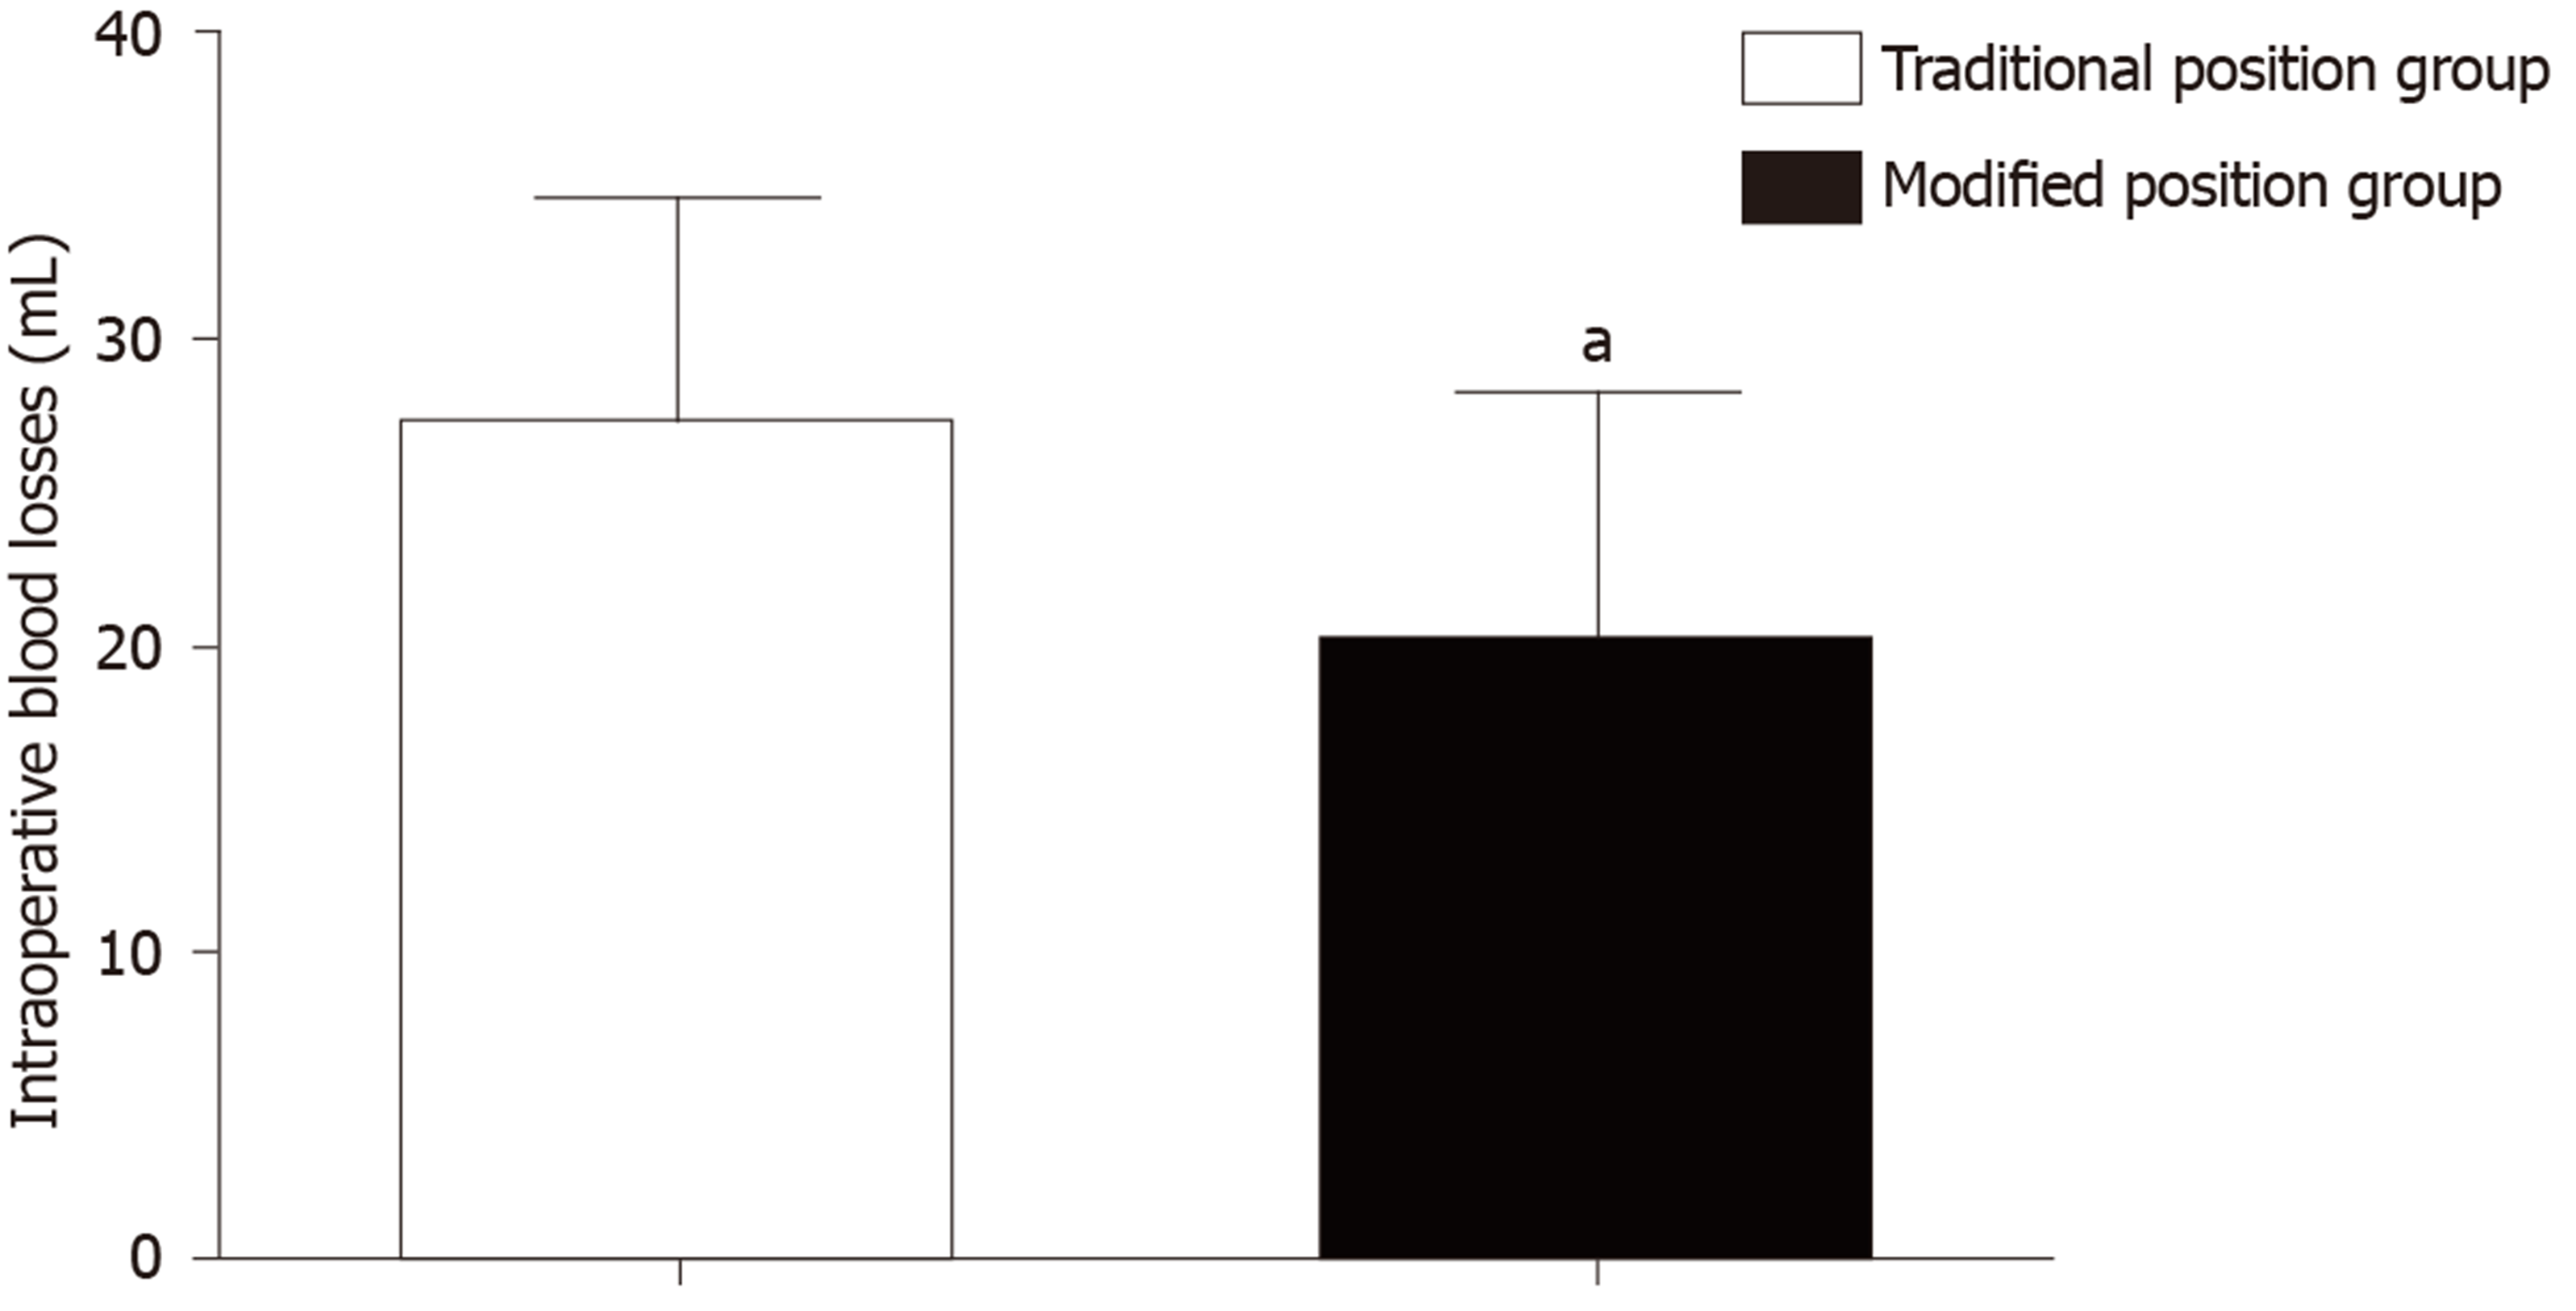
Figure 4 Intraoperative blood losses in the two groups.
Intraoperative blood loss. Each value is the mean ± SD. aP < 0.05, statistical significance was considered according to the independent-samples t-test.
- Citation: Hou WX, Zhang HX, Wang X, Yang HL, Luan XR. Application of a modified surgical position in anterior approach for total cervical artificial disc replacement. World J Clin Cases 2020; 8(1): 38-45
- URL: https://www.wjgnet.com/2307-8960/full/v8/i1/38.htm
- DOI: https://dx.doi.org/10.12998/wjcc.v8.i1.38


