Copyright
©The Author(s) 2019.
World J Clin Cases. Feb 26, 2019; 7(4): 452-465
Published online Feb 26, 2019. doi: 10.12998/wjcc.v7.i4.452
Published online Feb 26, 2019. doi: 10.12998/wjcc.v7.i4.452
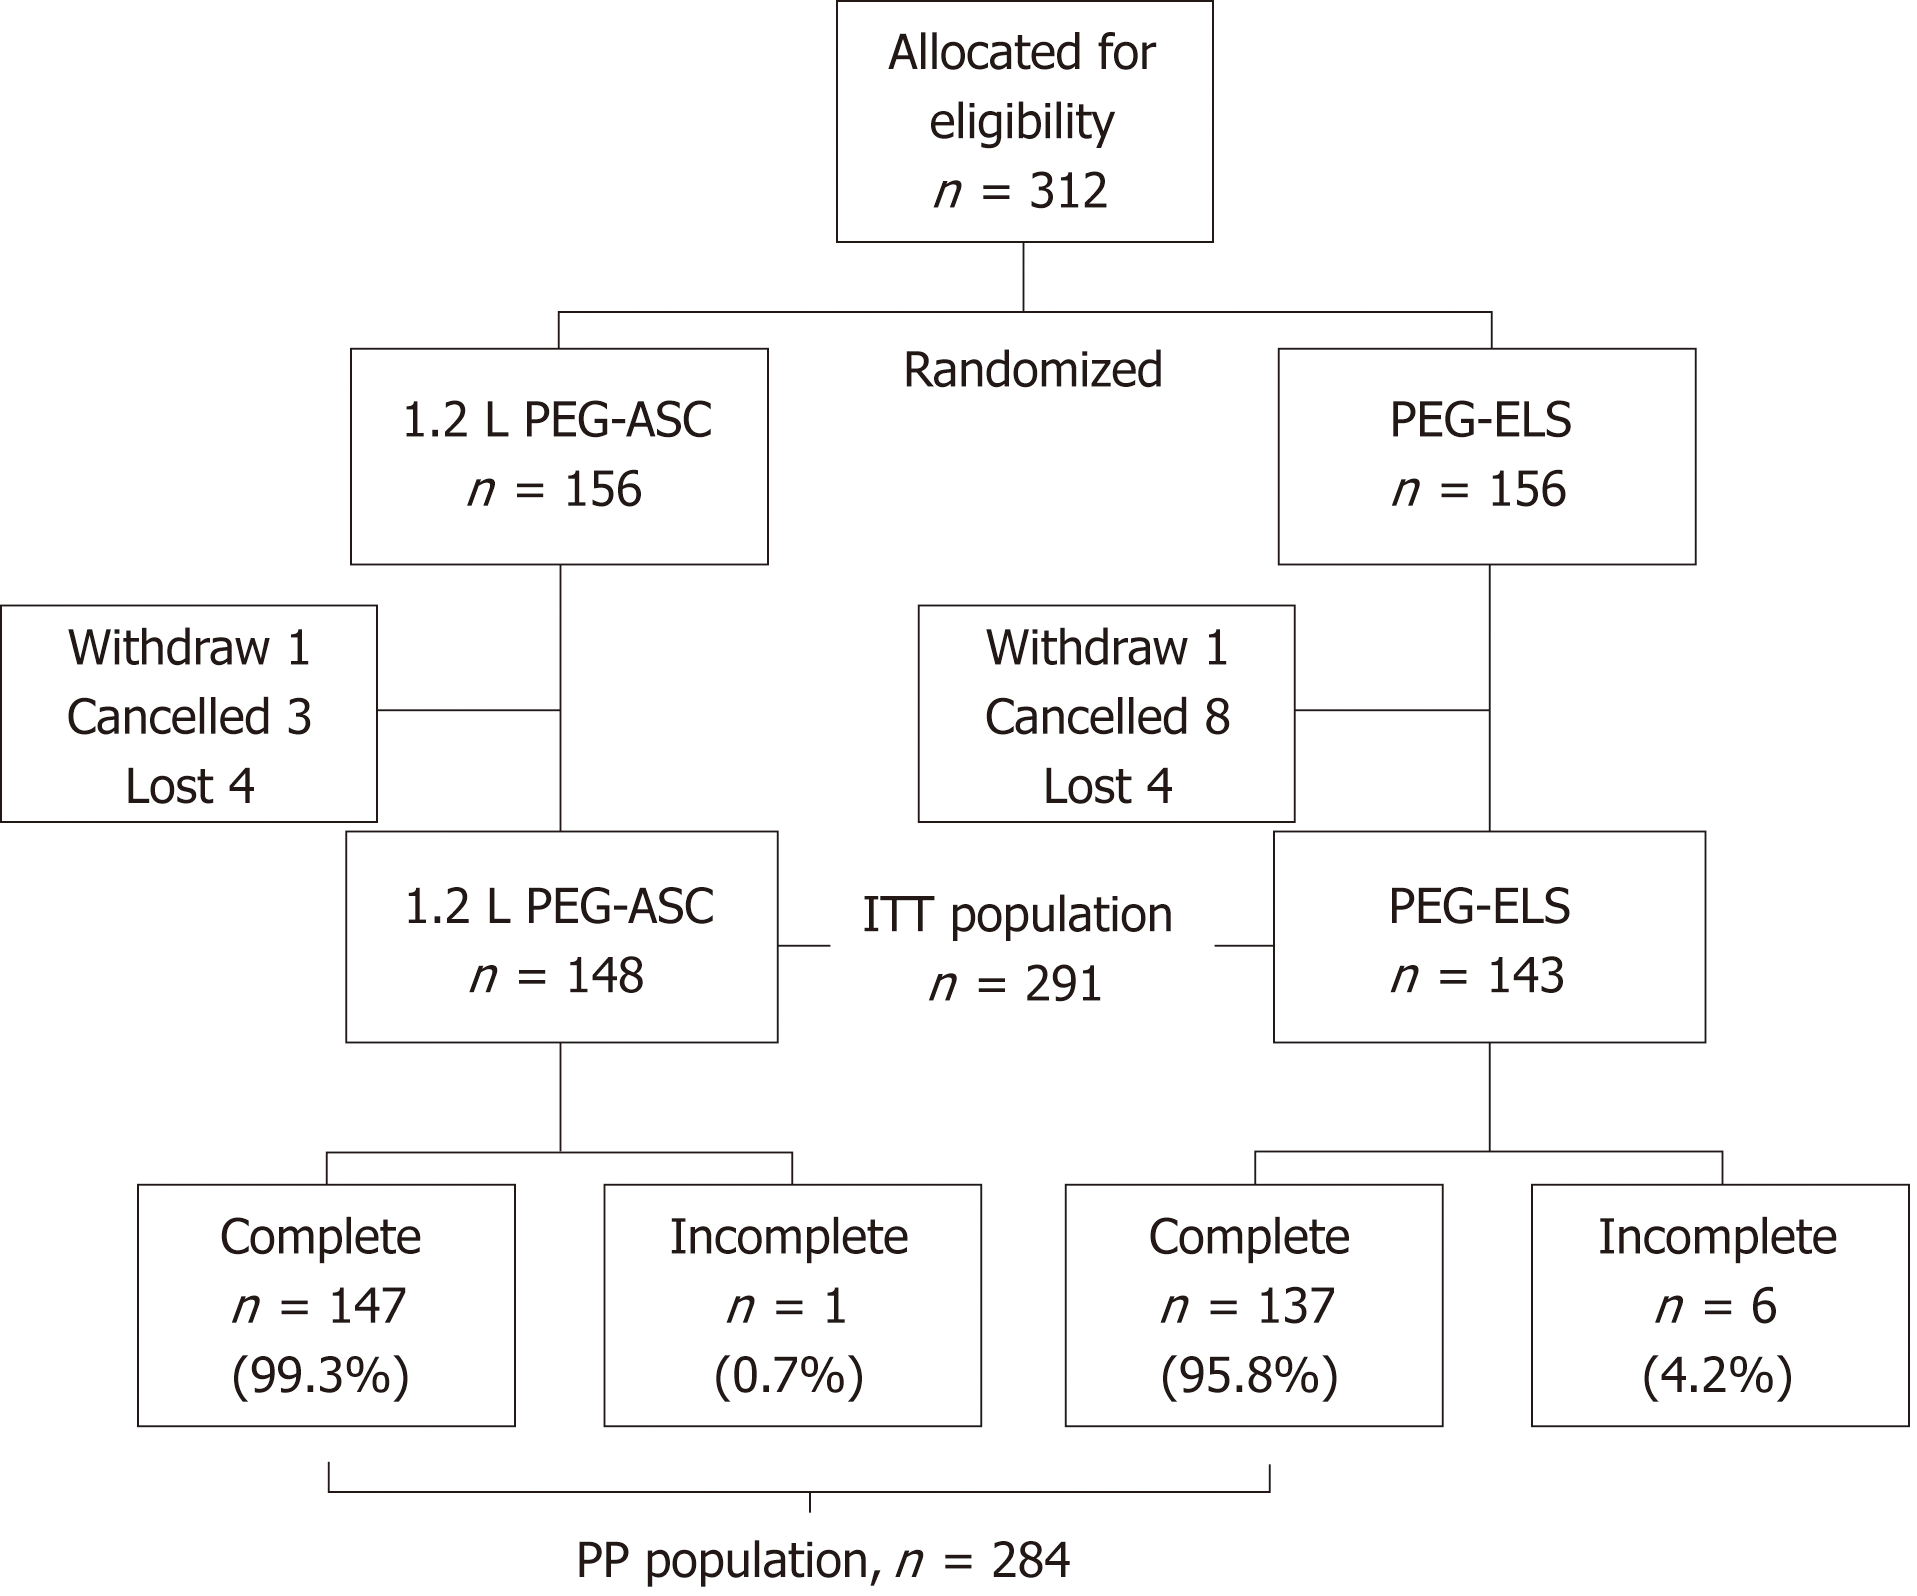
Figure 1 Patient flow.
ITT: Intent-to-treat; PEG-ASC: Polyethylene glycol plus ascorbic acid; PEG-ELS: Polyethylene glycol-based electrolyte solution; PP: Per protocol.
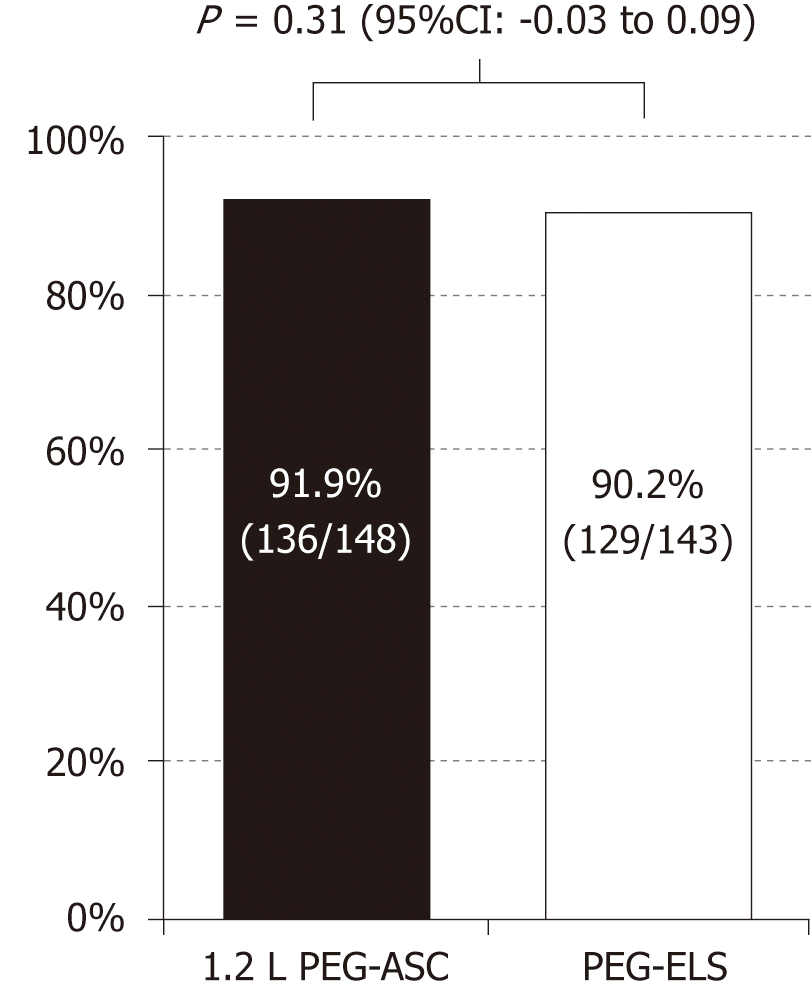
Figure 2 Successful cleansing rate (BBPS score ≥ 5).
The 1.2 L PEG-ASC group was shown to be non-inferior to the PEG-ELS group in terms of successful cleansing rate with a two-sided significance value of 5% and a non-inferiority margin of 10% (1.2 L PEG-ASC group, 91.9%; PEG-ELS group, 90.2%; 95%CI: -0.03-0.09 in the intention-to-treat population). BBPS: Boston Bowel Preparation Scale; PEG-ASC: Polyethylene glycol plus ascorbic acid; PEG-ELS: Polyethylene glycol-based electrolyte solution.
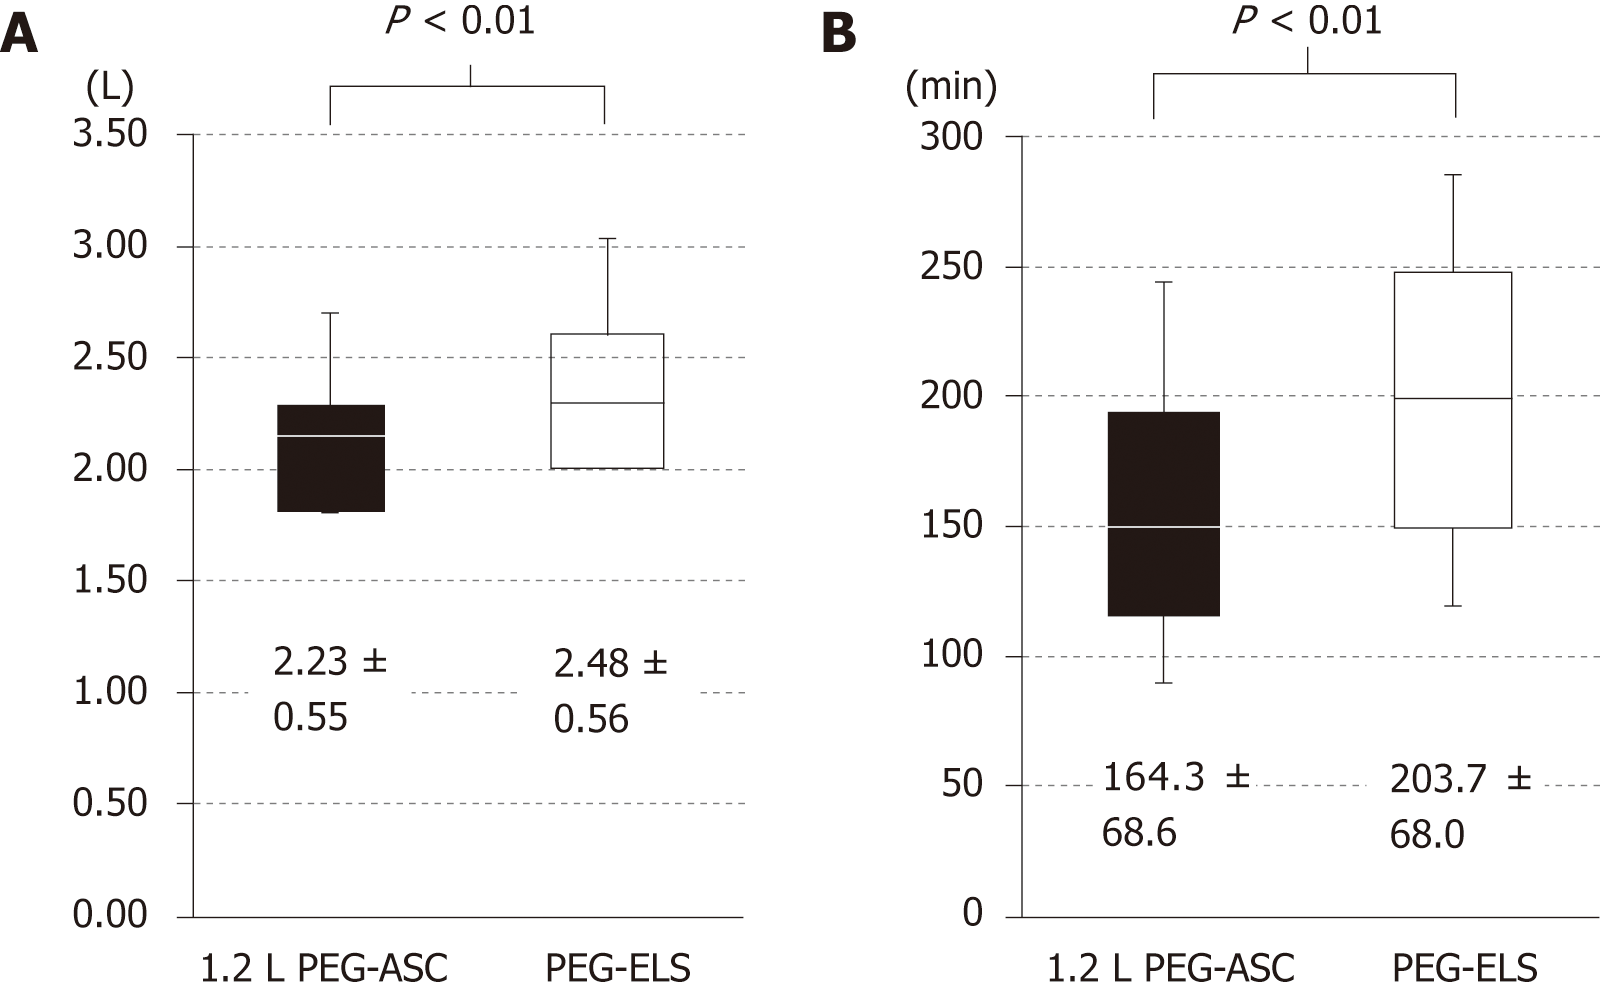
Figure 3 Difference in the total volume of fluid intake and the required time for bowel preparation between the 1.
2 L polyethylene glycol plus ascorbic acid group and the polyethylene glycol-based electrolyte solution group. A: Total volume of fluid intake. The total volume of fluid intake was significantly lower in the 1.2 L PEG-ASC group than in the PEG-ELS group (2.23 L ± 0.55 L vs 2.47 L ± 0.56 L, P < 0.01); B: Required time for bowel preparation. The required time for bowel preparation was significantly shorter in the 1.2 L PEG-ASC group than in the PEG-ELS group (164.3 min ± 68.6 min vs 203.7 min ± 68.0 min, P < 0.01). PEG-ASC: Polyethylene glycol plus ascorbic acid; PEG-ELS: Polyethylene glycol-based electrolyte solution.
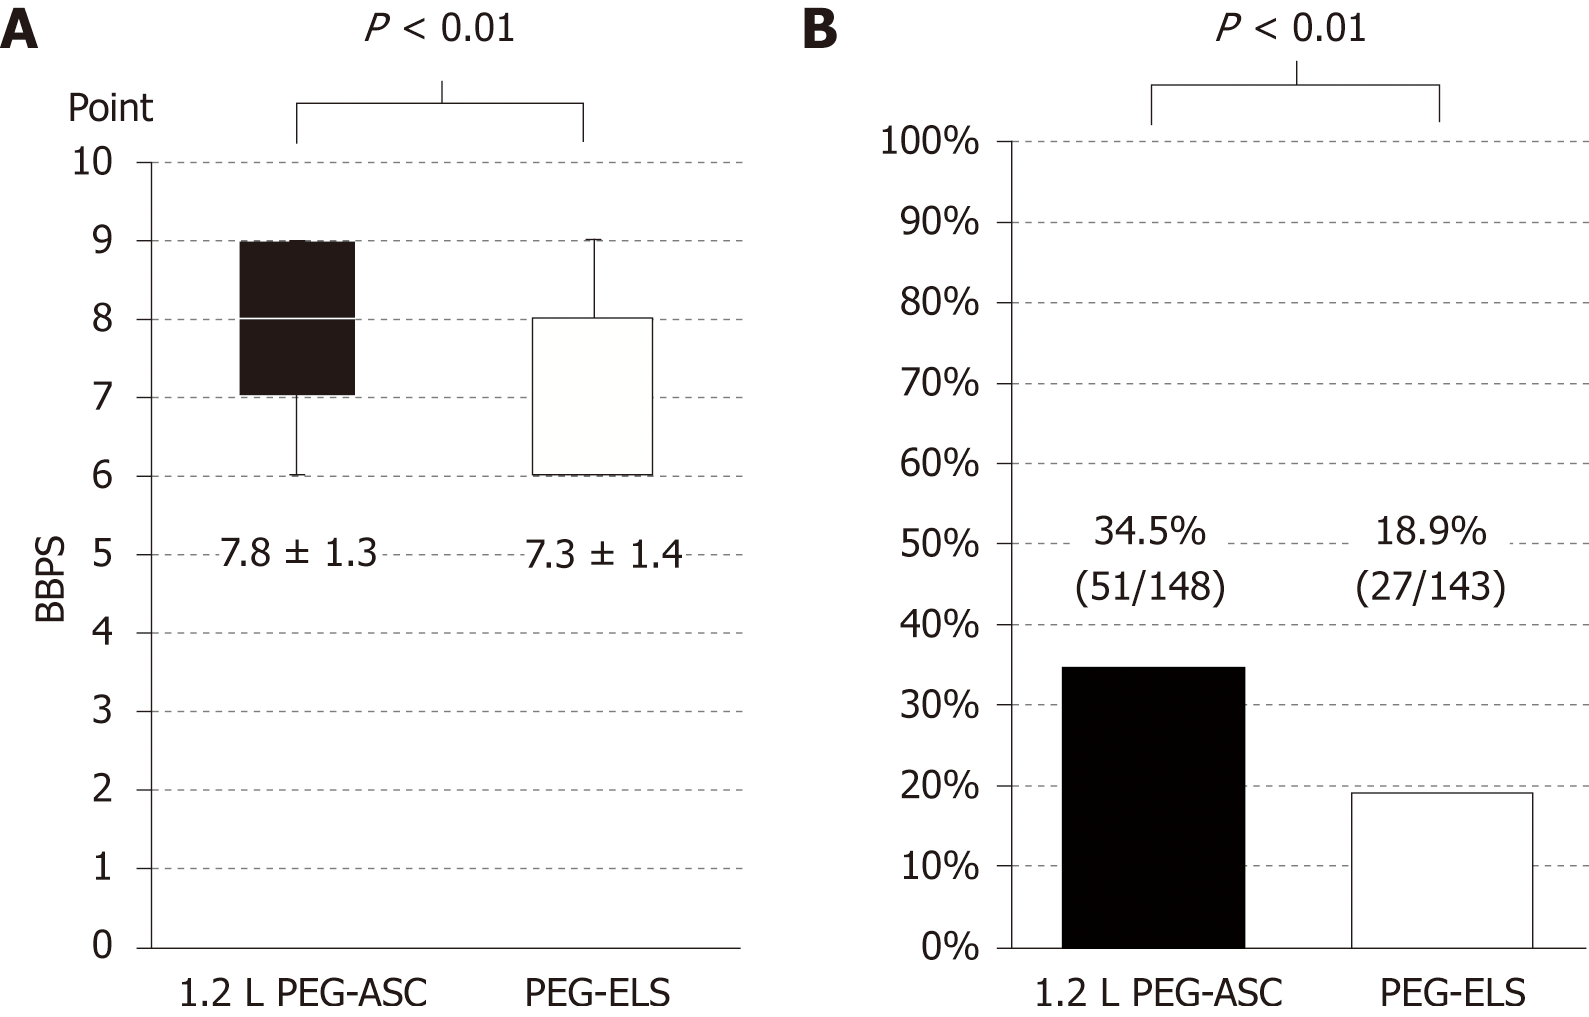
Figure 4 Difference in the cleansing quality and the frequency of cleansing operations to remove foam or bubbles between the 1.
2 L polyethylene glycol plus ascorbic acid group and the polyethylene glycol-based electrolyte solution group. A: Cleansing quality evaluated by the BBPS. The sum of each segmental score of BBPS was higher in the 1.2 L PEG-ASC group than in the PEG-ELS group (7.80 ± 1.37 vs 7.30 ± 1.40, P < 0.01 in ITT population, 7.76 ± 1.35 vs 7.29 ± 1.37, P < 0.01 in the per-protocol population). B: Frequency of cleansing operations to remove foam or bubbles. Foam or bubbles were observed more frequently in the 1.2 L PEG-ASC group than in the PEG-ELS group (35.7% vs 19.7%, P < 0.01). BBPS, Boston Bowel Preparation Scale; PEG-ASC, polyethylene glycol plus ascorbic acid; PEG-ELS, polyethylene glycol-based electrolyte solution.
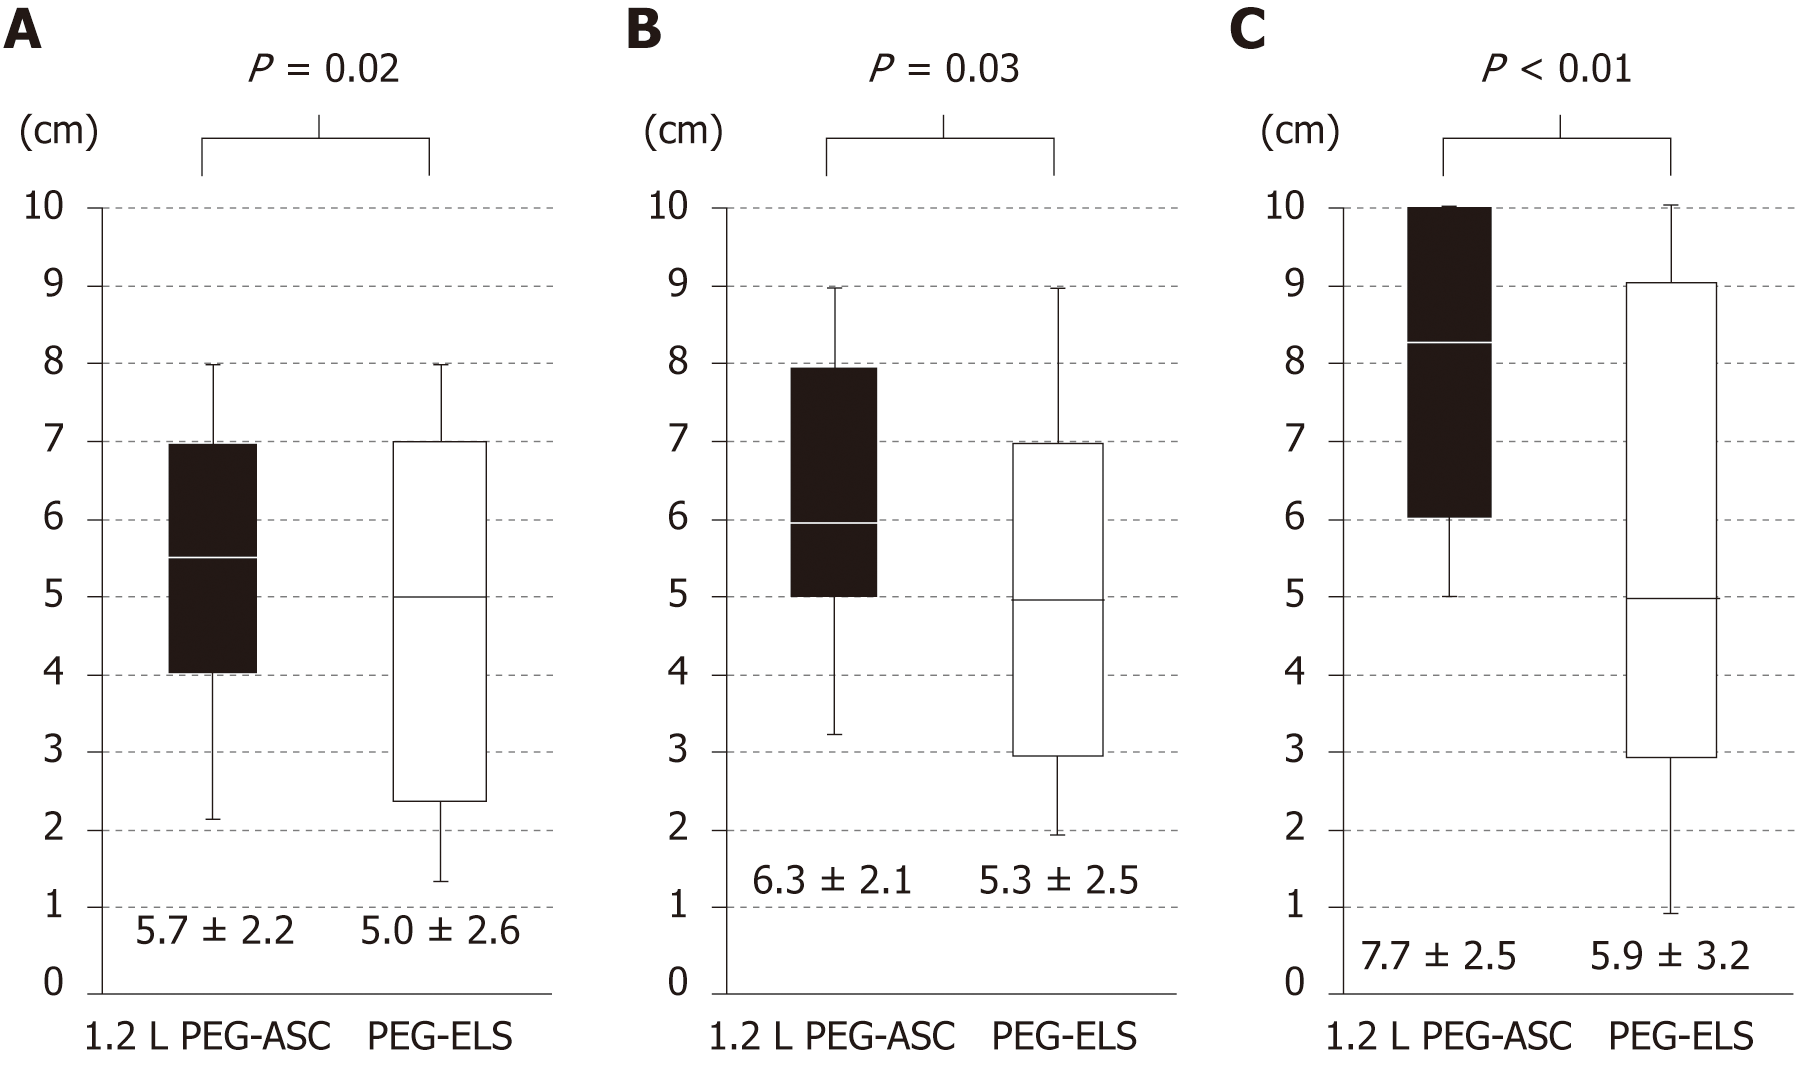
Figure 5 Patient acceptability of cleansing solution assessed by visual analog scale.
A: Patient acceptability for palatability. Patient acceptability for palatability was significantly better in the 1.2 L PEG-ASC group than in the PEG-ELS group (5.7 cm ± 2.2 cm vs 5.0 cm ± 2.6 cm, P = 0.02); B: Patient acceptability for volume. Patient acceptability for volume was significantly better in the 1.2 L PEG-ASC group than in the PEG-ELS group (6.3 cm ± 2.1 cm vs 5.3 cm ± 2.5 cm, P = 0.03); C: Overall acceptability. Overall acceptability was significantly better in the 1.2 L PEG-ASC group than in the PEG-ELS group (7.70 cm ± 2.57 cm vs 5.80 cm ± 3.24 cm, P < 0.001). PEG-ASC: Polyethylene glycol plus ascorbic acid; PEG-ELS: Polyethylene glycol-based electrolyte solution; VAS: Visual analog scale.
- Citation: Tamaki H, Noda T, Morita M, Omura A, Kubo A, Ogawa C, Matsunaka T, Shibatoge M. Efficacy of 1.2 L polyethylene glycol plus ascorbic acid for bowel preparations. World J Clin Cases 2019; 7(4): 452-465
- URL: https://www.wjgnet.com/2307-8960/full/v7/i4/452.htm
- DOI: https://dx.doi.org/10.12998/wjcc.v7.i4.452


