Copyright
©The Author(s) 2019.
World J Clin Cases. Nov 26, 2019; 7(22): 3711-3717
Published online Nov 26, 2019. doi: 10.12998/wjcc.v7.i22.3711
Published online Nov 26, 2019. doi: 10.12998/wjcc.v7.i22.3711
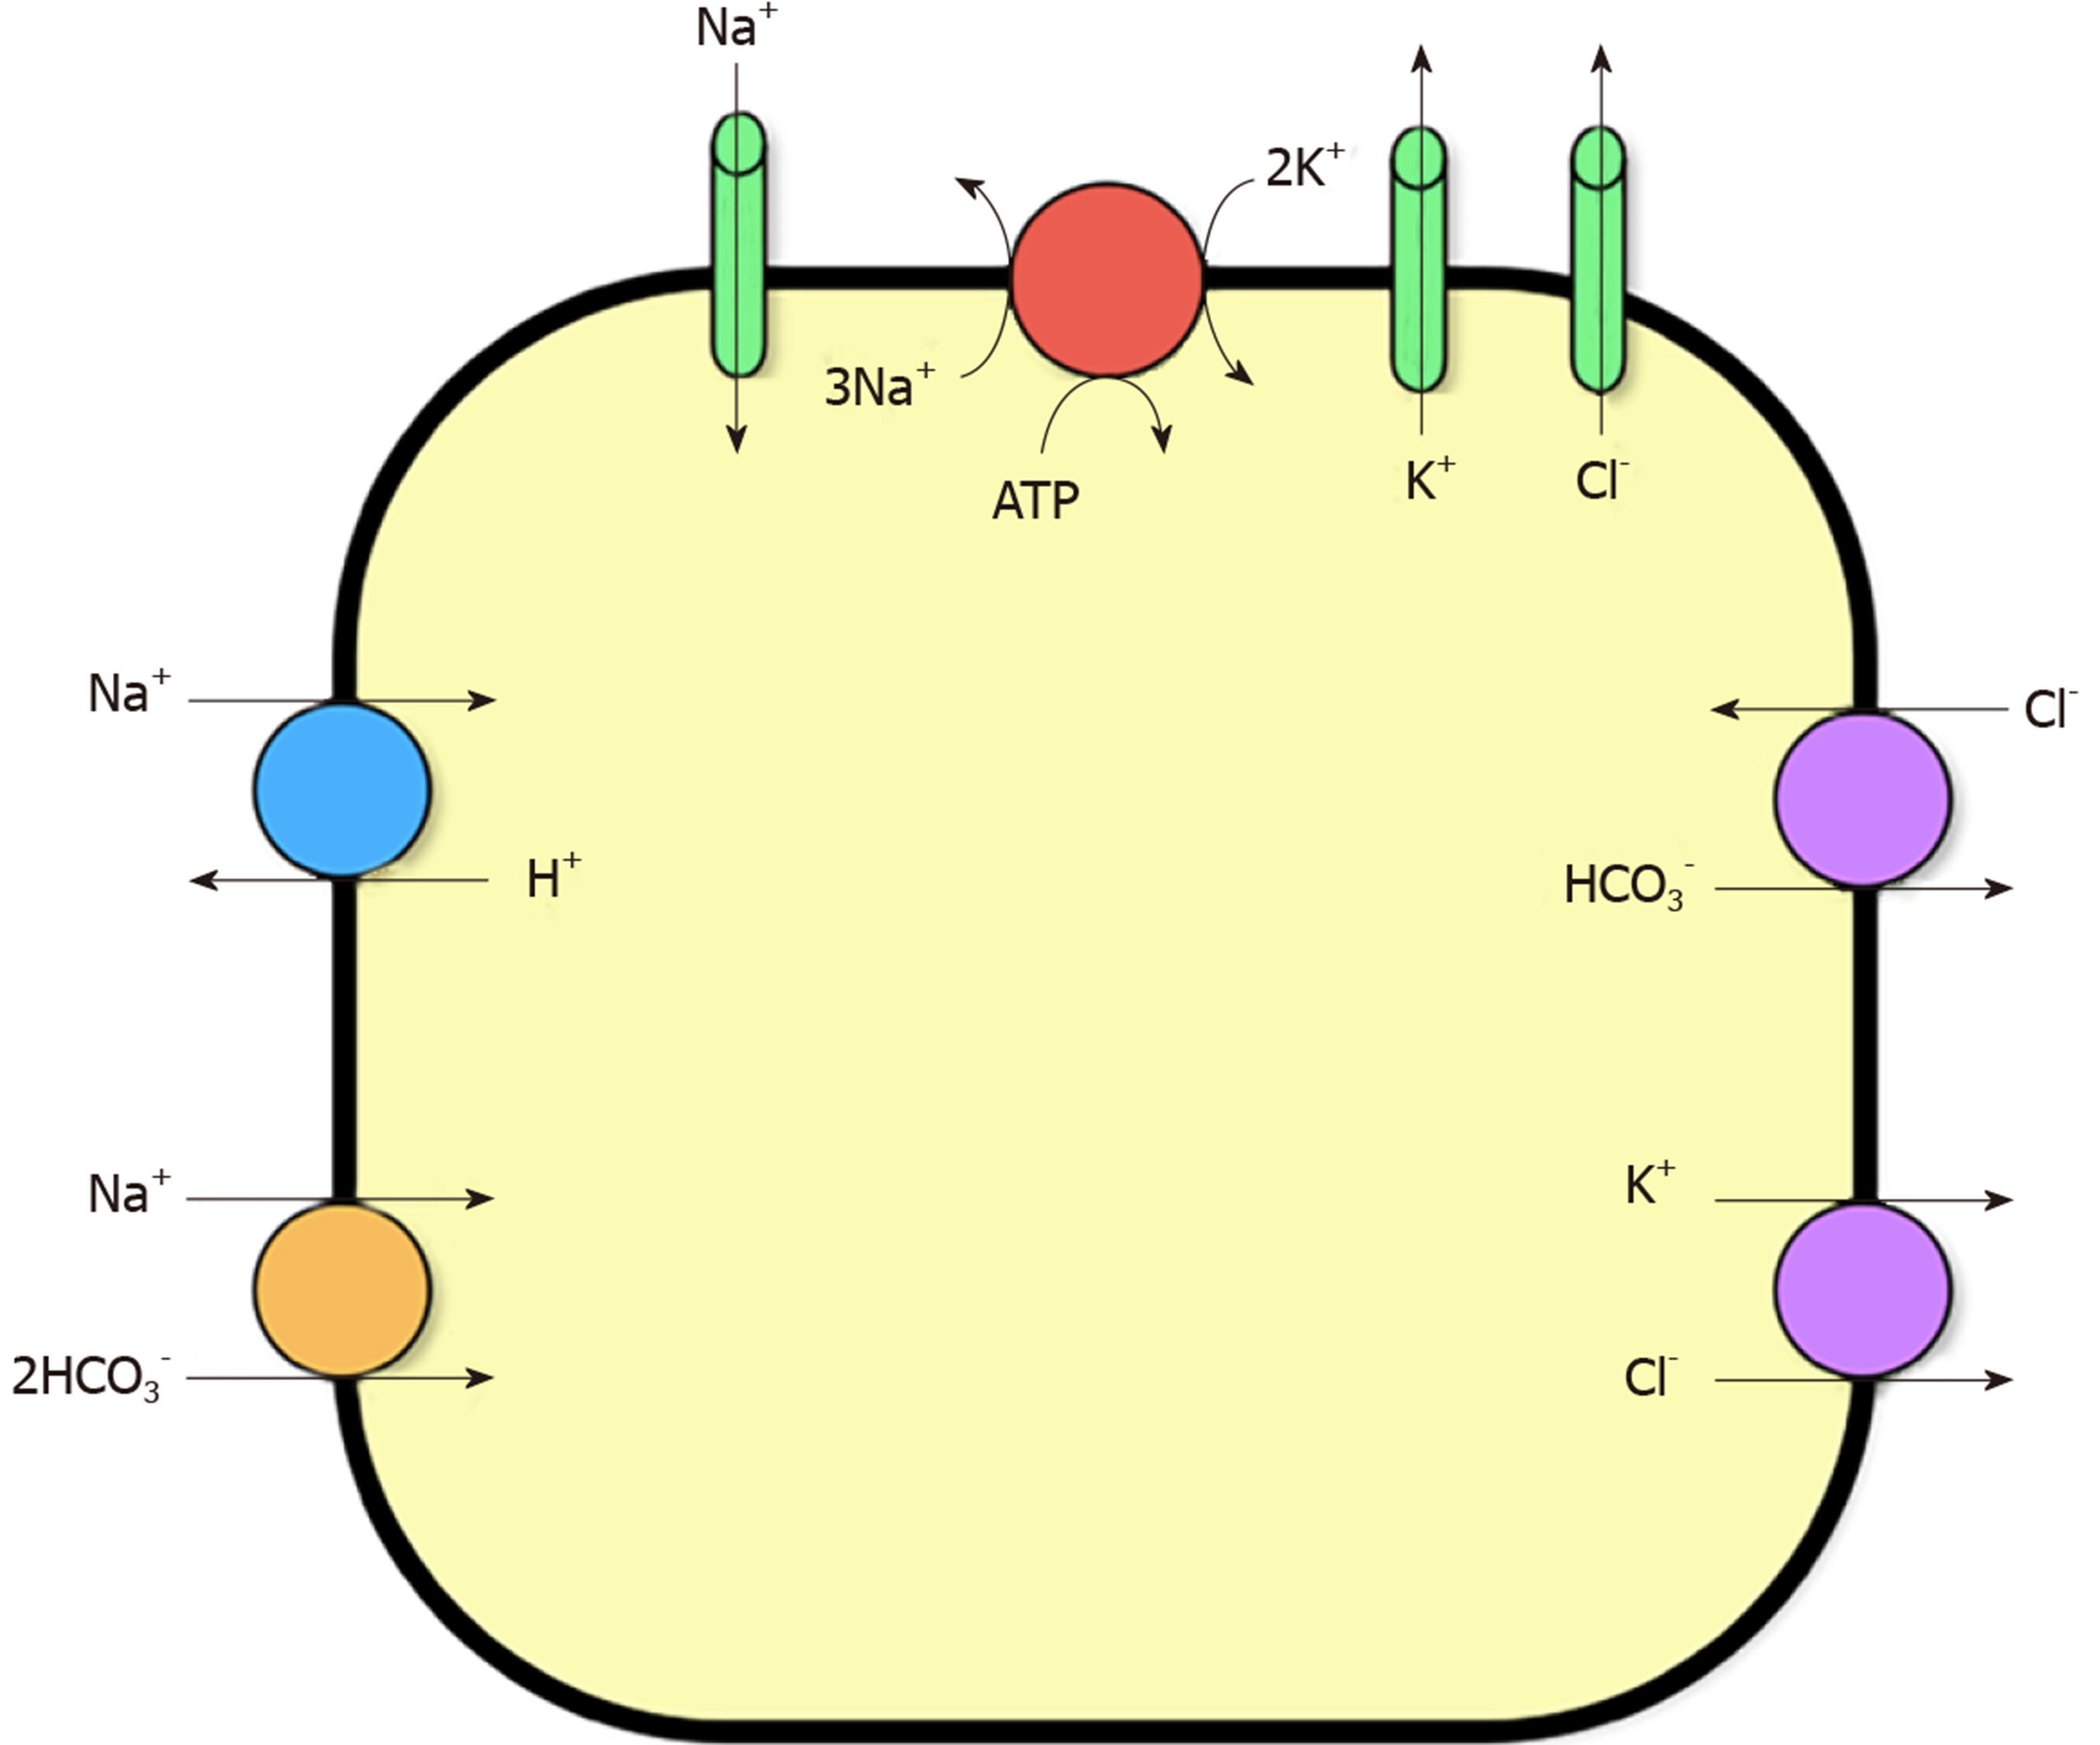
Figure 1 pH-dependent ion channels involved in potassium homeostasis of a skeletal muscle cell.
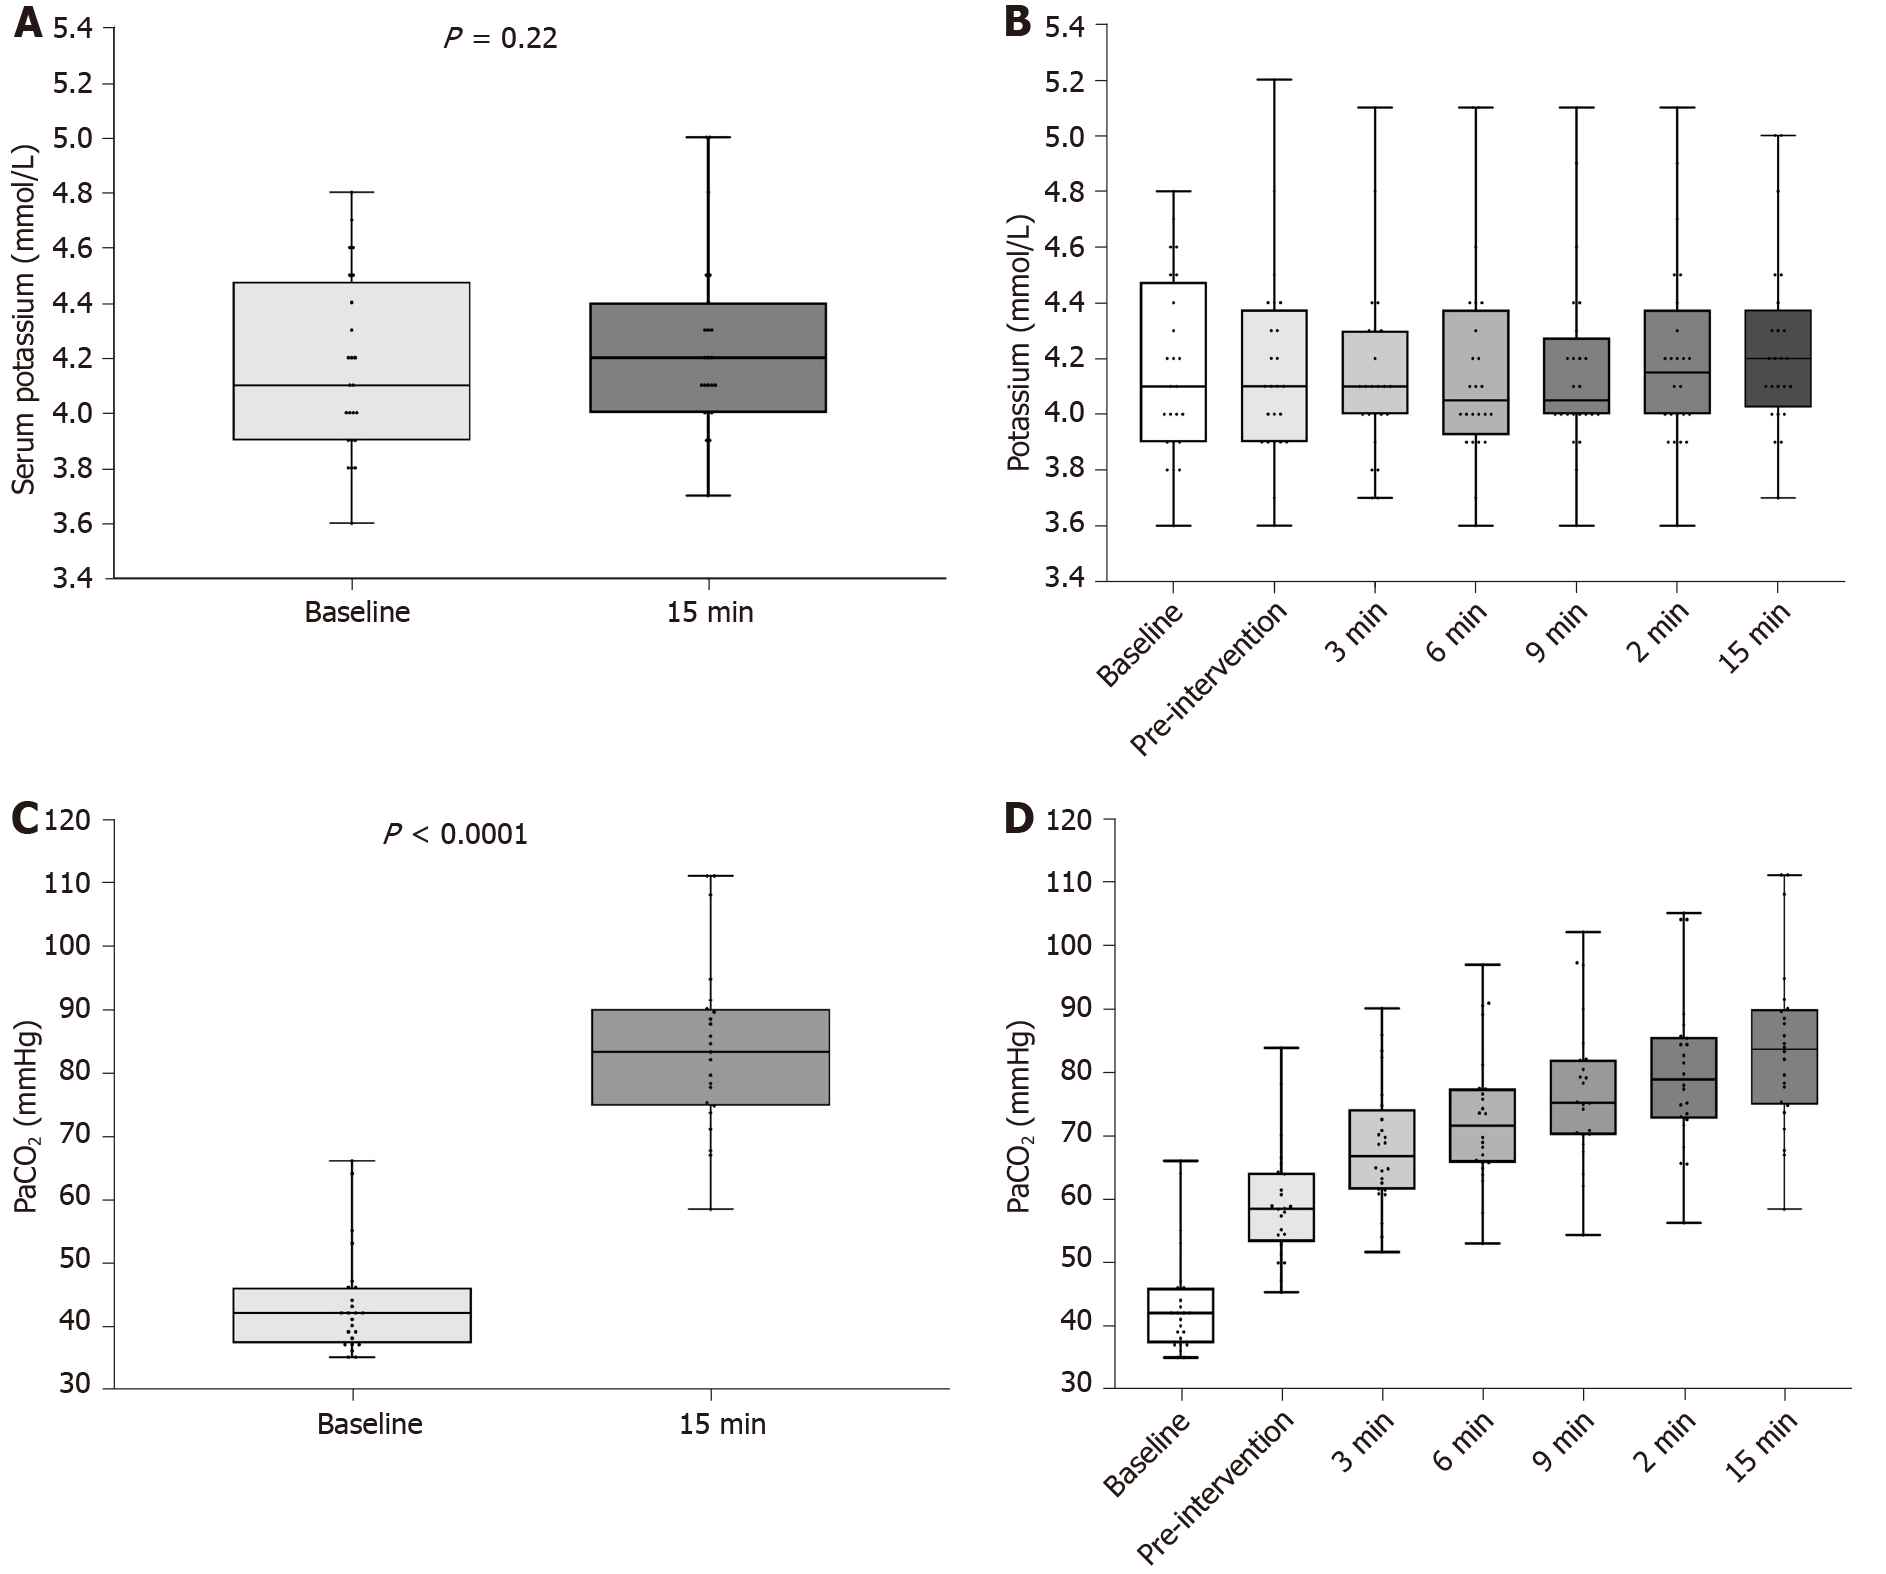
Figure 2 Box and Whisker plots.
A: Changes in plasma potassium measured at baseline and at 15 min; B: Changes in plasma potassium over time. Repeated measures ANOVA, P = 0.95; C: Changes in arterial carbon dioxide at baseline and at 15 min; D: Box and Whisker plots with changes in arterial carbon dioxide over time. Repeated measures ANOVA, P < 0.0001.
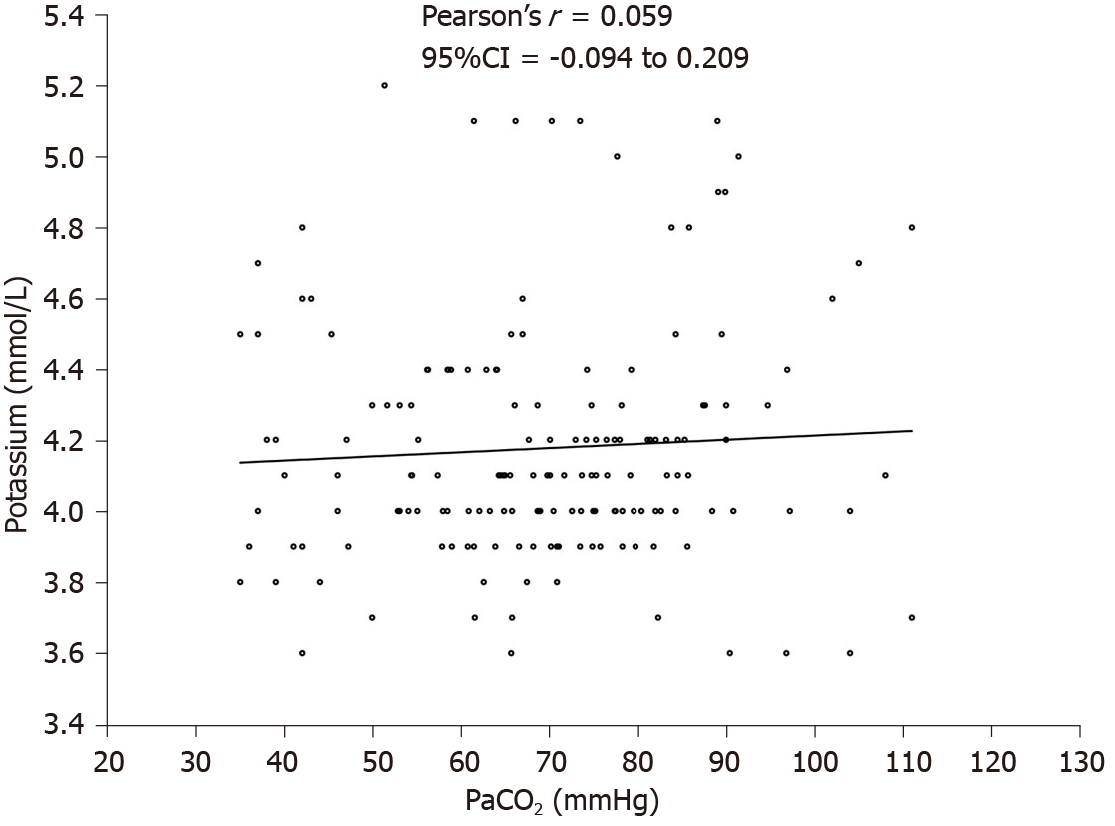
Figure 3 Correlation between arterial carbon dioxide and serum potassium.
- Citation: Weinberg L, Russell A, Mackley L, Dunnachie C, Meyerov J, Tan C, Li M, Hu R, Karalapillai D. Relationship between acute hypercarbia and hyperkalaemia during surgery. World J Clin Cases 2019; 7(22): 3711-3717
- URL: https://www.wjgnet.com/2307-8960/full/v7/i22/3711.htm
- DOI: https://dx.doi.org/10.12998/wjcc.v7.i22.3711


