Copyright
©The Author(s) 2019.
World J Clin Cases. Nov 26, 2019; 7(22): 3698-3710
Published online Nov 26, 2019. doi: 10.12998/wjcc.v7.i22.3698
Published online Nov 26, 2019. doi: 10.12998/wjcc.v7.i22.3698
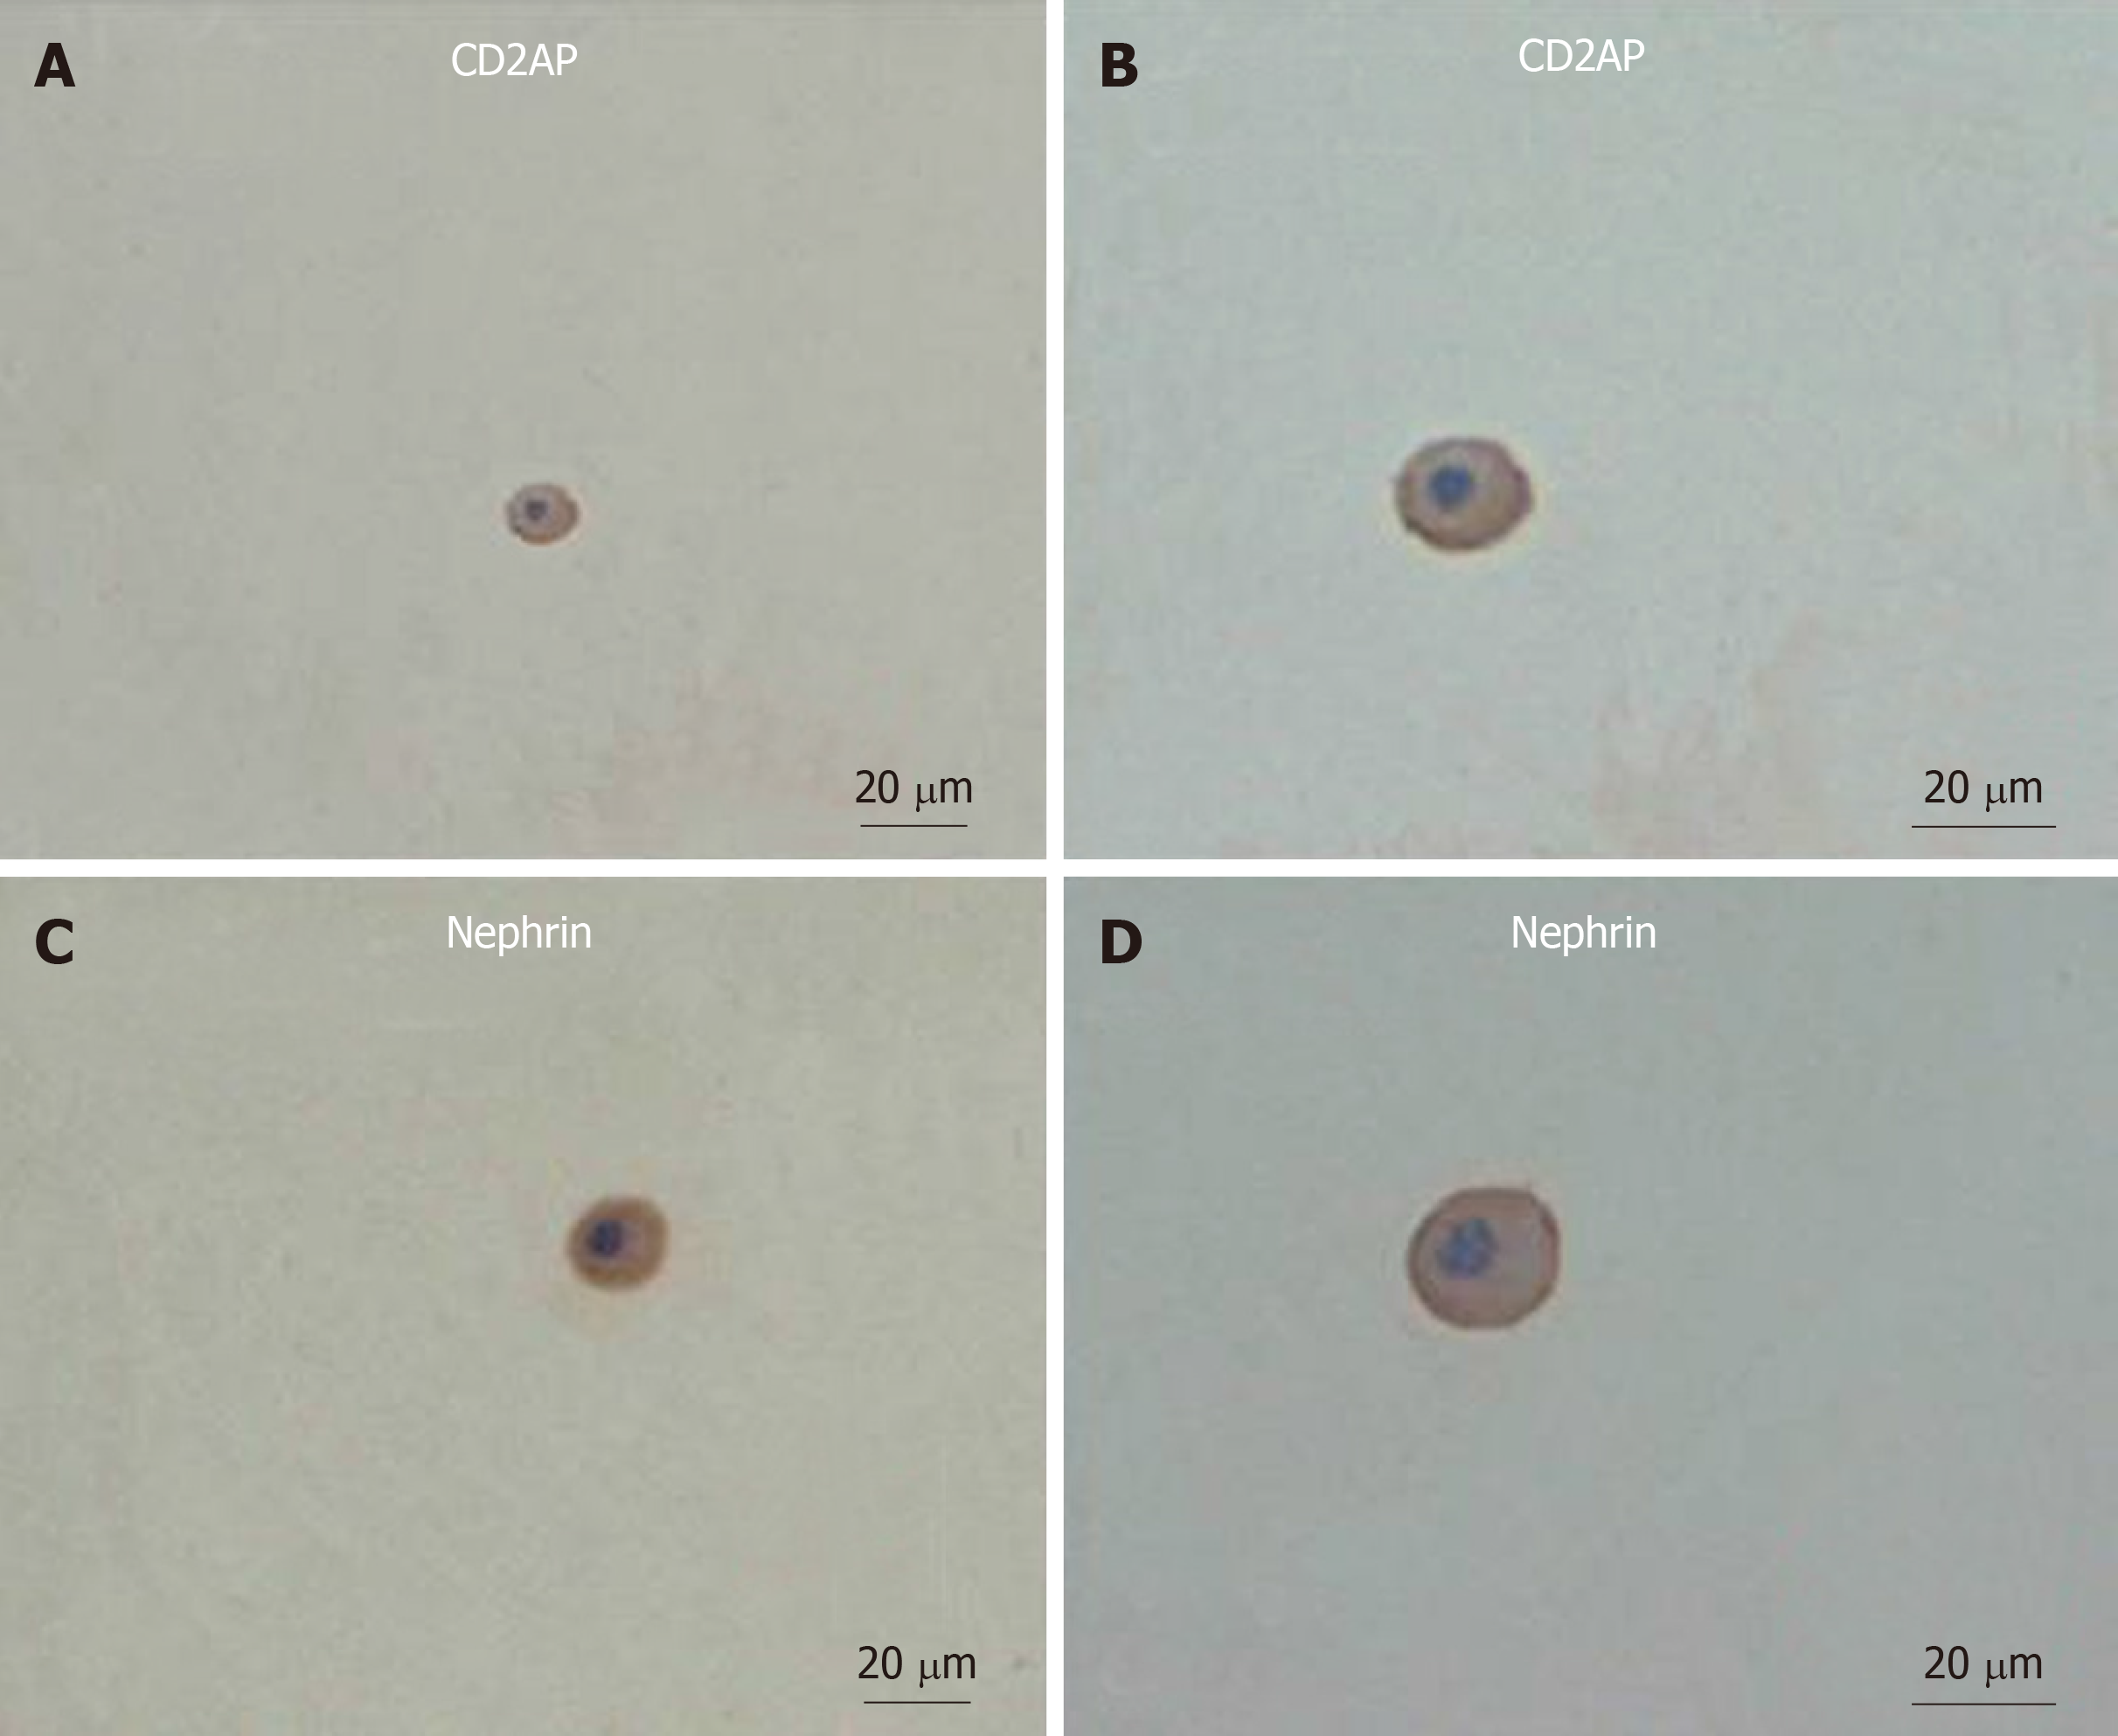
Figure 1 Immunocytochemical staining of urinary podocytes in the hypertension group.
A: Podocyte expression of CD2-associated protein (CD2AP) (original magnification, × 20); B: Podocyte expression of CD2AP (original magnification, × 40); C: Podocyte expression of nephrin (original magnification, × 20); D: Podocyte expression of nephrin (original magnification, × 40). All cells were nucleated. Scale bars = 20 μm. CD2AP: CD2-associated protein.
Figure 2 Immunofluorescence staining of urinary podocytes in the hypertension group.
A: Podocyte expression of nephrin (red, original magnification, × 40); B: Podocyte expression of CD2-associated protein (CD2AP) (green, original magnification, × 40); C: Co-expression of nephrin and CD2AP (yellow, original magnification, × 40).
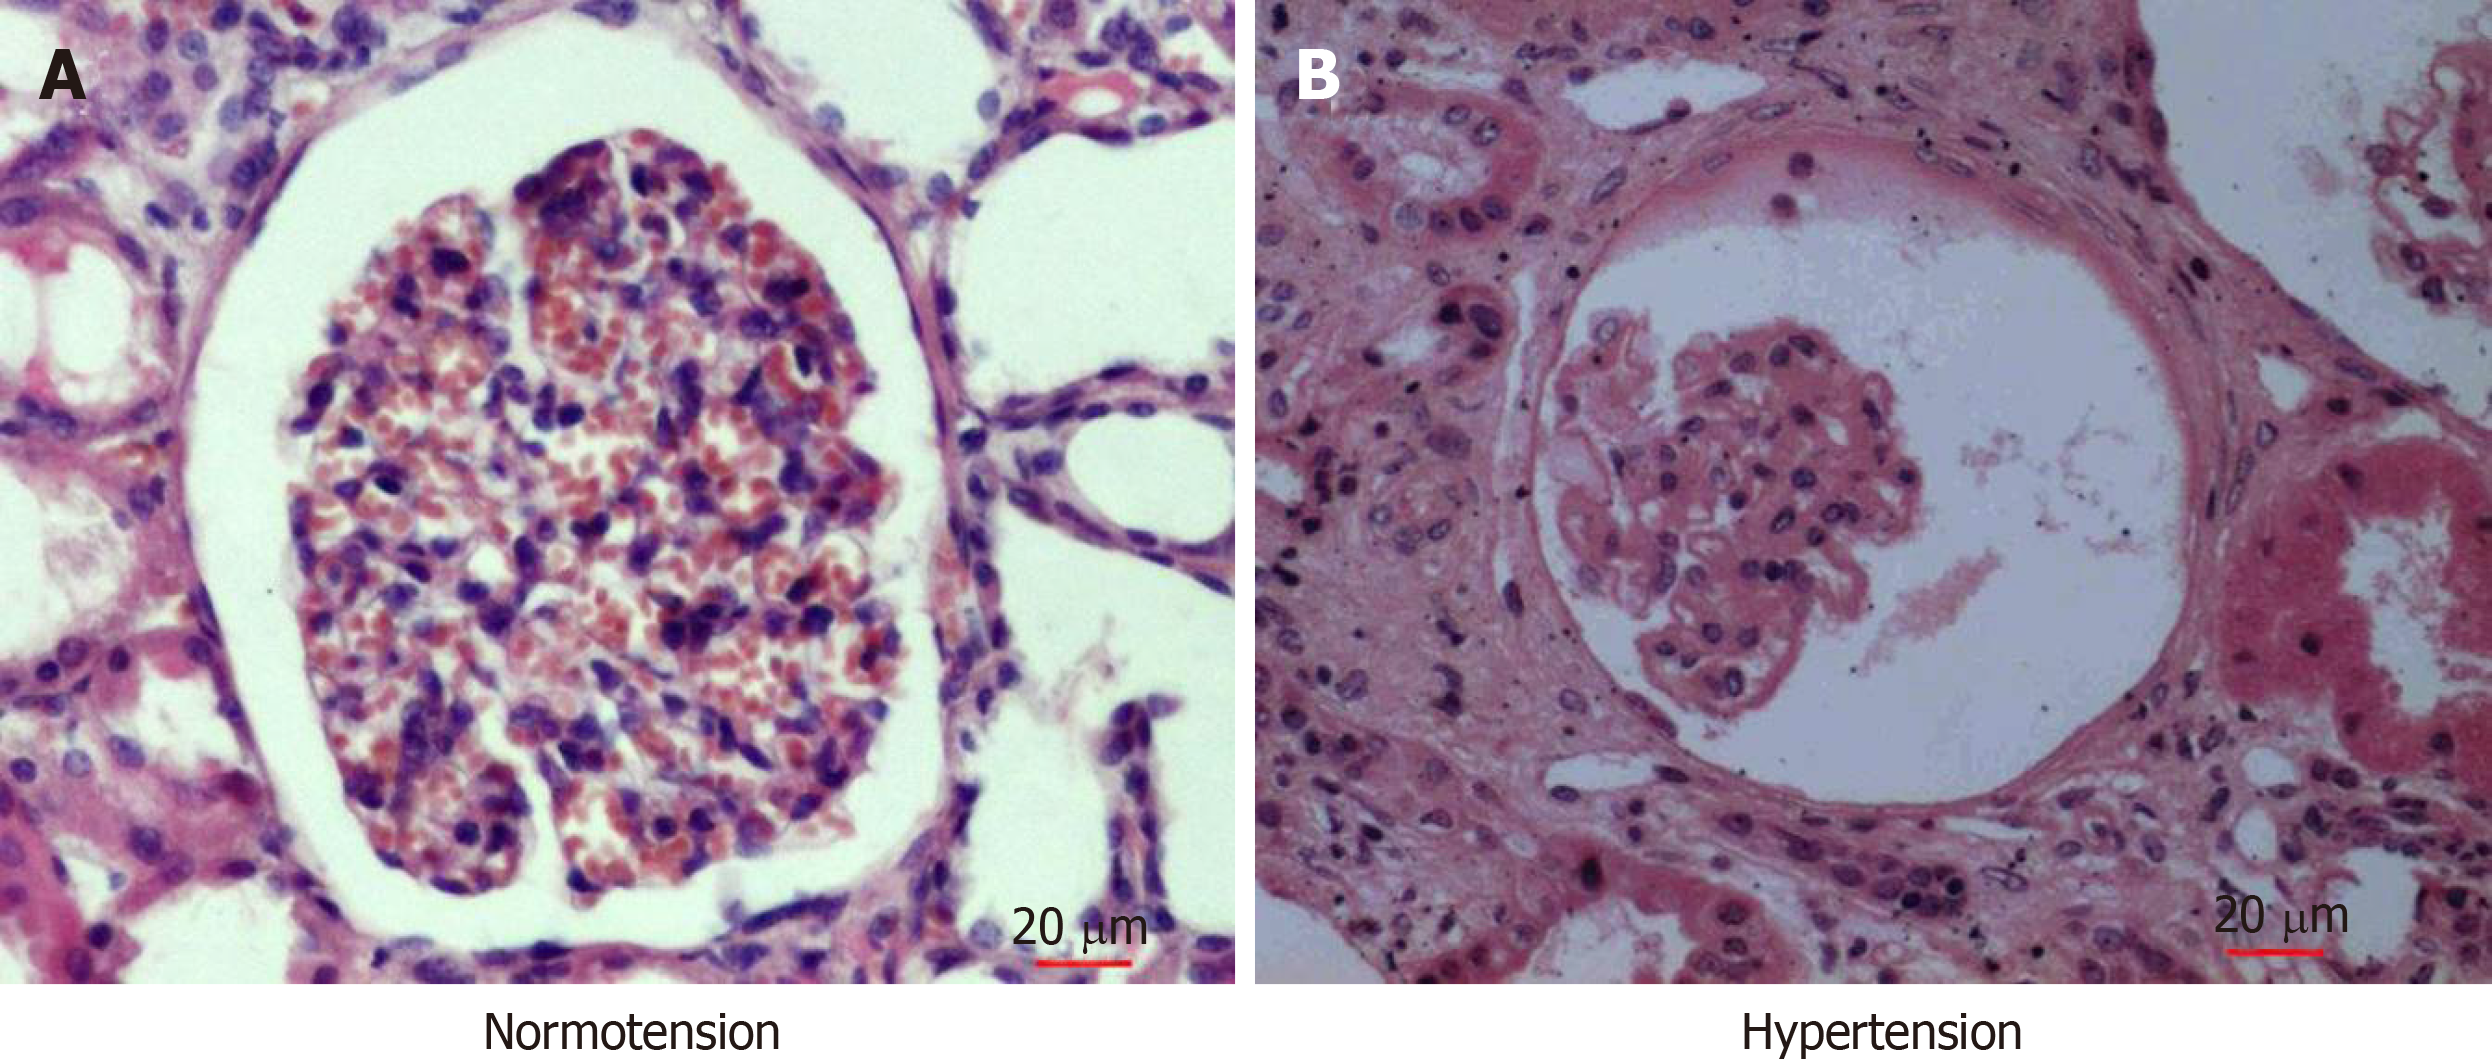
Figure 3 Light micrographs of human renal cortical tissues stained with hematoxylin and eosin.
Renal tissues from patients in control group 2 who underwent partial nephrectomy due to renal trauma (A) and patients in the hypertension group (B). General morphology of glomeruli from nephrectomized kidney was normal, and the capillary loops were smooth and plump (A). Under hypertensive conditions, the glomeruli showed severe atrophy, the capillary loops became severely wizened or obliterated, and Bowman’s capsule and the luminal space of tubules were wide open (B). Scale bars = 20 μm.
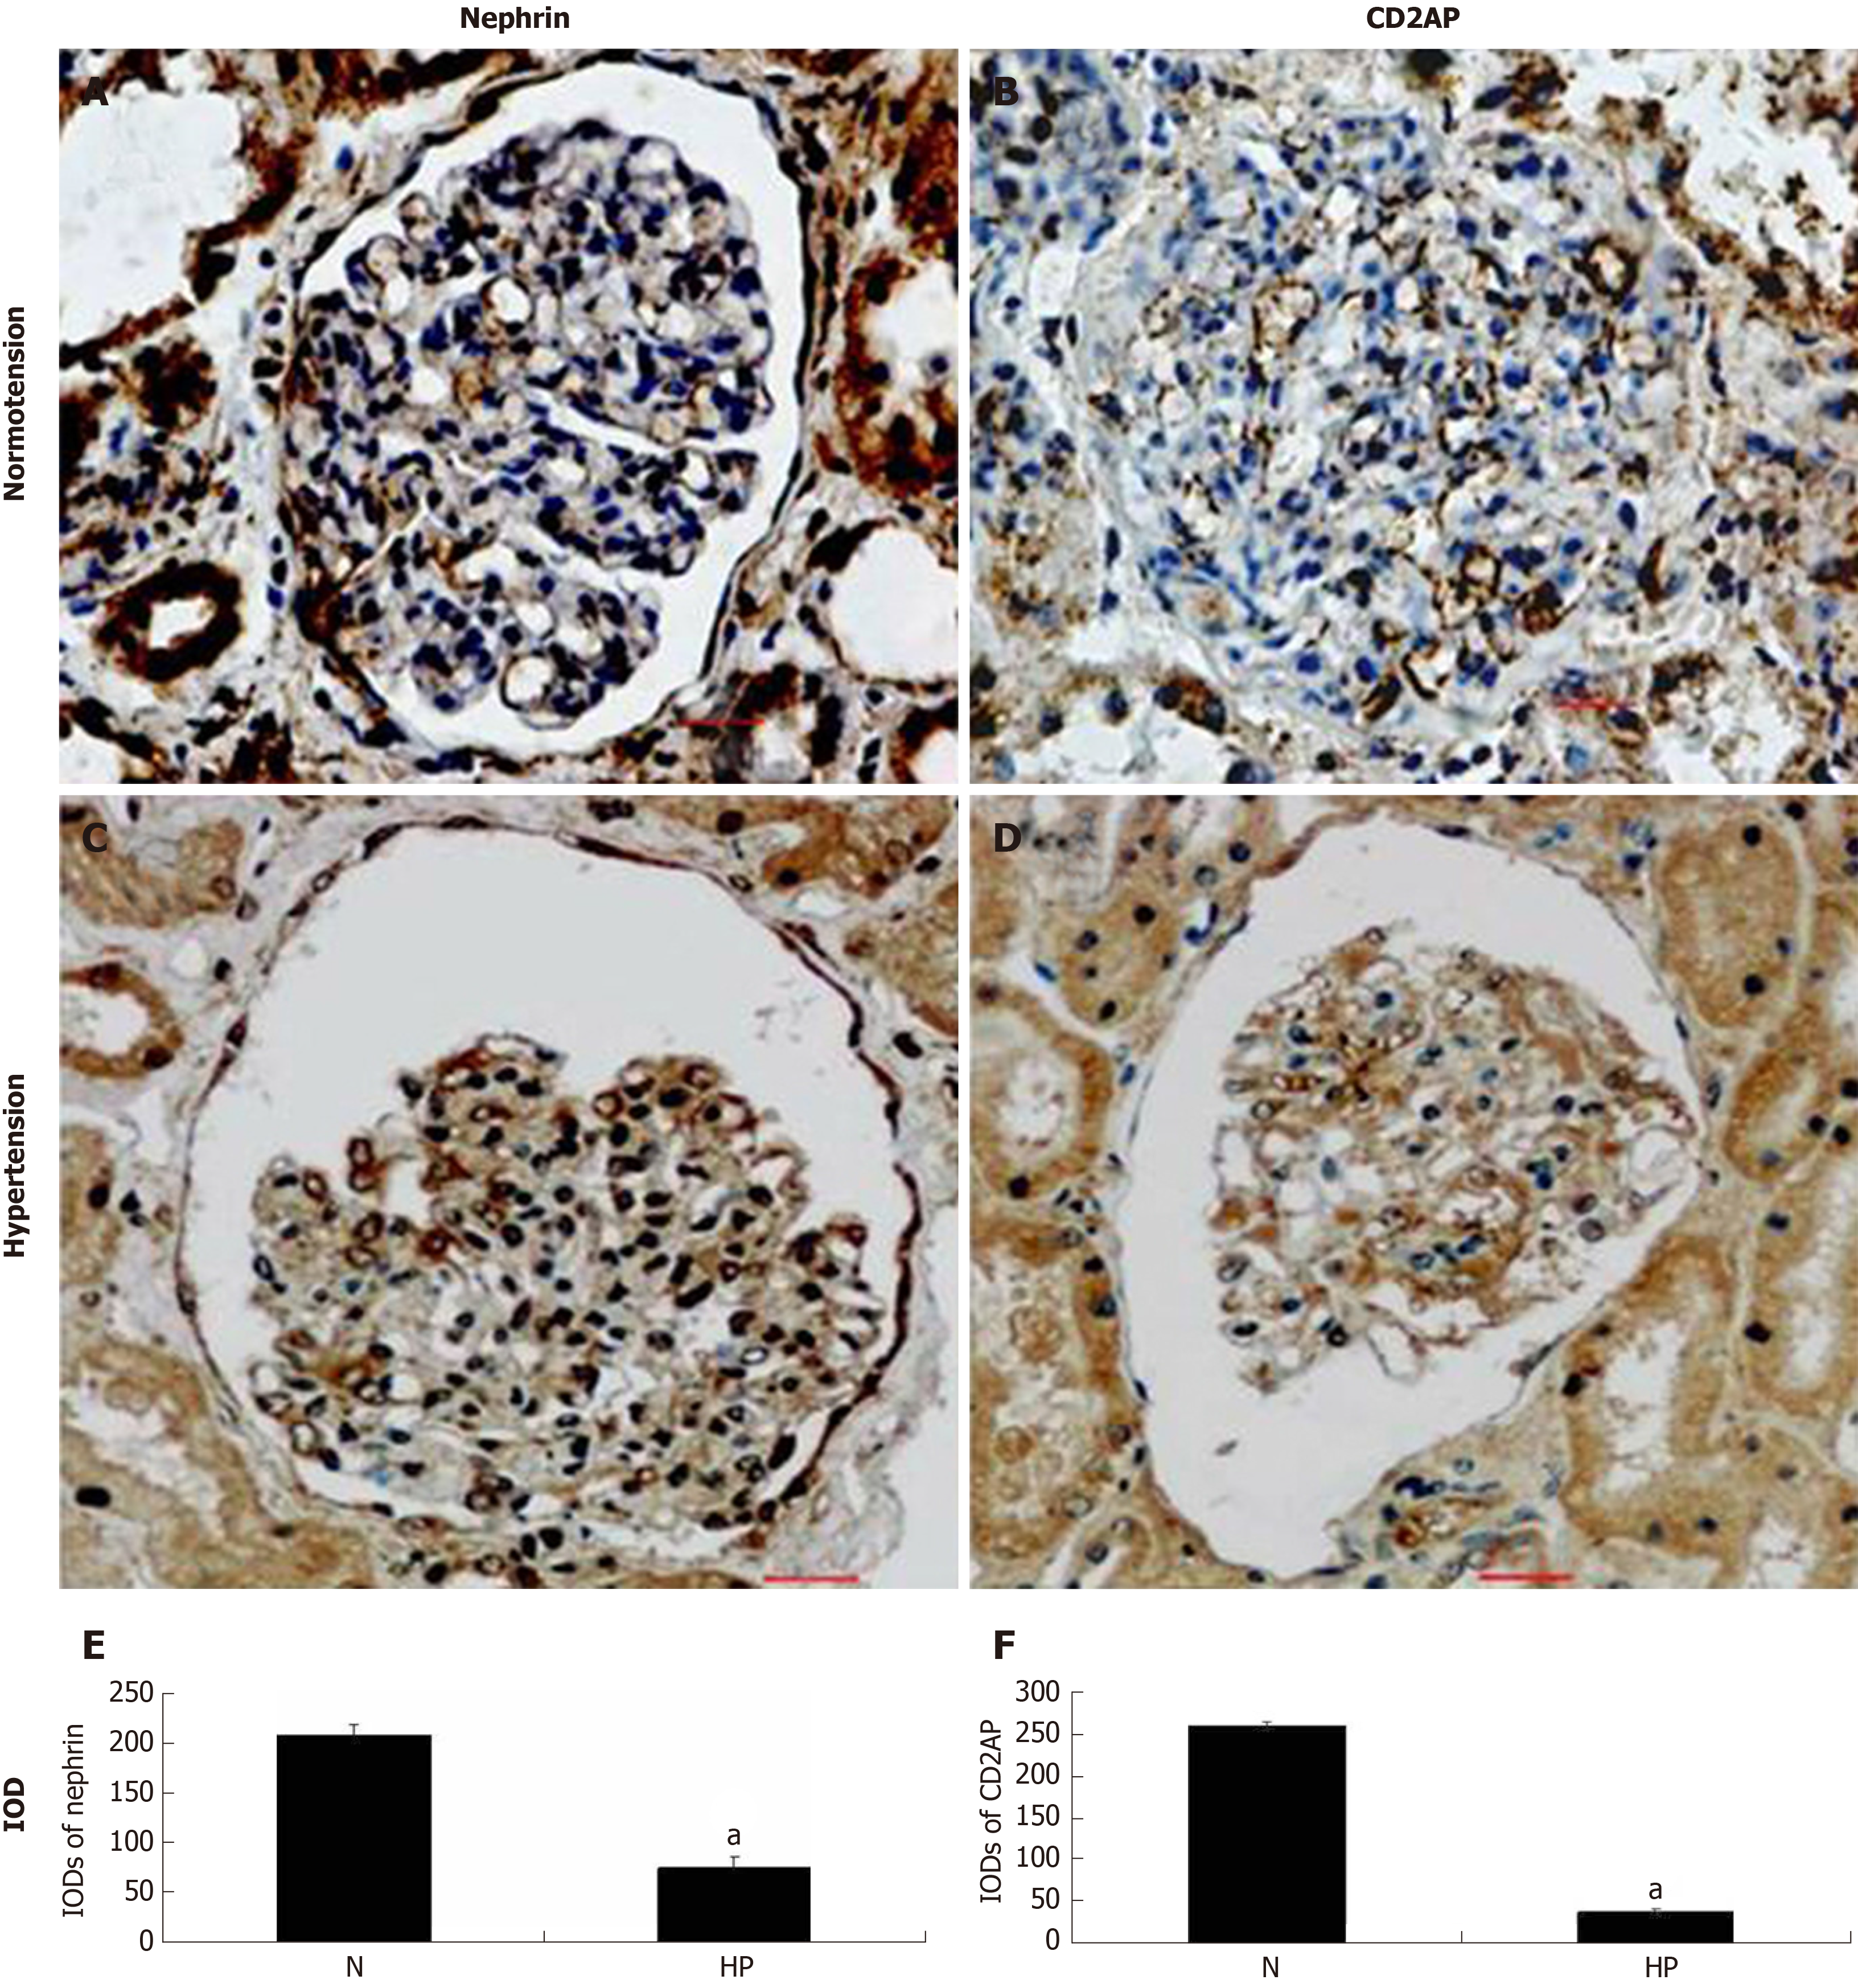
Figure 4 Expression of nephrin and CD2-associated protein in human renal tissue by immunohistochemical staining.
Tissues were treated with immersion-fixation methods under various hemodynamic conditions. A, C: The localization of nephrin; B, D: The localization of CD2-associated protein; E, F: The integral optical densities of each protein under various hemodynamic conditions. Immunohistochemical localization of both proteins in paraffin-embedded tissue is shown under normotensive (A, B) and hypertensive (C, D) conditions. Scale bar = 20 μm. Histogram shows integral optical density of each protein. aP < 0.05, Normotension vs Hypertension. N: Normotension; HP: Hypertension; IODs: Integral optical densities; CD2AP: CD2-associated protein.
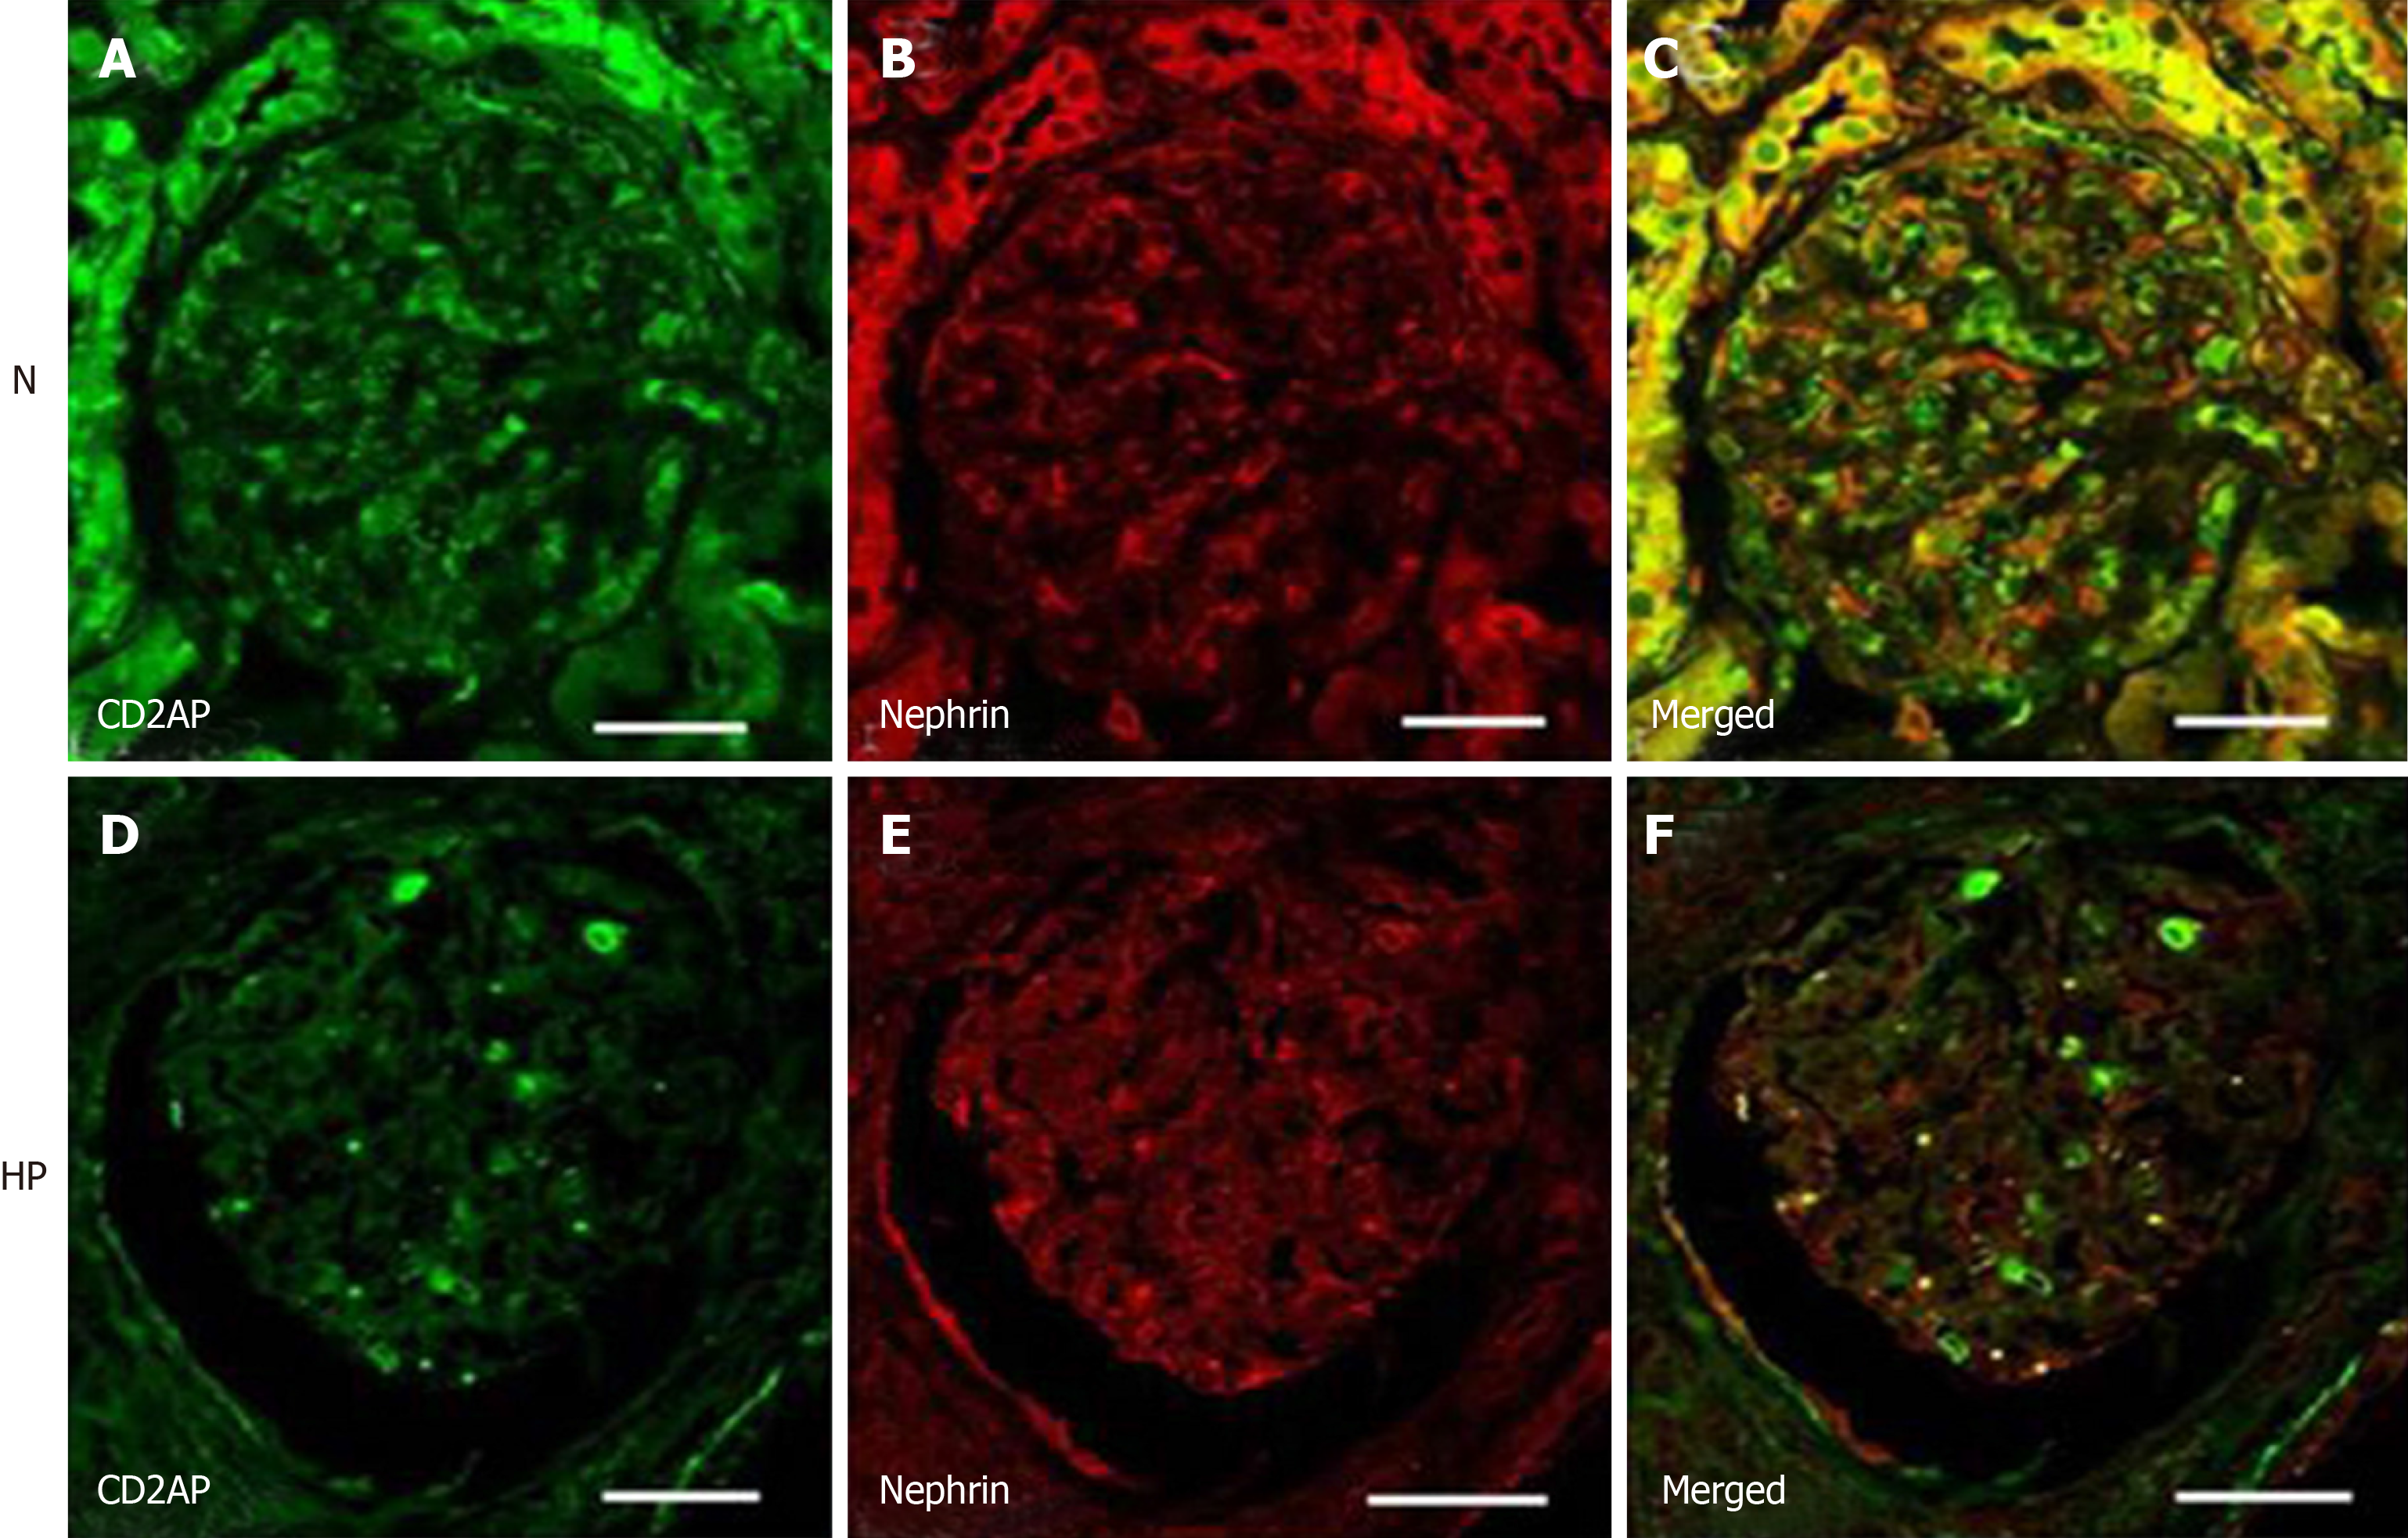
Figure 5 Confocal laser scanning micrographs show double immunofluorescence of nephrin–CD2-associated protein under normotensive and hypertensive conditions.
Under normotensive conditions, double immunofluorescence staining showed that CD2-associated protein (CD2AP) (A) and nephrin (B) partially colocalized along the basement membrane of glomeruli (C). Under hypertensive conditions, the immunoreactivity of CD2AP and nephrin decreased and stained intermittently (D-F). Scale bar = 20 μm. CD2AP: CD2-associated protein; N: Normotension; HP: Hypertension.
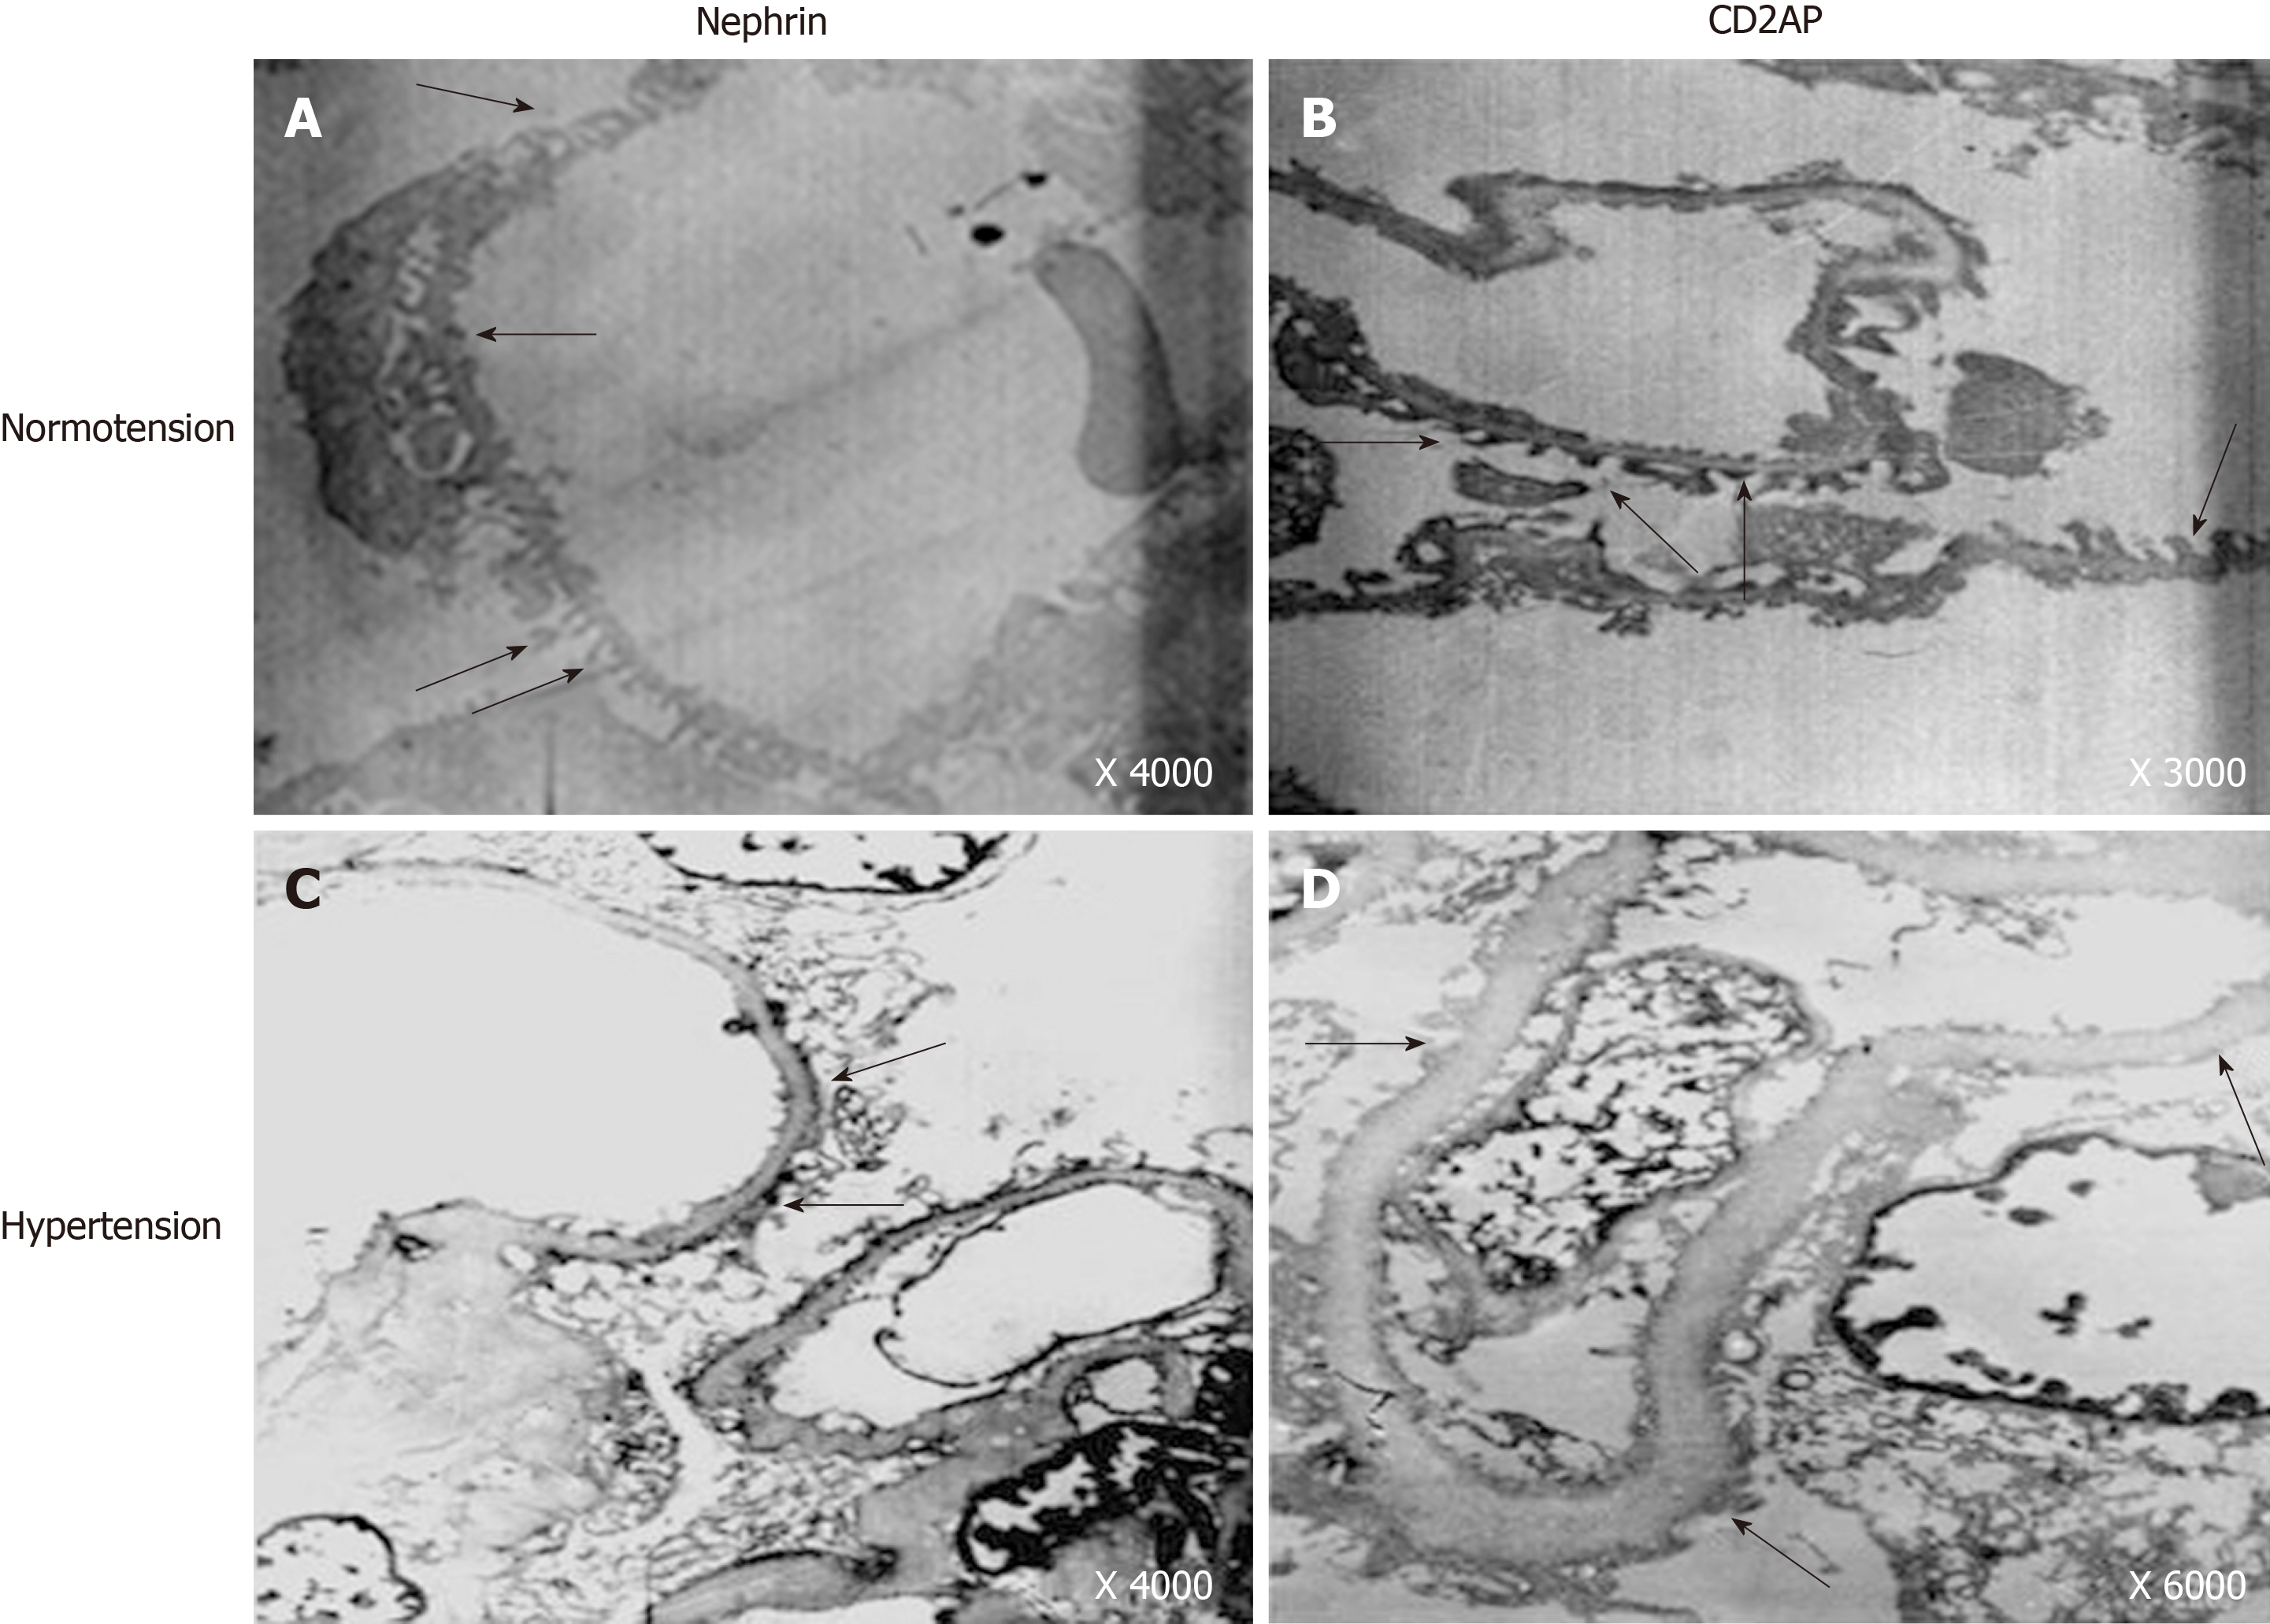
Figure 6 Immunoelectron micrographs of nephrin and CD2-associated protein in glomeruli under normotensive and hypertensive conditions.
Under normotensive conditions, the foot processes were intact and displayed as interdigitating (A, B, arrows). In contrast, the foot processes showed different degrees of fusion and partial foot process effacement under hypertensive conditions (C, D). Nephrin was distributed on the cytoplasmic face of foot processes in many filtration slits (A, arrows), and CD2-associated protein (CD2AP) had similar distribution characteristics (B, arrows). Under hypertensive conditions, the staining of nephrin and CD2AP was scattered and uneven, and accumulated in some fusion foot processes, but the overall level decreased (C, D, arrows). CD2AP: CD2-associated protein.
- Citation: Sun D, Wang JJ, Wang W, Wang J, Wang LN, Yao L, Sun YH, Li ZL. Human podocyte injury in the early course of hypertensive renal injury. World J Clin Cases 2019; 7(22): 3698-3710
- URL: https://www.wjgnet.com/2307-8960/full/v7/i22/3698.htm
- DOI: https://dx.doi.org/10.12998/wjcc.v7.i22.3698


