Copyright
©The Author(s) 2019.
World J Clin Cases. Nov 6, 2019; 7(21): 3603-3614
Published online Nov 6, 2019. doi: 10.12998/wjcc.v7.i21.3603
Published online Nov 6, 2019. doi: 10.12998/wjcc.v7.i21.3603
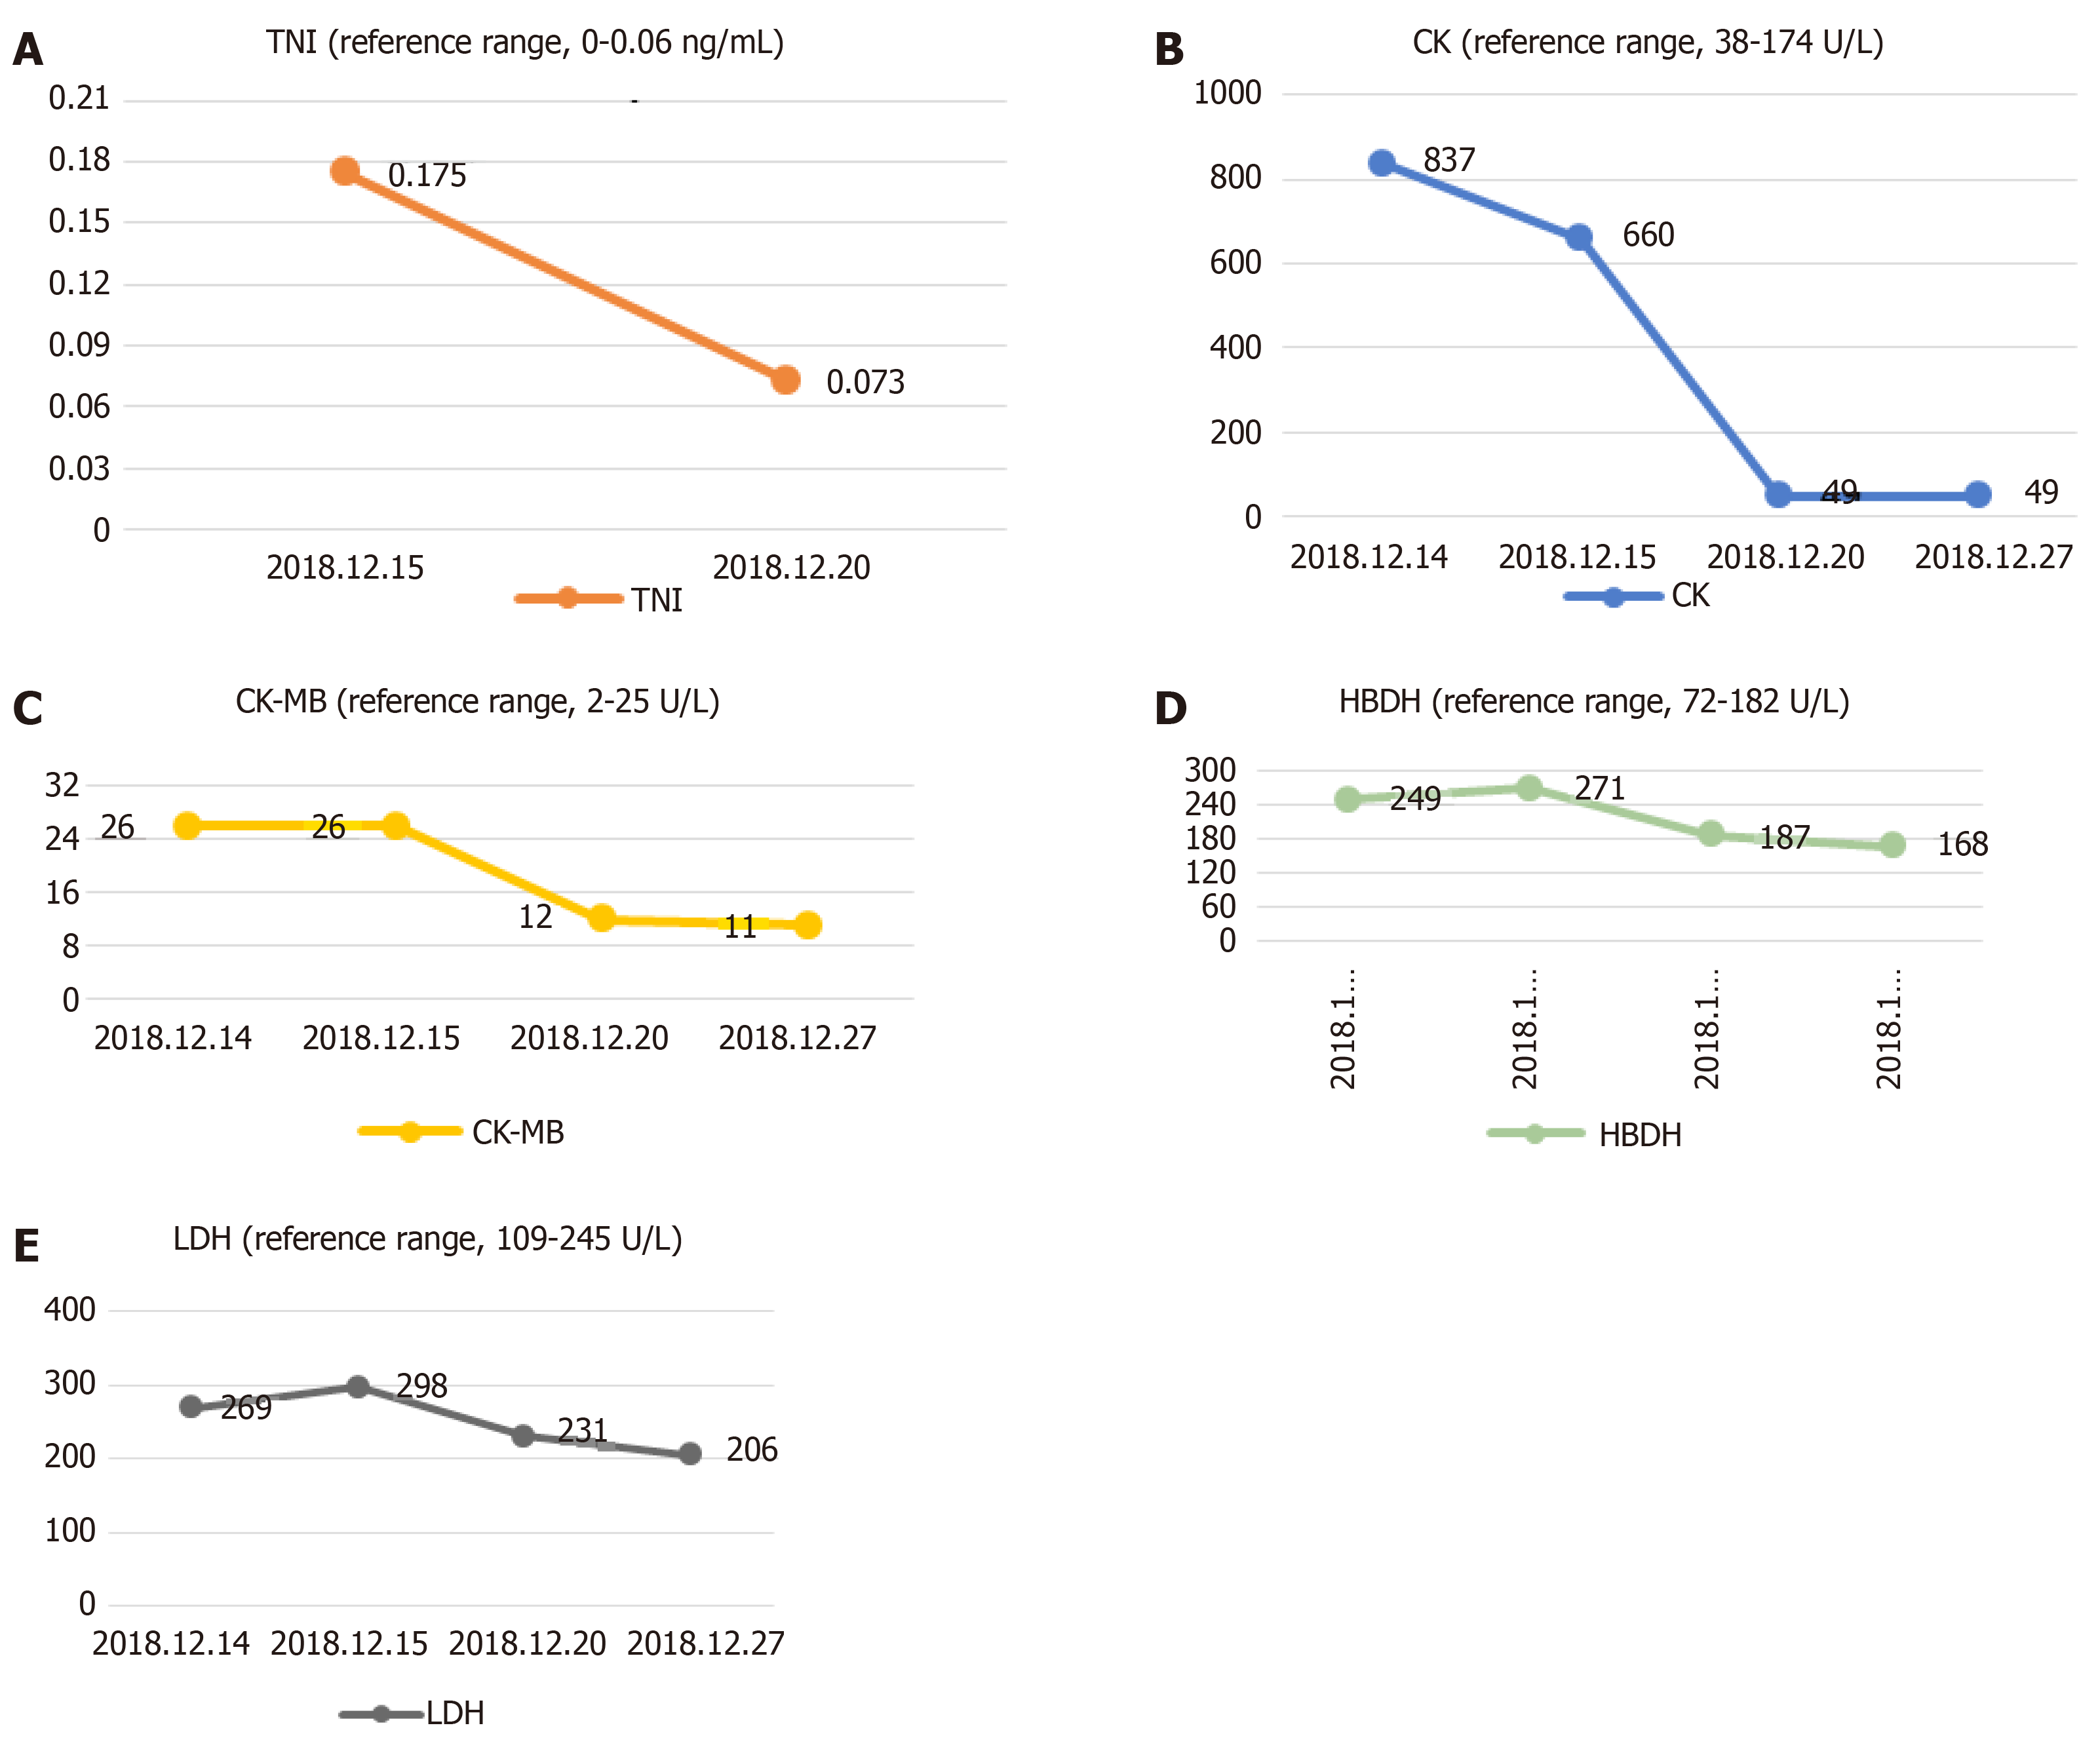
Figure 1 Change trend of troponin I, creatine kinase, creatine kinase isoenzyme, hydroxybutyrate dehydrogenase and lactate dehydrogenase.
A: Change trend of troponin I; B: Change trend of creatine kinase; C: Change trend of creatine kinase isoenzyme; D: Change trend of hydroxybutyrate dehydrogenase; E: Change trend of lactate dehydrogenase.
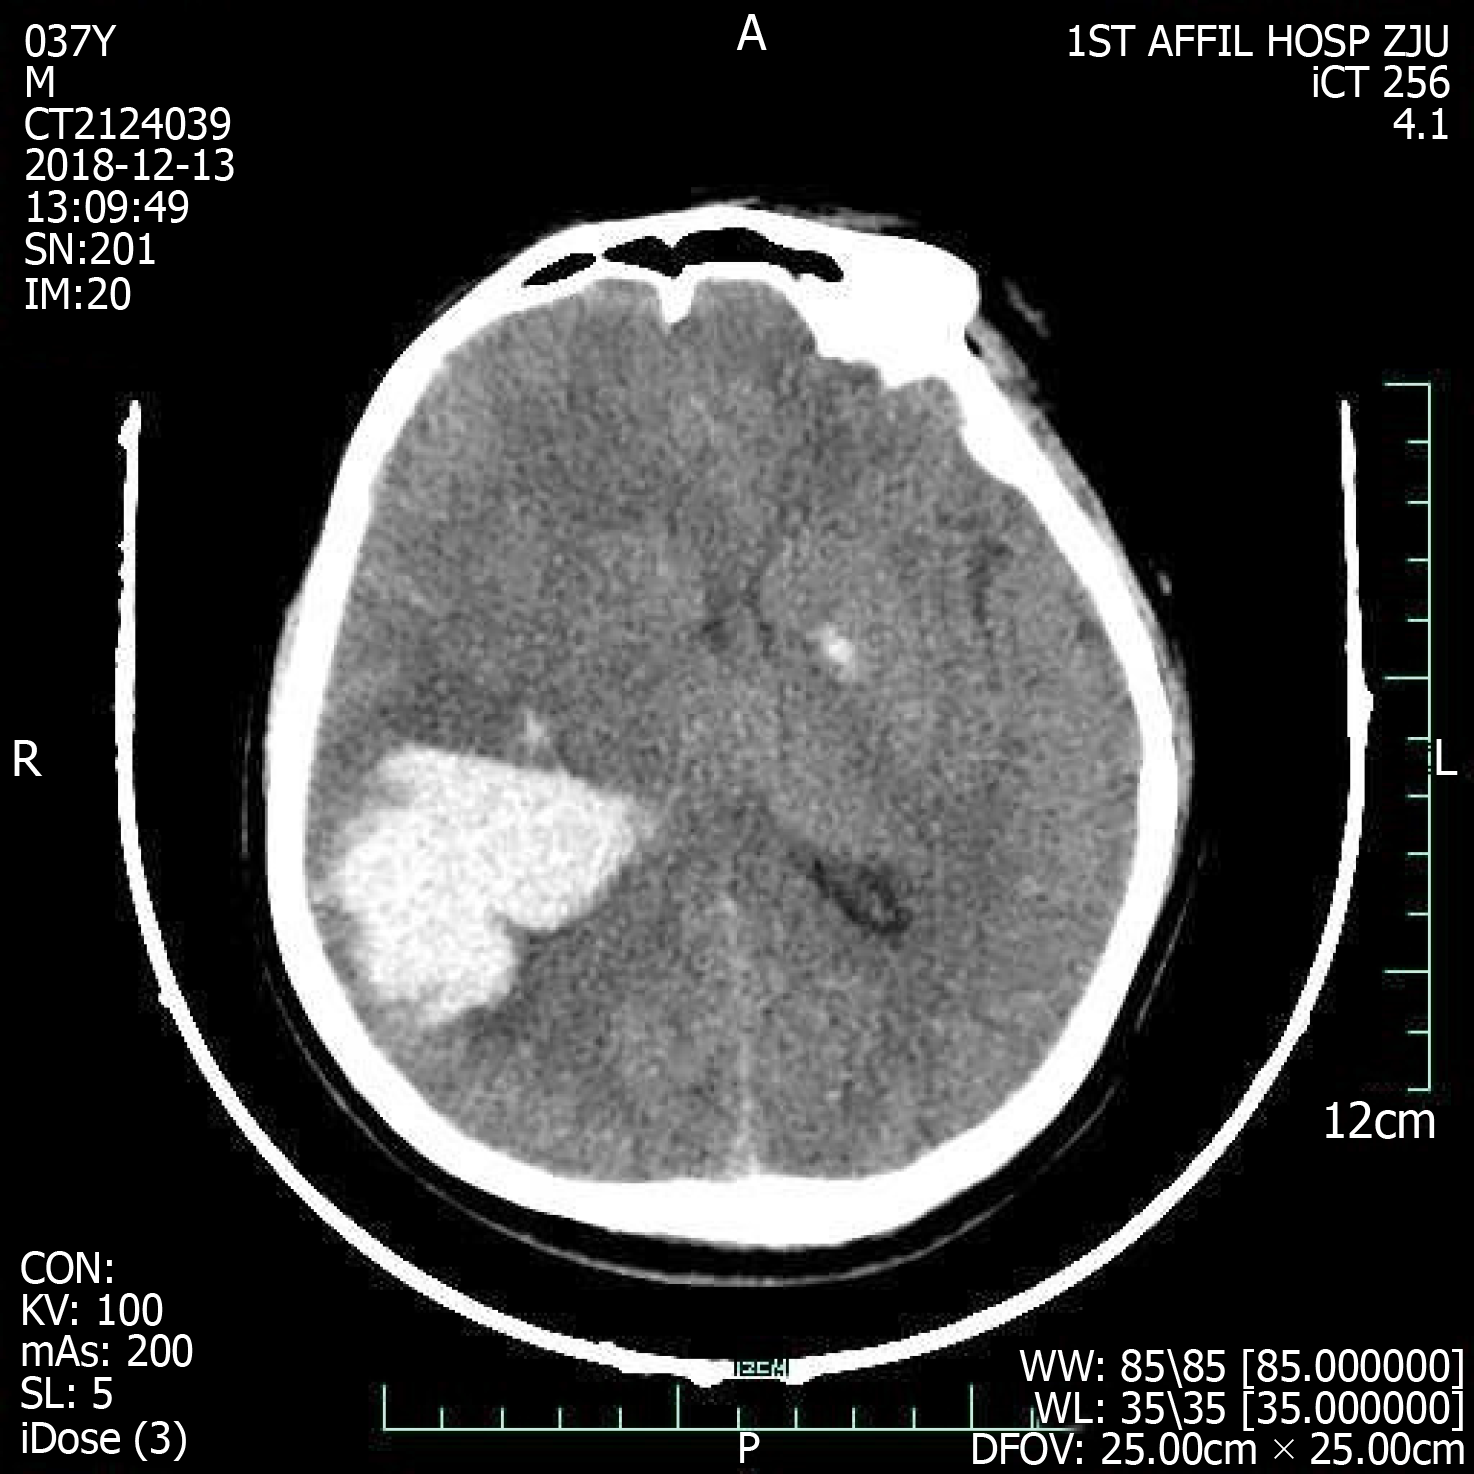
Figure 2 Cranial computed tomography evinced cerebral hemorrhage in parietal and occipital lobes dimensions 40 mm × 52 mm × 47 mm.
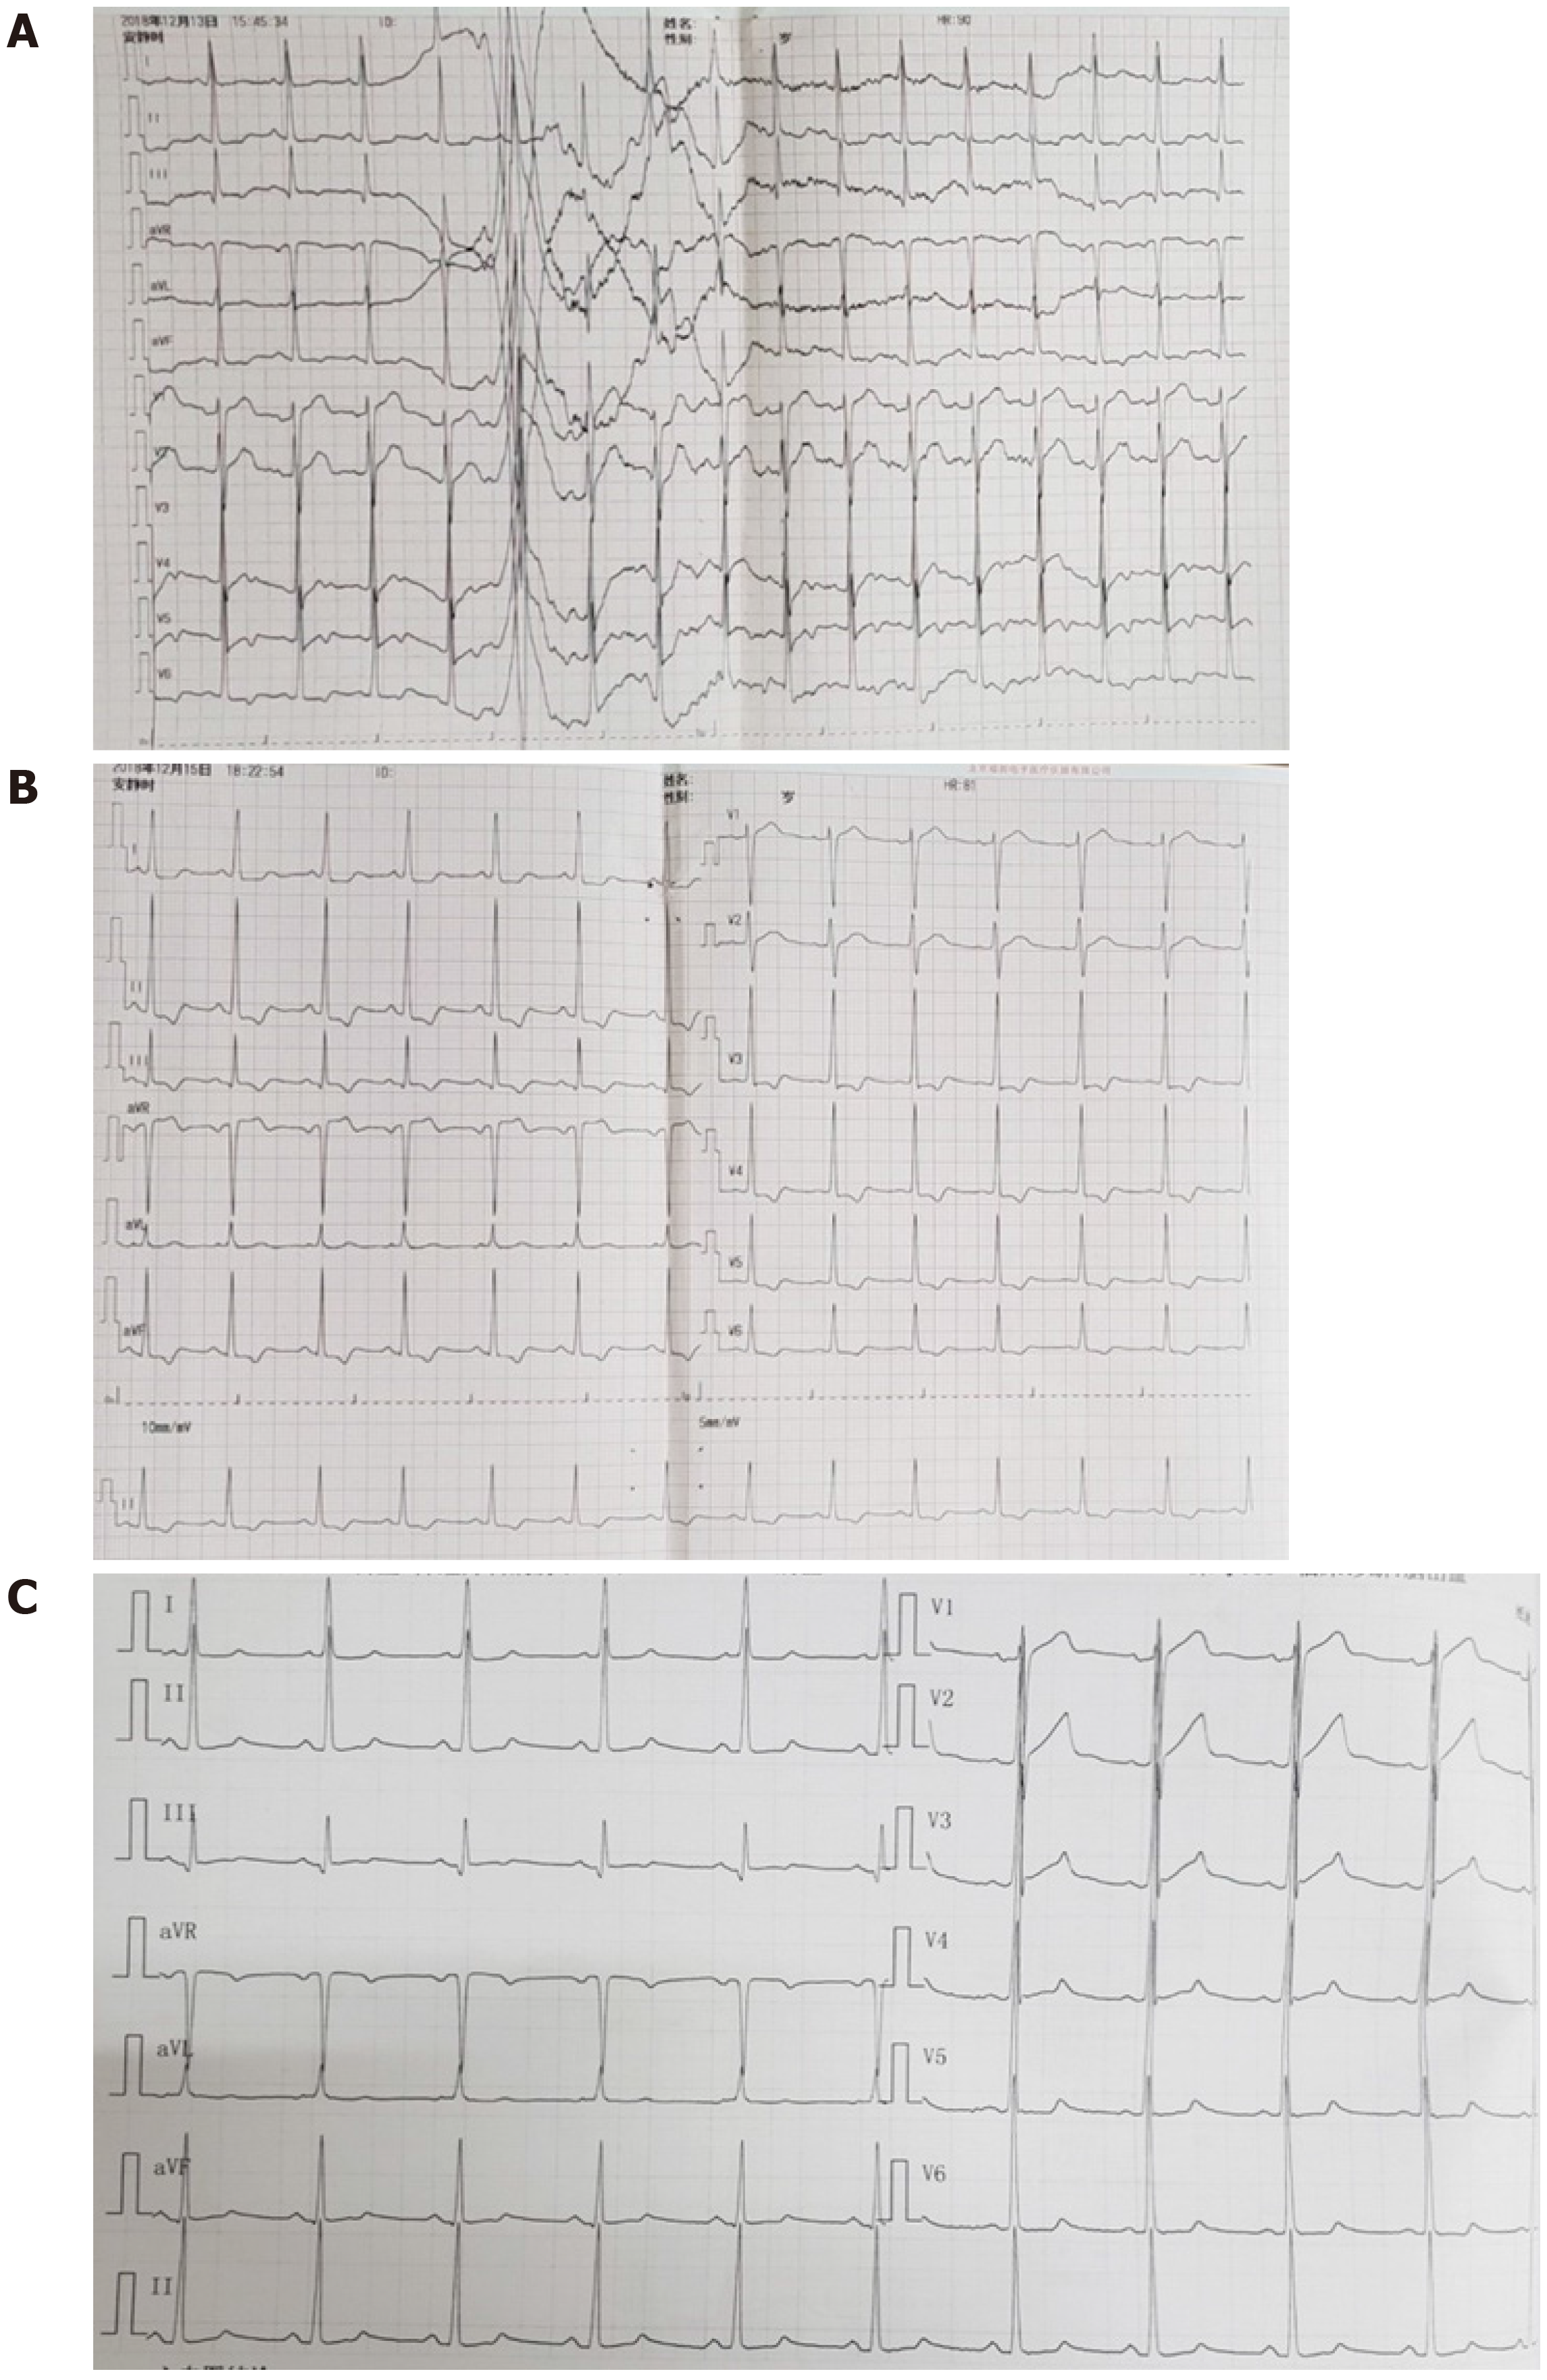
Figure 3 Electrocardiographic.
A: 12-lead Electrocardiographic findings at presentation; B: Electrocardiographic findings at acute left heart failure; C: Electrocardiographic findings at 11 d after left heart failure.
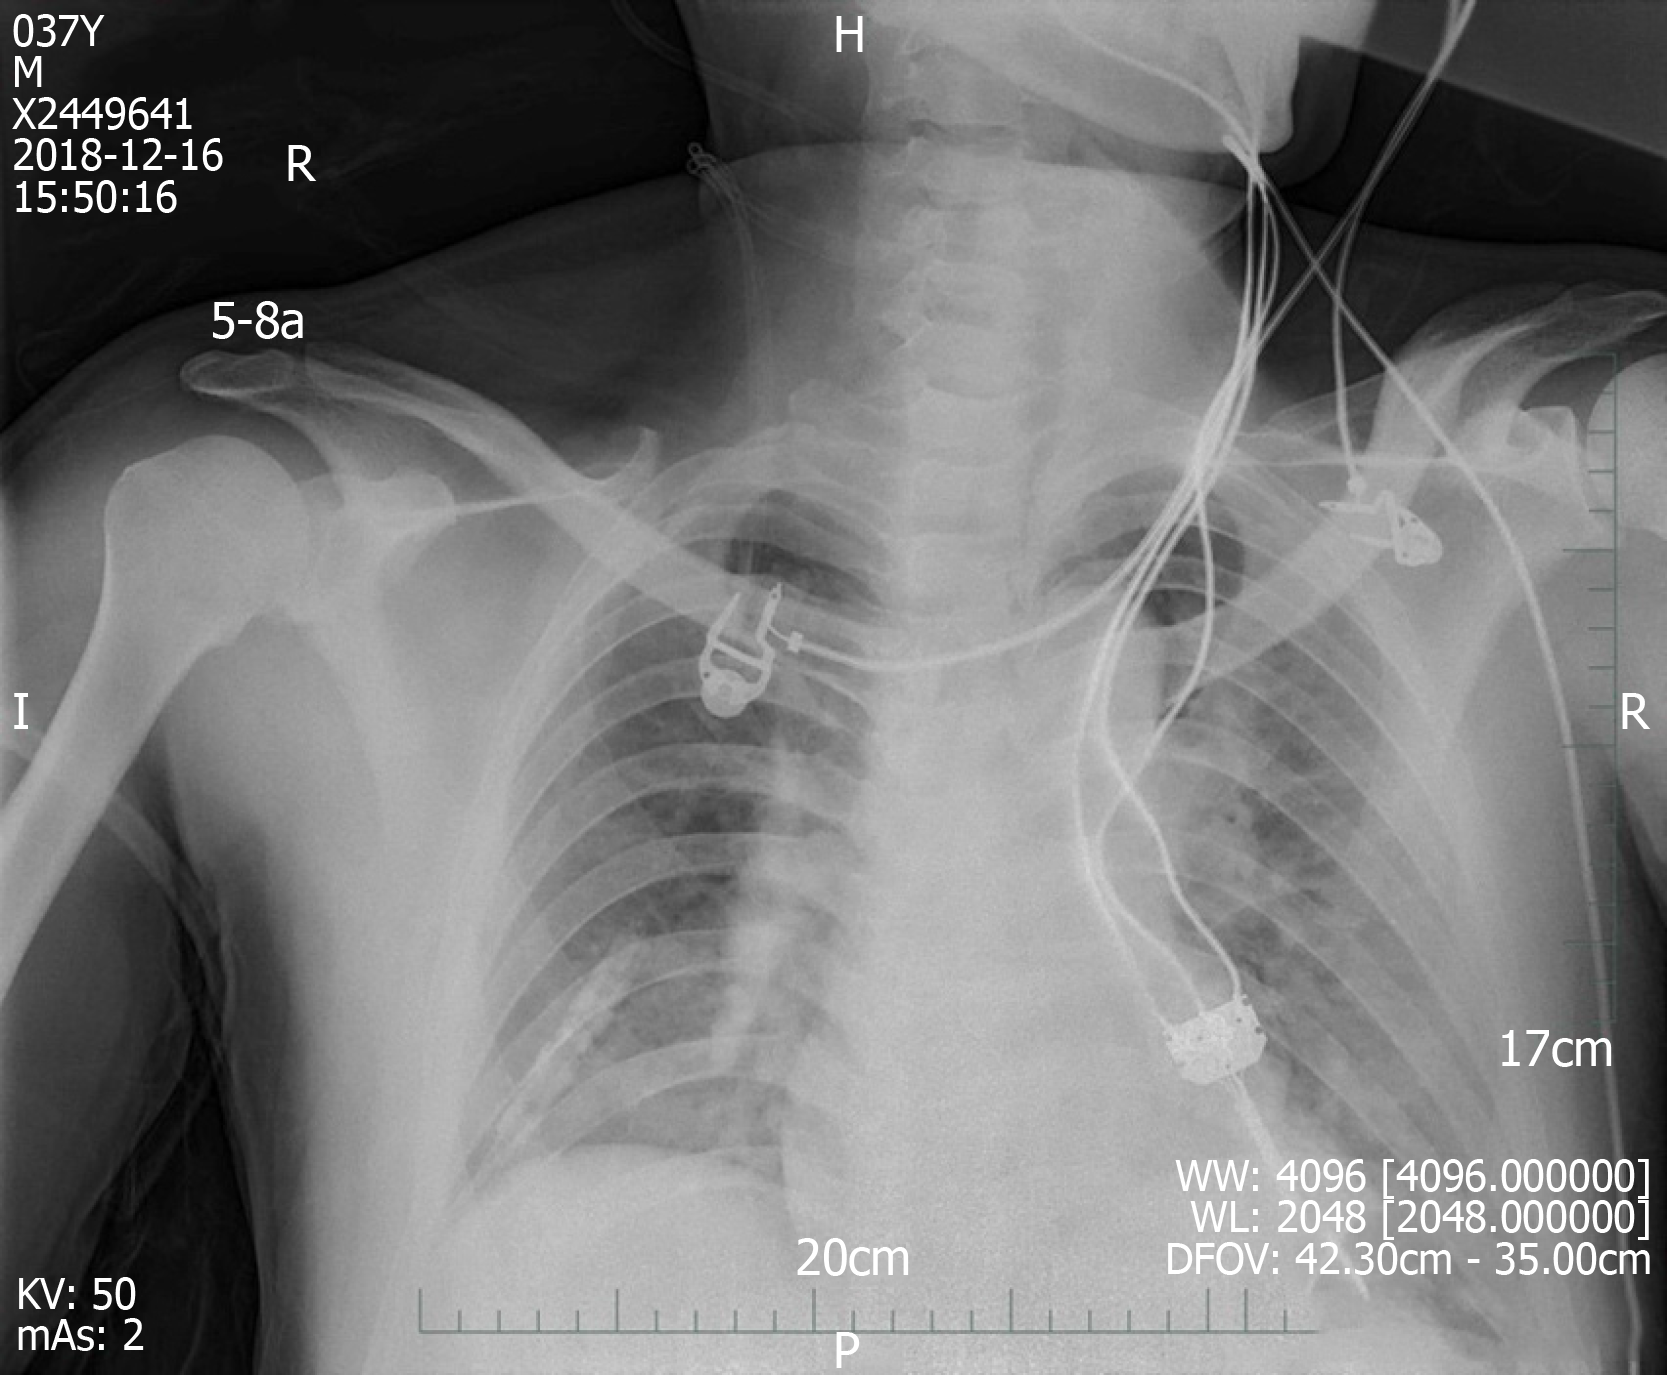
Figure 4 Chest radiography at 1 d after left heart failure.
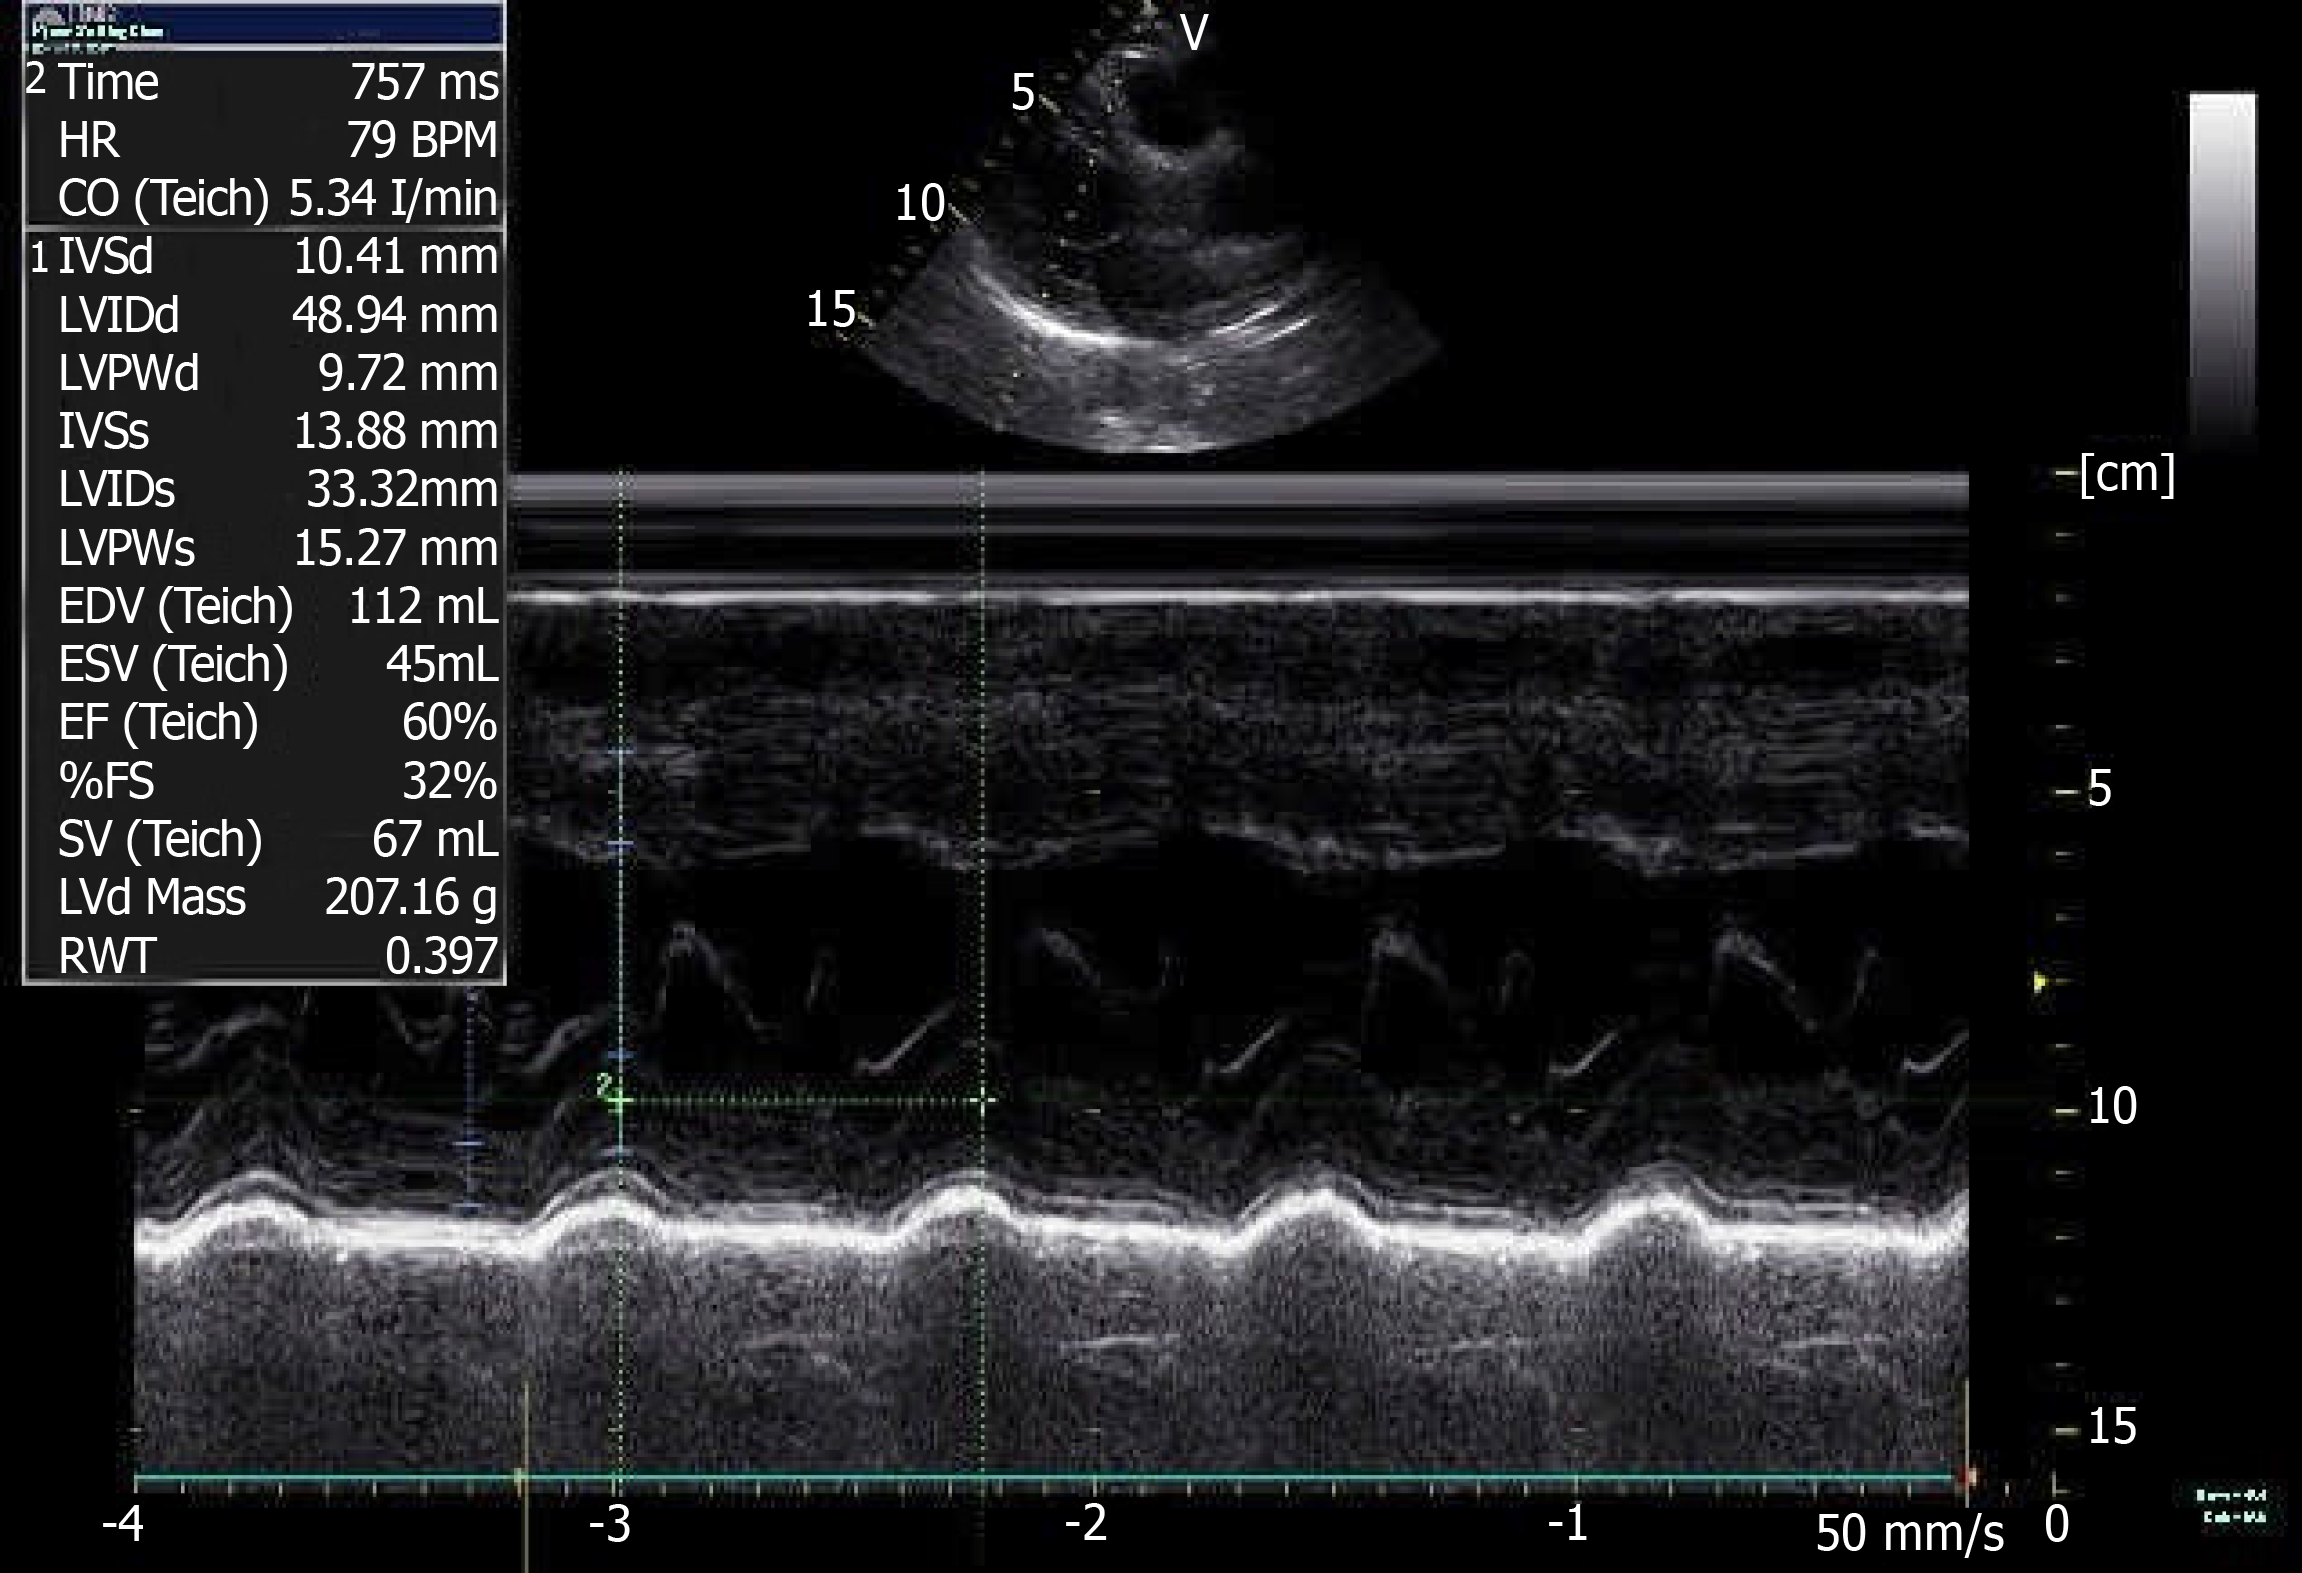
Figure 5 Color doppler echocardiography at 3 d after left heart failure.
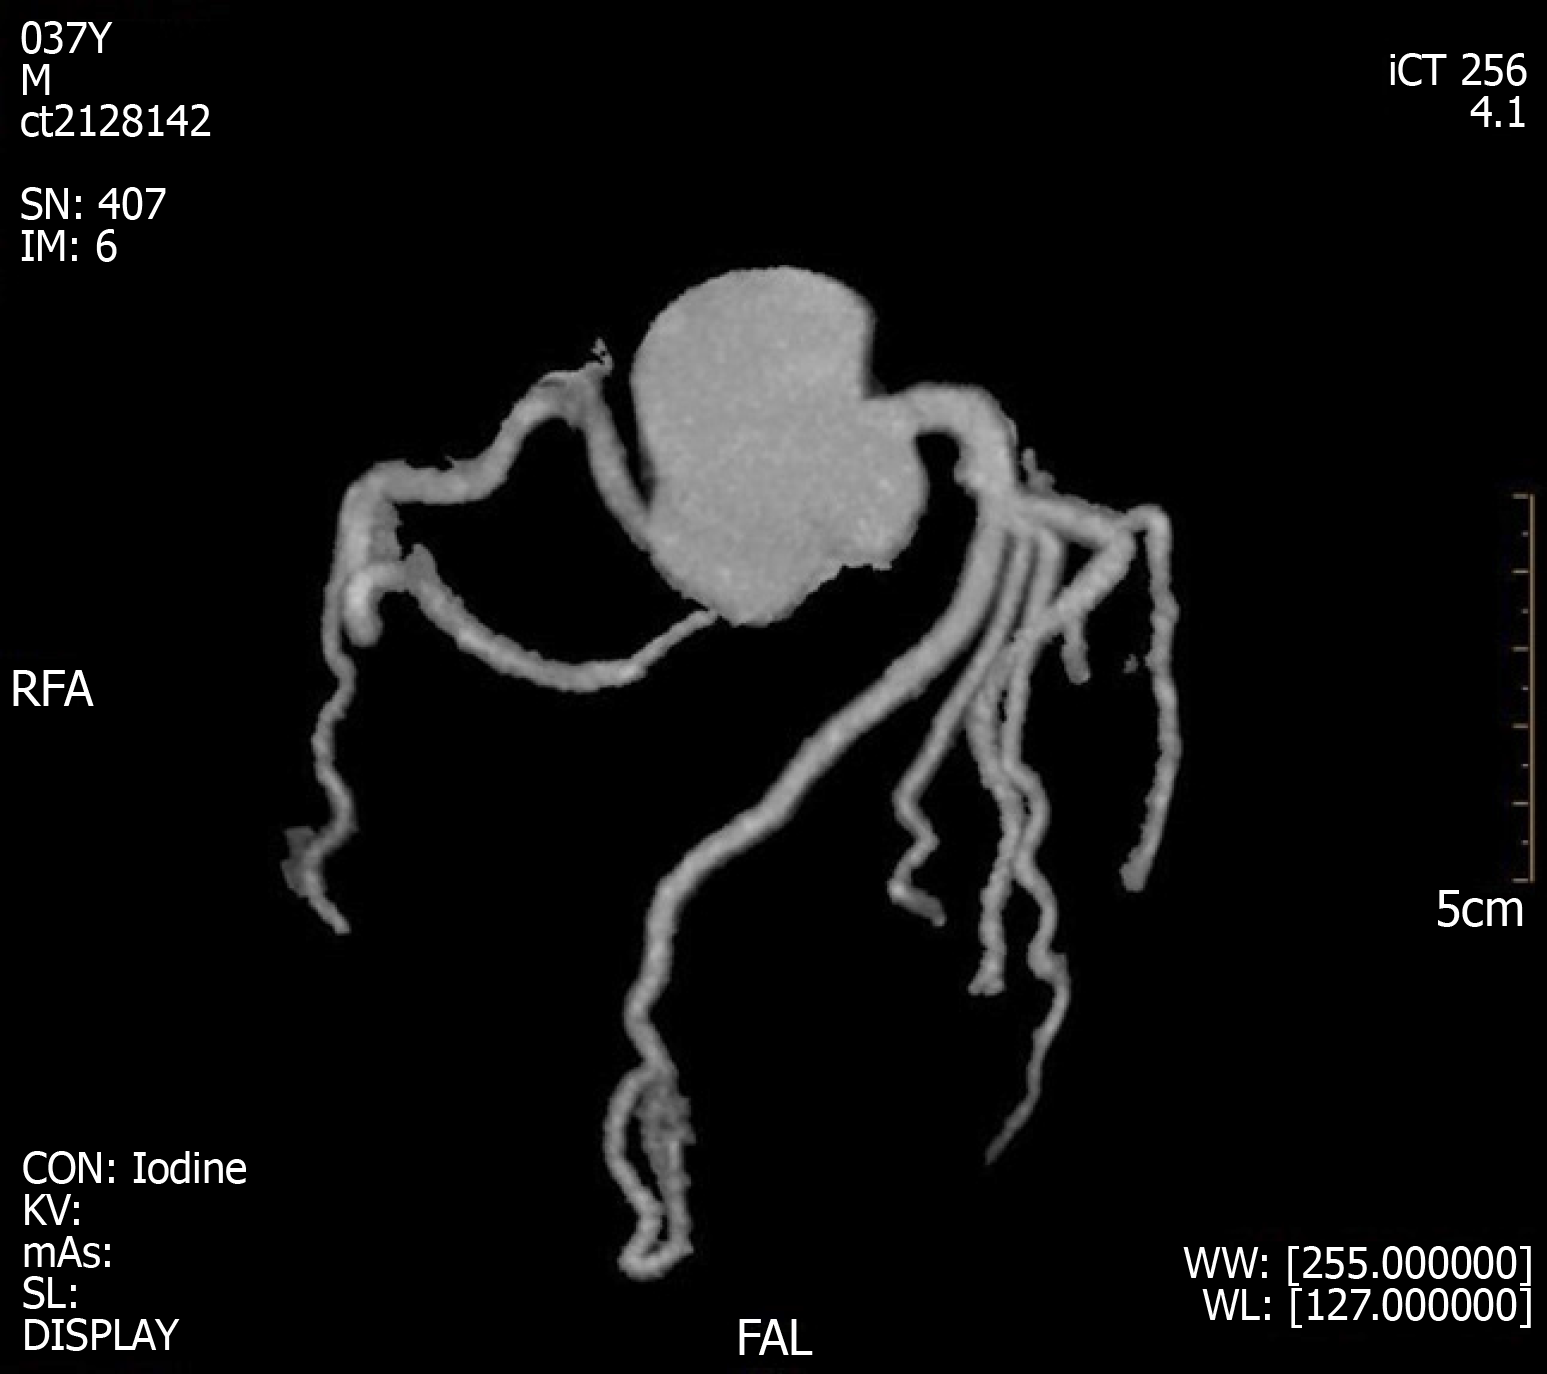
Figure 6 Coronary computed tomography angiogram results at 3 d after left heart failure.
- Citation: Lin XQ, Zheng LR. Myocardial ischemic changes of electrocardiogram in intracerebral hemorrhage: A case report and review of literature. World J Clin Cases 2019; 7(21): 3603-3614
- URL: https://www.wjgnet.com/2307-8960/full/v7/i21/3603.htm
- DOI: https://dx.doi.org/10.12998/wjcc.v7.i21.3603


