Copyright
©The Author(s) 2019.
World J Clin Cases. Oct 26, 2019; 7(20): 3289-3295
Published online Oct 26, 2019. doi: 10.12998/wjcc.v7.i20.3289
Published online Oct 26, 2019. doi: 10.12998/wjcc.v7.i20.3289
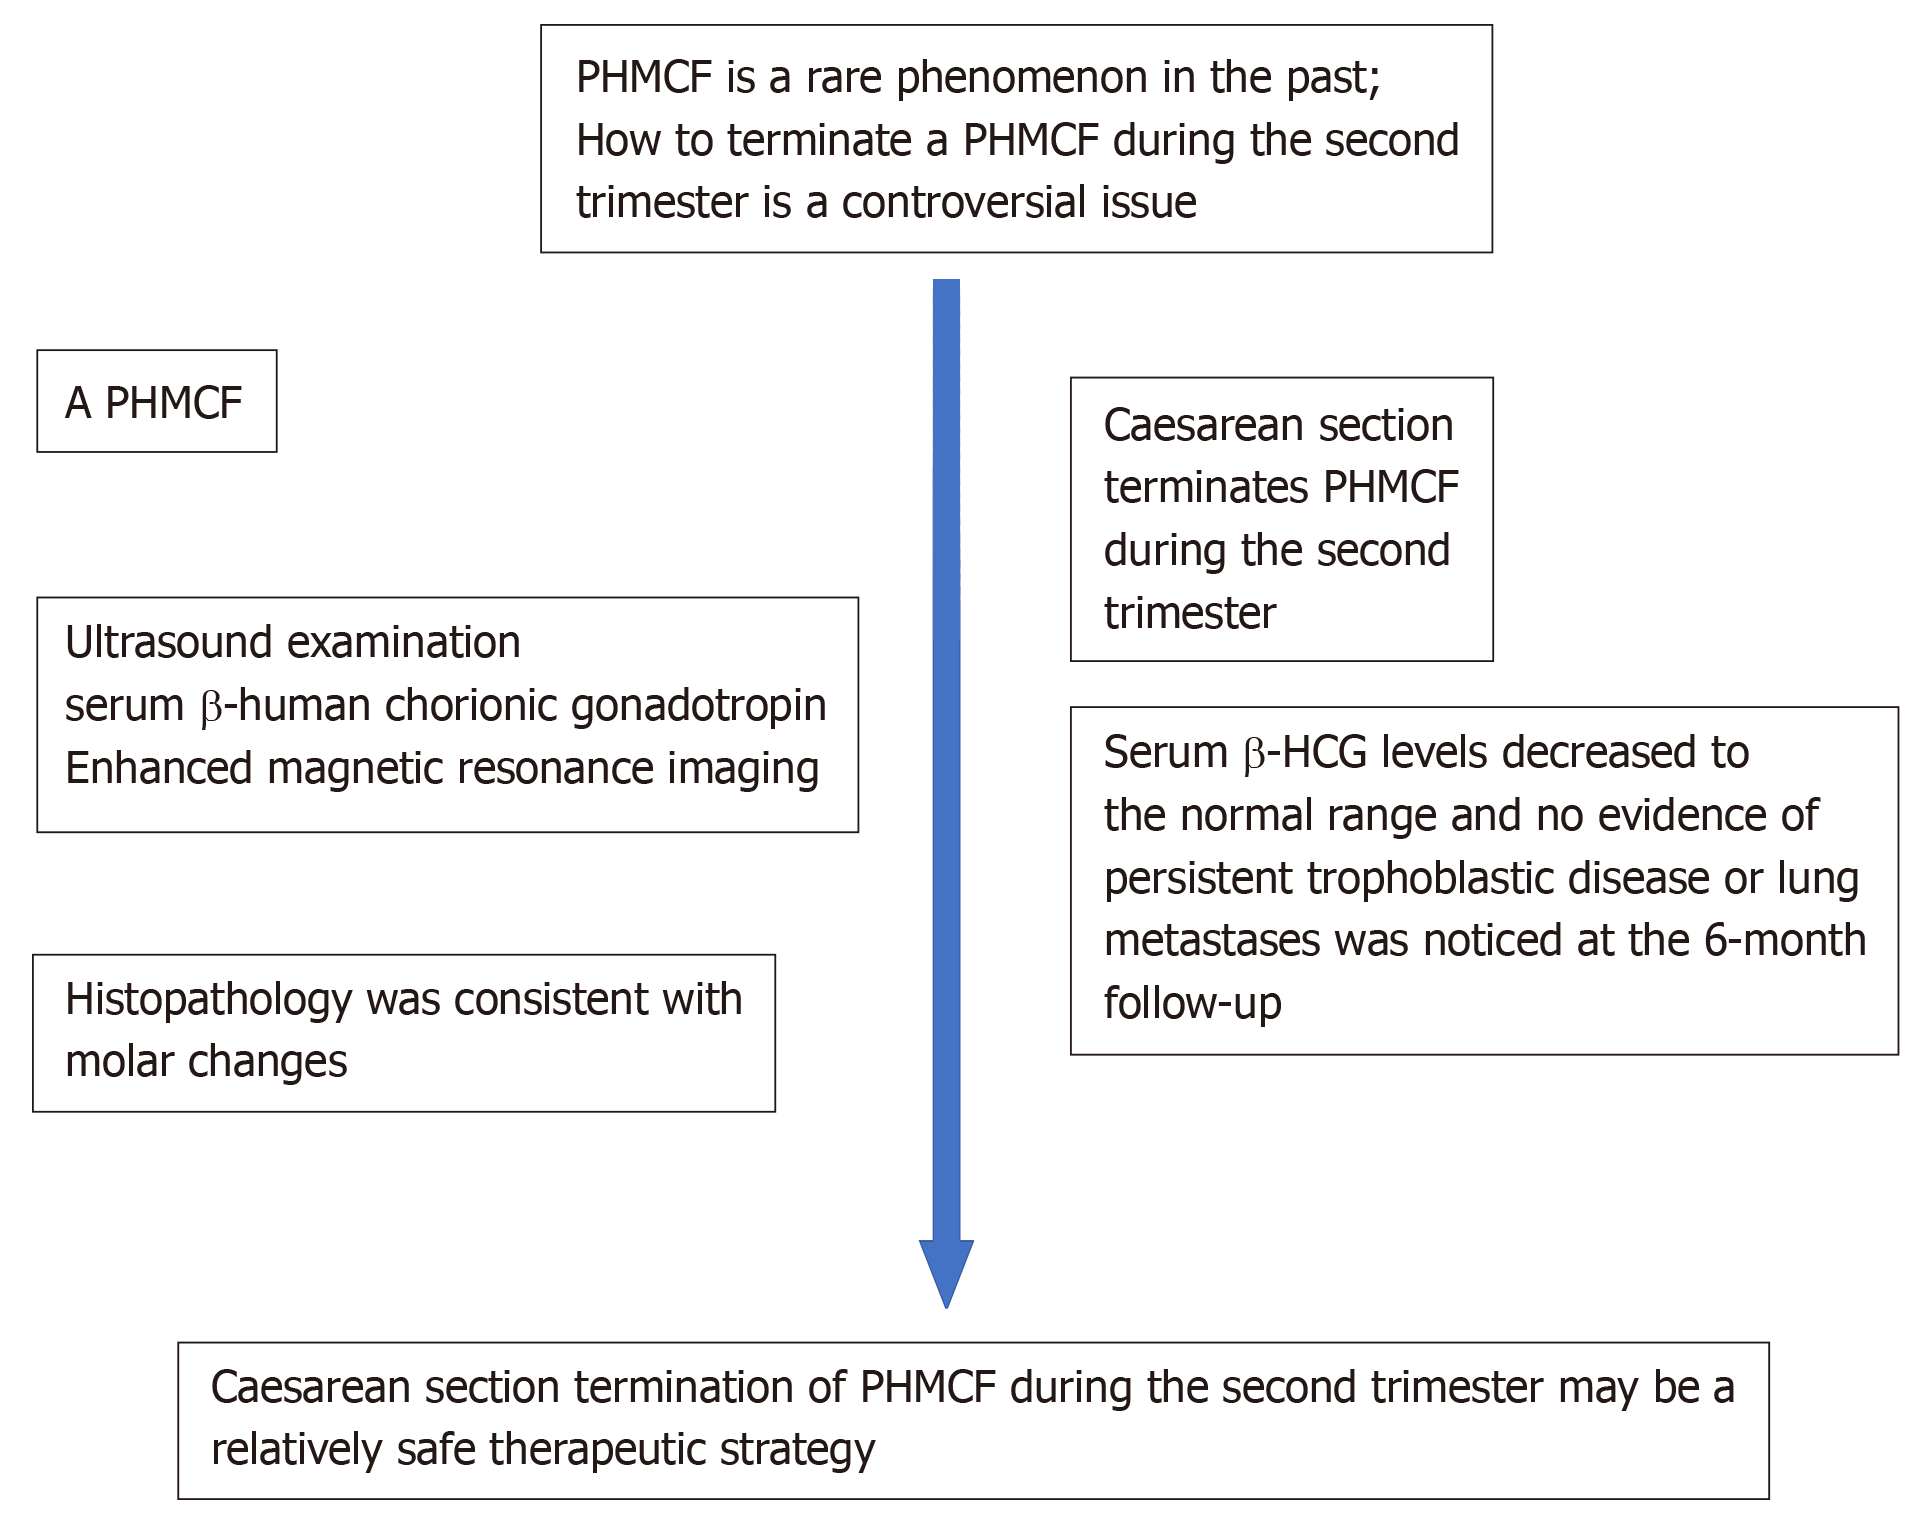
Figure 1 Timeline.
PHMCF: Partial hydatidiform mole and coexisting fetus.
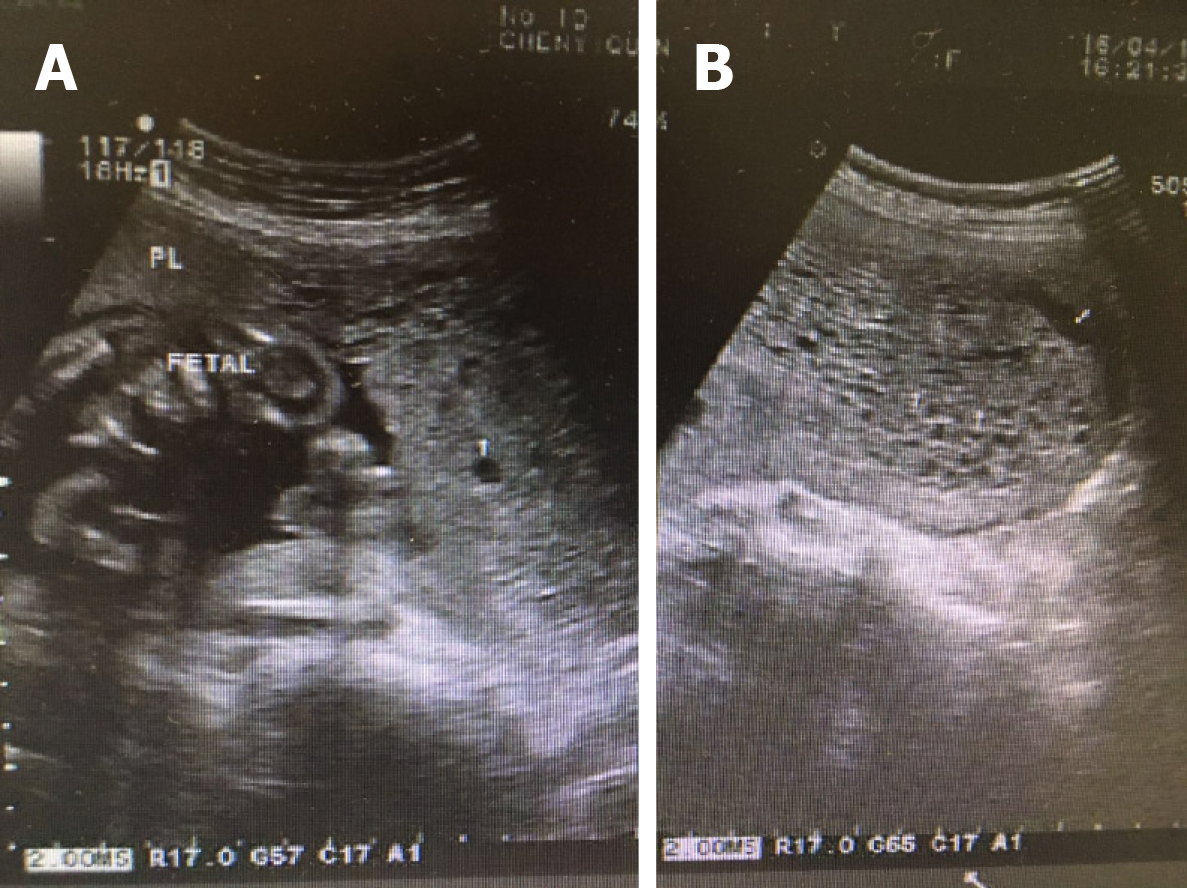
Figure 2 Transvaginal ultrasonographic images.
A: Transvaginal ultrasonographic image showing a normal fetus (white arrow); B: Transvaginal ultrasonographic image showing multiple echogenic areas (black arrow) that are suggestive of molar degeneration.
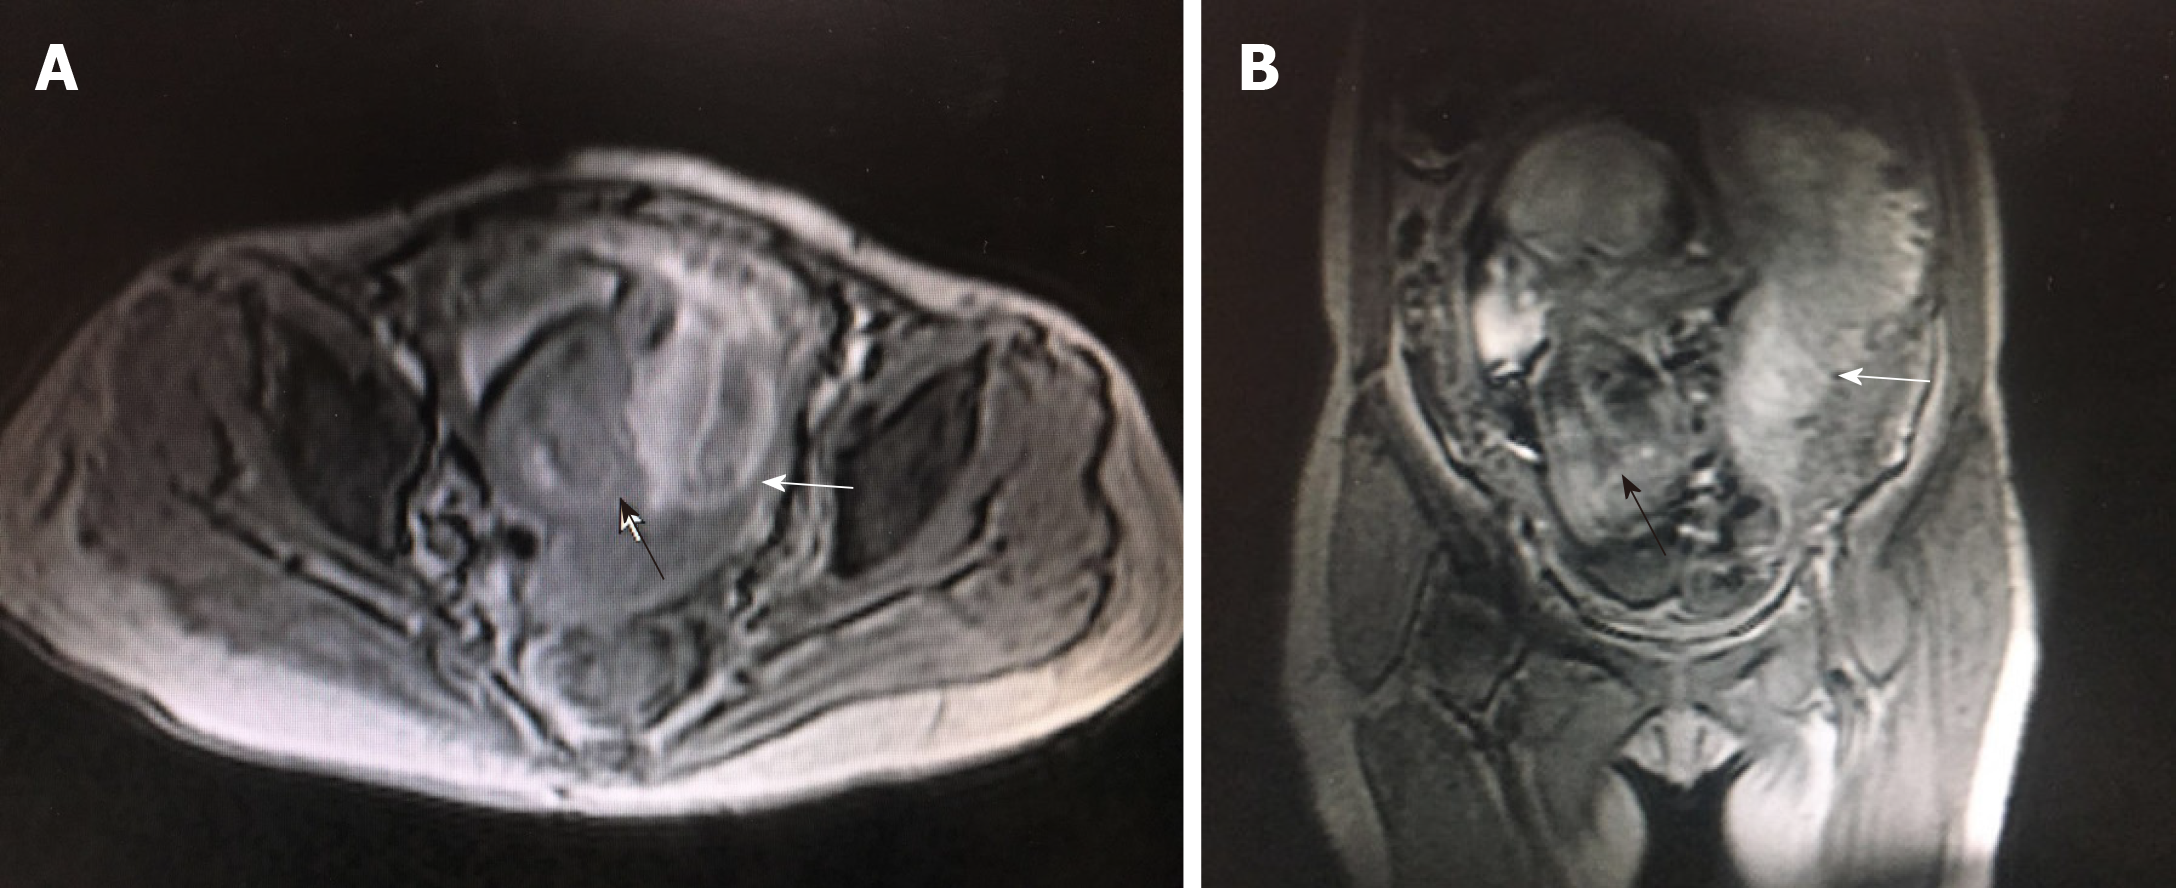
Figure 3 Magnetic resonance imaging scans.
The placental tissue with abnormal signal intensity in the left portion of the uterus (white arrow), the unclear relationship between the myometrium and placental tissue, and a normal fetus (black arrow) are shown. A: Transverse view; B: Coronal view.
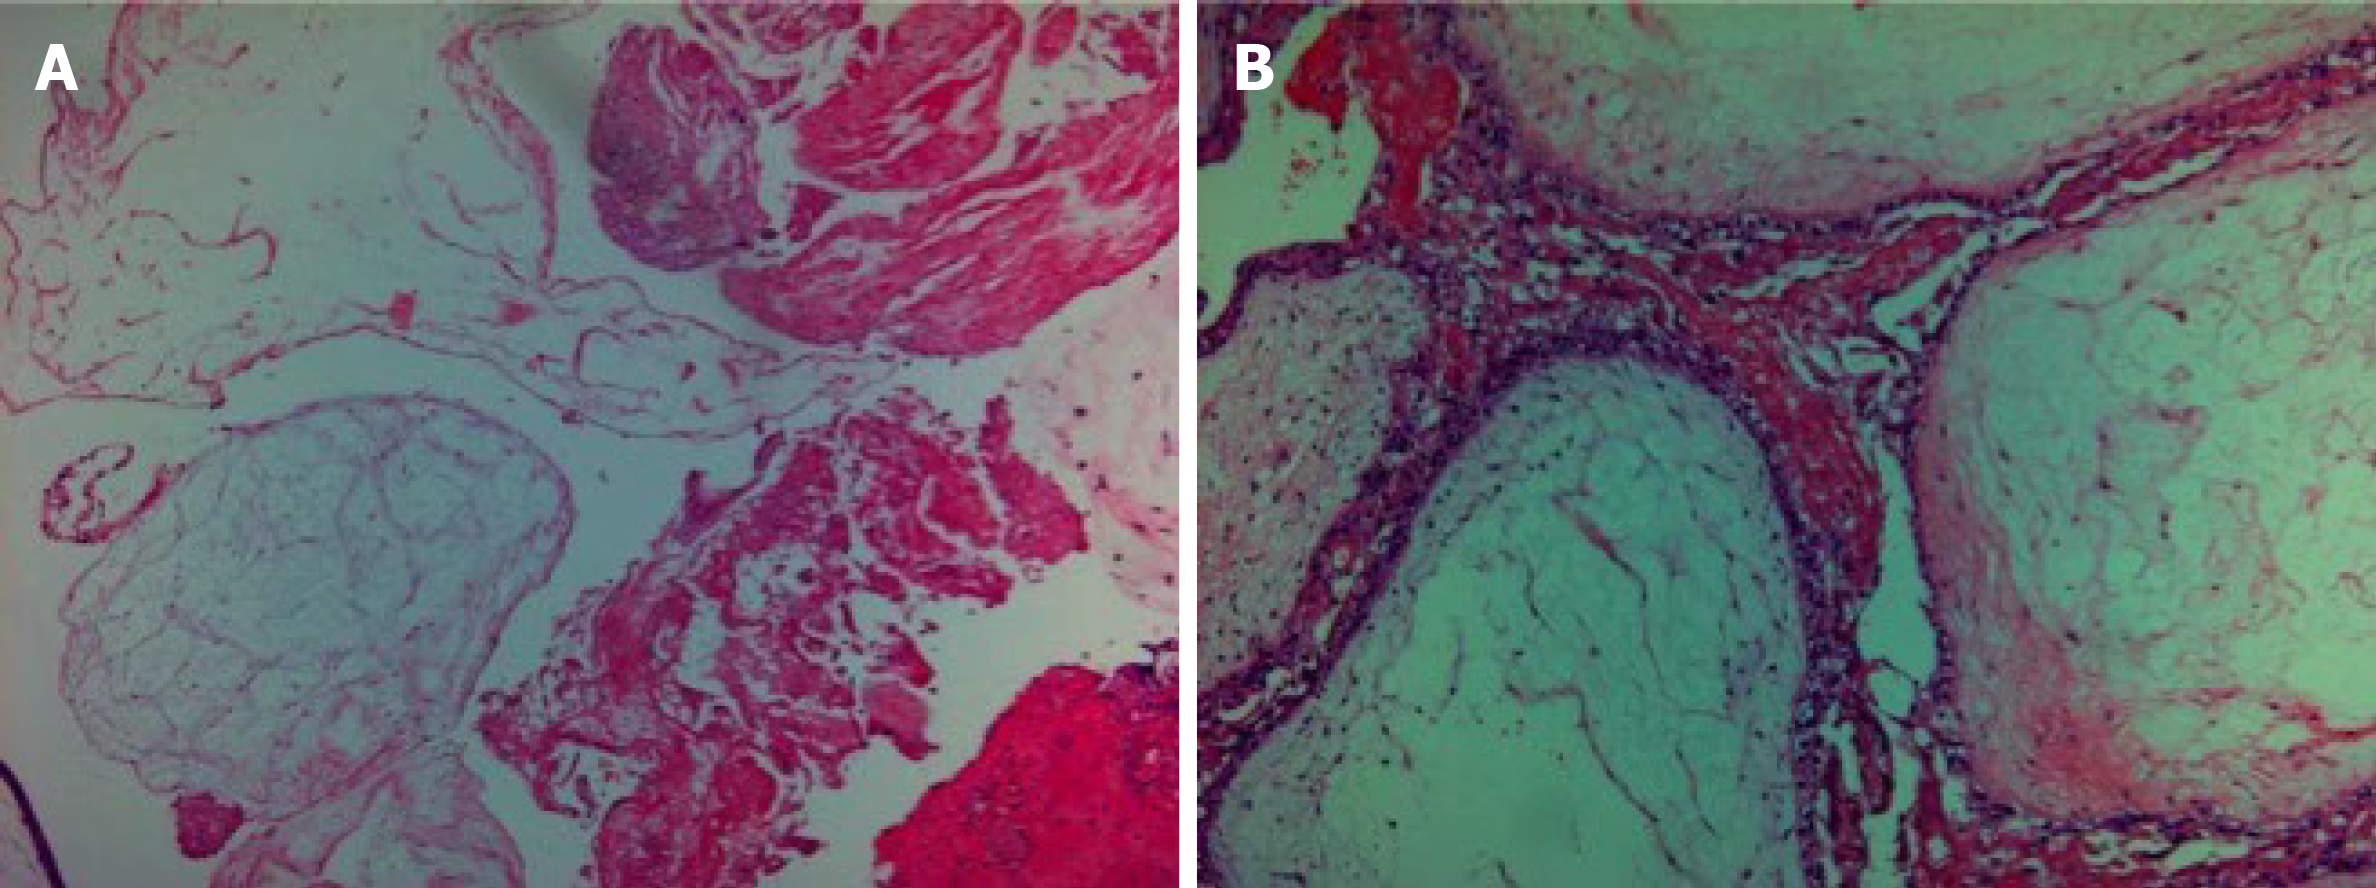
Figure 4 Histopathology of the hydatidiform mole.
Chorionic villi of varying sizes and shapes and focal trophoblastic hyperplasia (hematoxylin and eosin staining; magnification, ×40). A and B: Focal hydropic villi with an irregular scalloped outline and focal trophoblastic hyperplasia between hydrops.
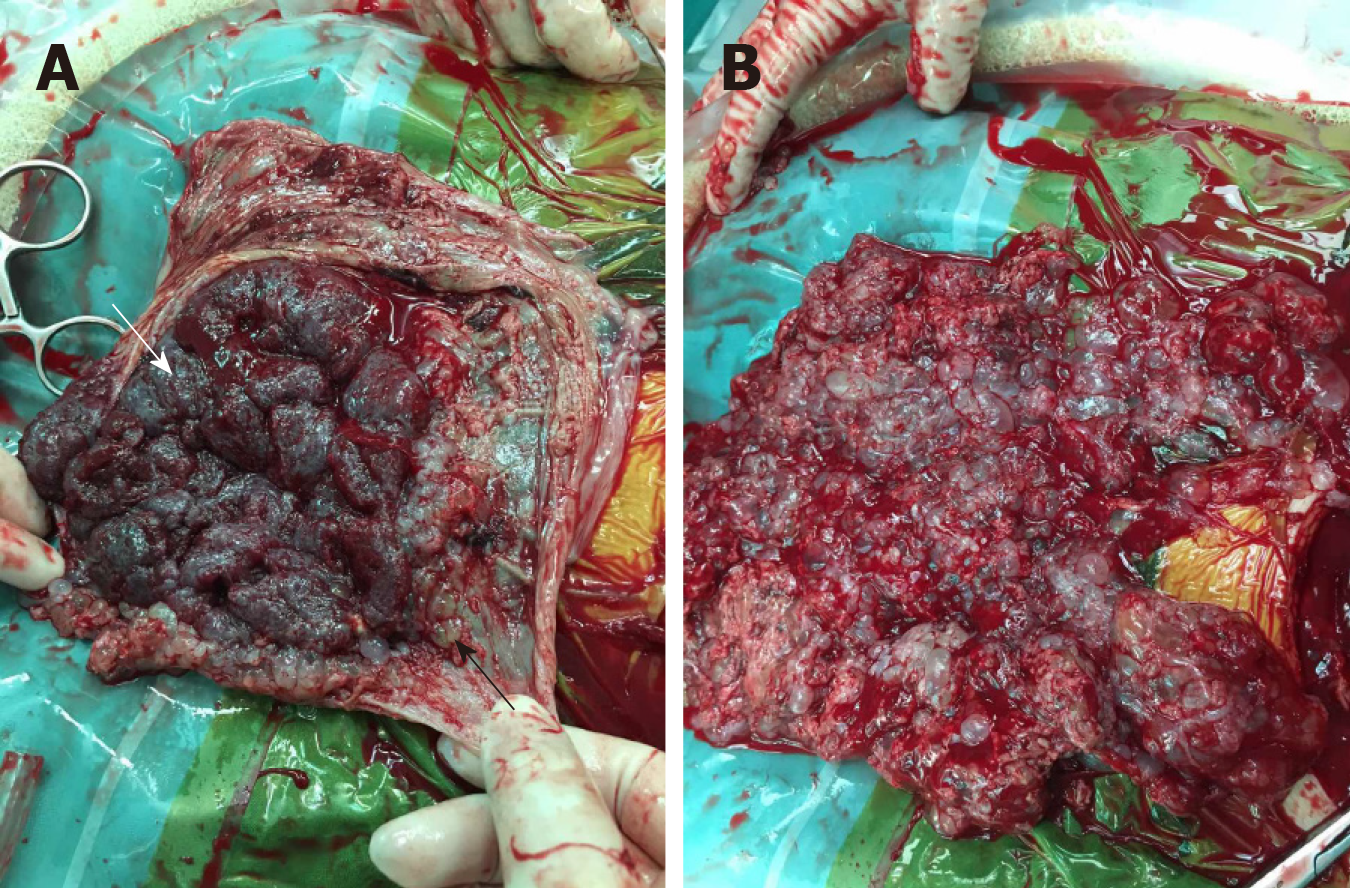
Figure 5 Images of the gross specimen.
A: The partially cystic placenta (specimen size: 110 mm × 95 mm × 35 mm) containing vesicular tissue (black arrow) and normal (white arrow) sections; B: The vesicular tissue (specimen size: 180 mm × 160 mm × 45 mm).
- Citation: Zhang RQ, Zhang JR, Li SD. Termination of a partial hydatidiform mole and coexisting fetus: A case report. World J Clin Cases 2019; 7(20): 3289-3295
- URL: https://www.wjgnet.com/2307-8960/full/v7/i20/3289.htm
- DOI: https://dx.doi.org/10.12998/wjcc.v7.i20.3289


