Copyright
©The Author(s) 2019.
World J Clin Cases. Oct 26, 2019; 7(20): 3237-3246
Published online Oct 26, 2019. doi: 10.12998/wjcc.v7.i20.3237
Published online Oct 26, 2019. doi: 10.12998/wjcc.v7.i20.3237
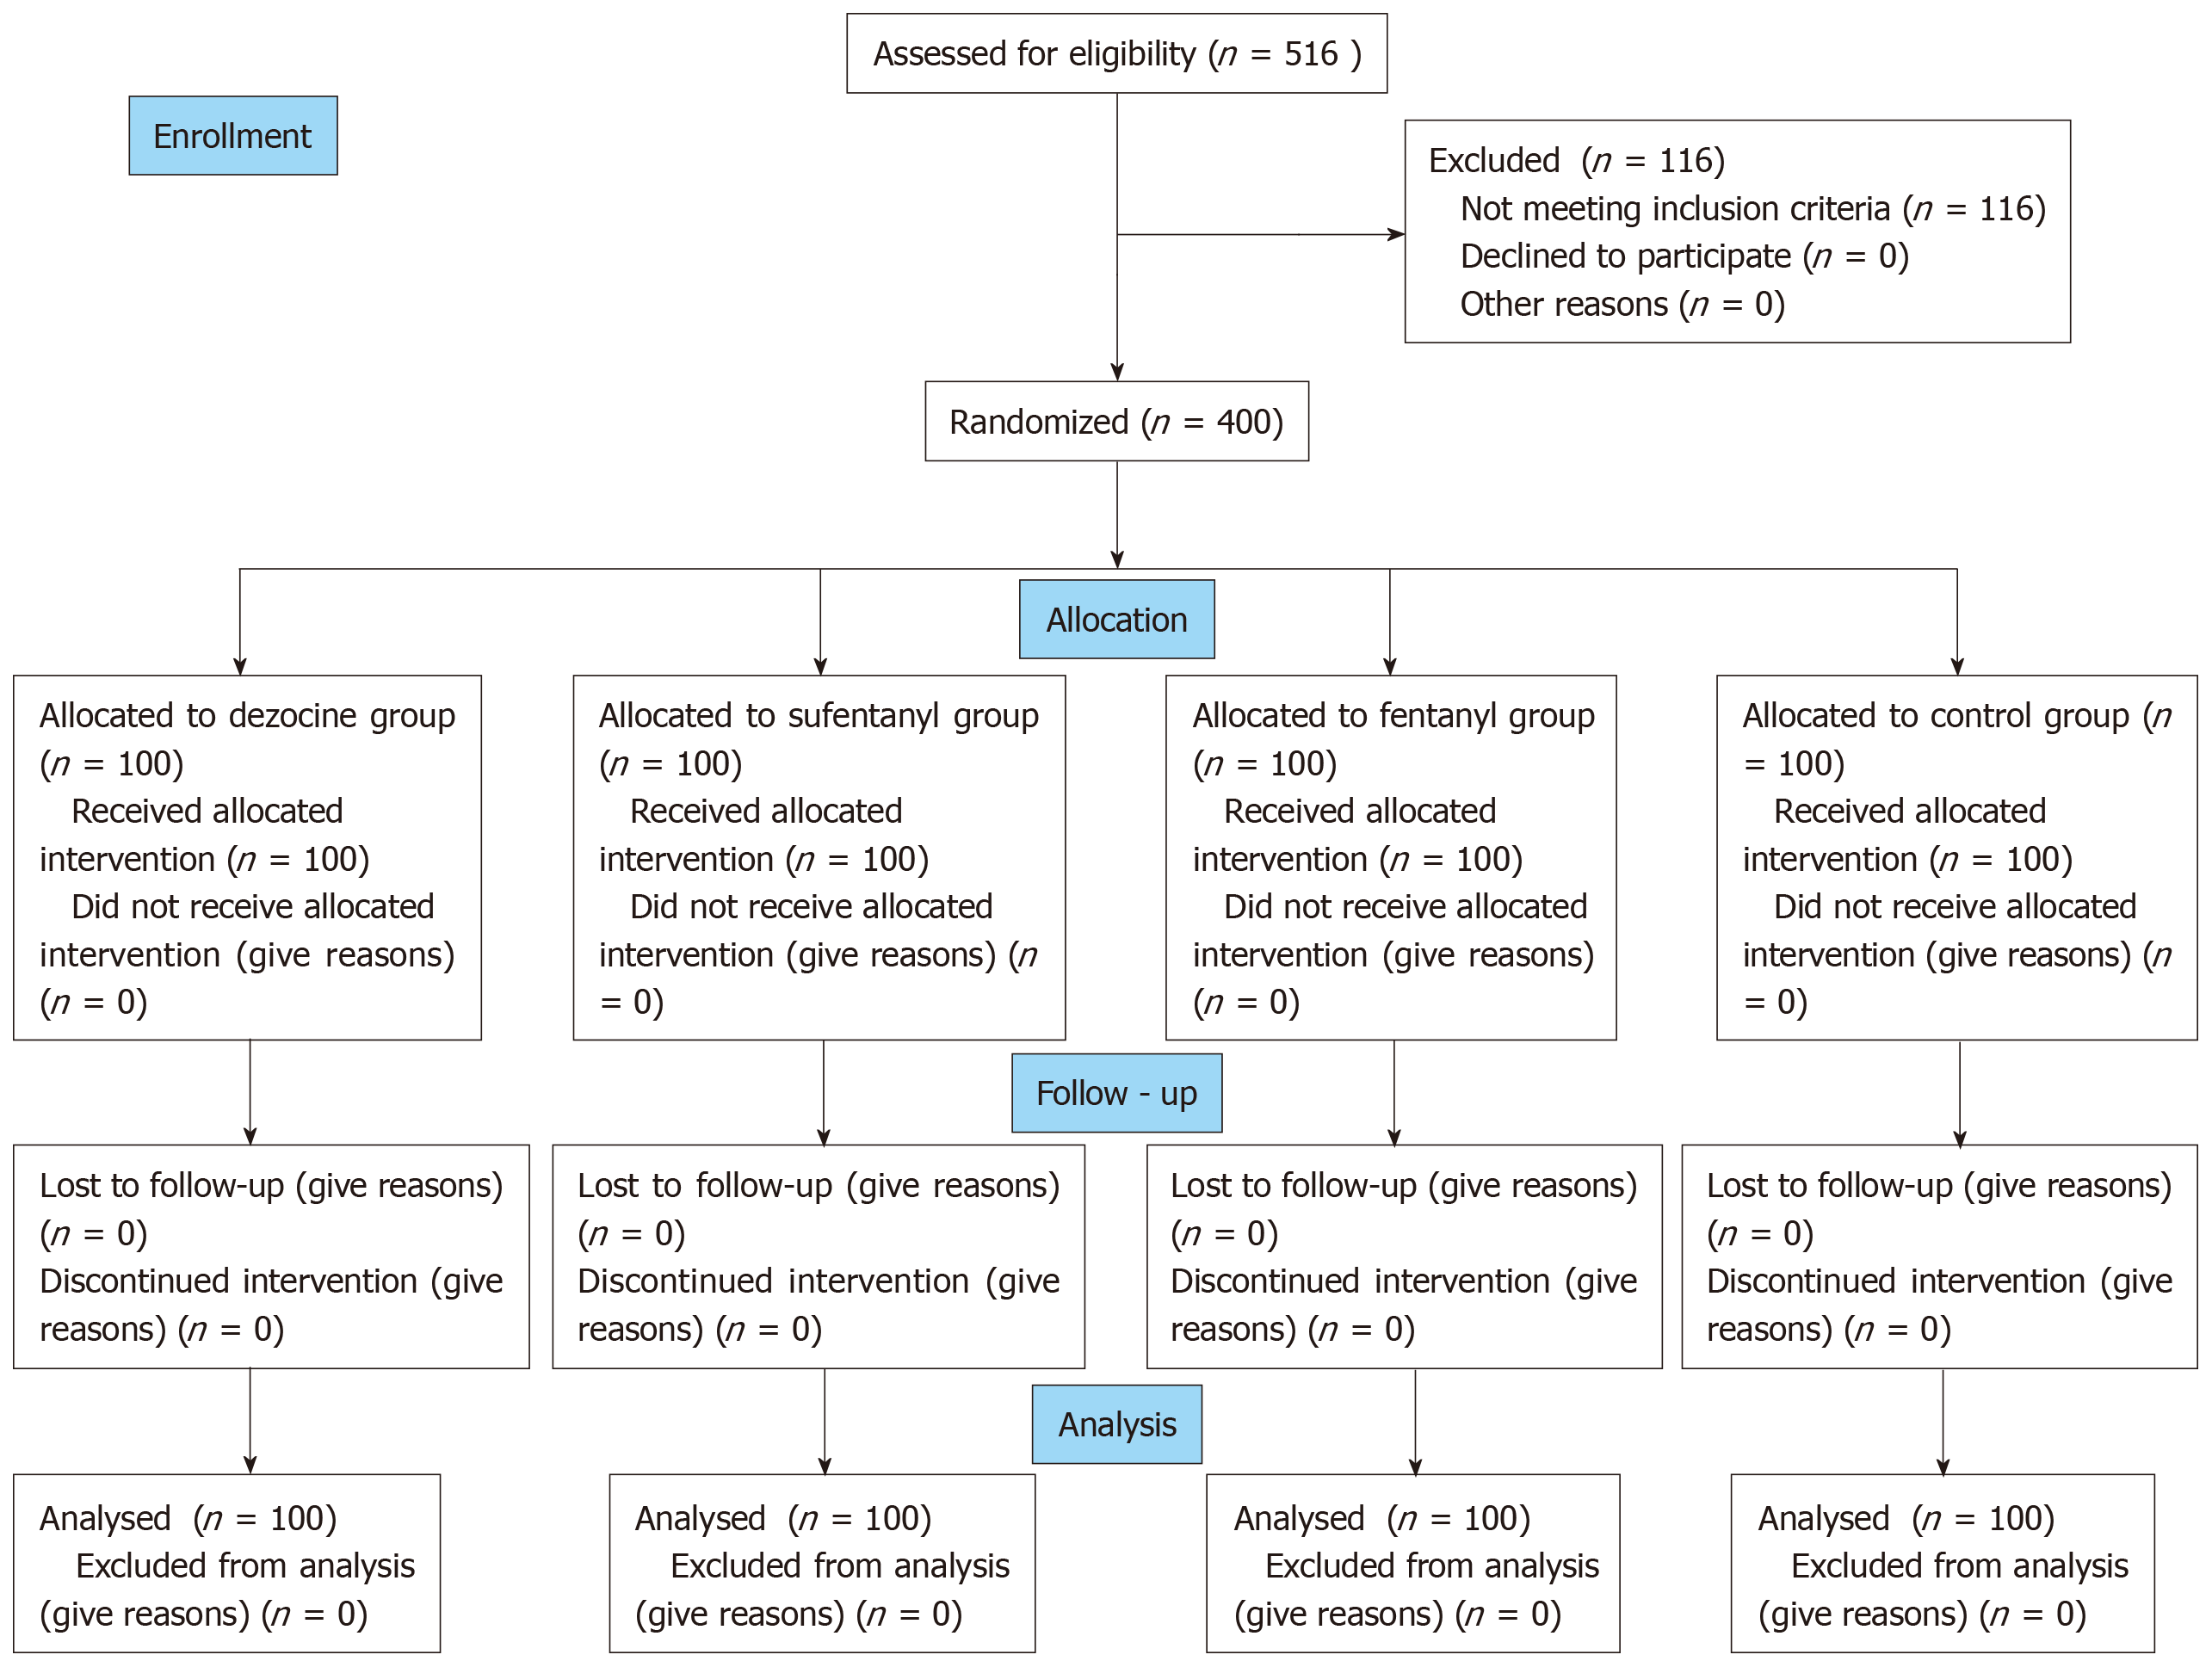
Figure 1 CONSORT 2010 flow diagram.
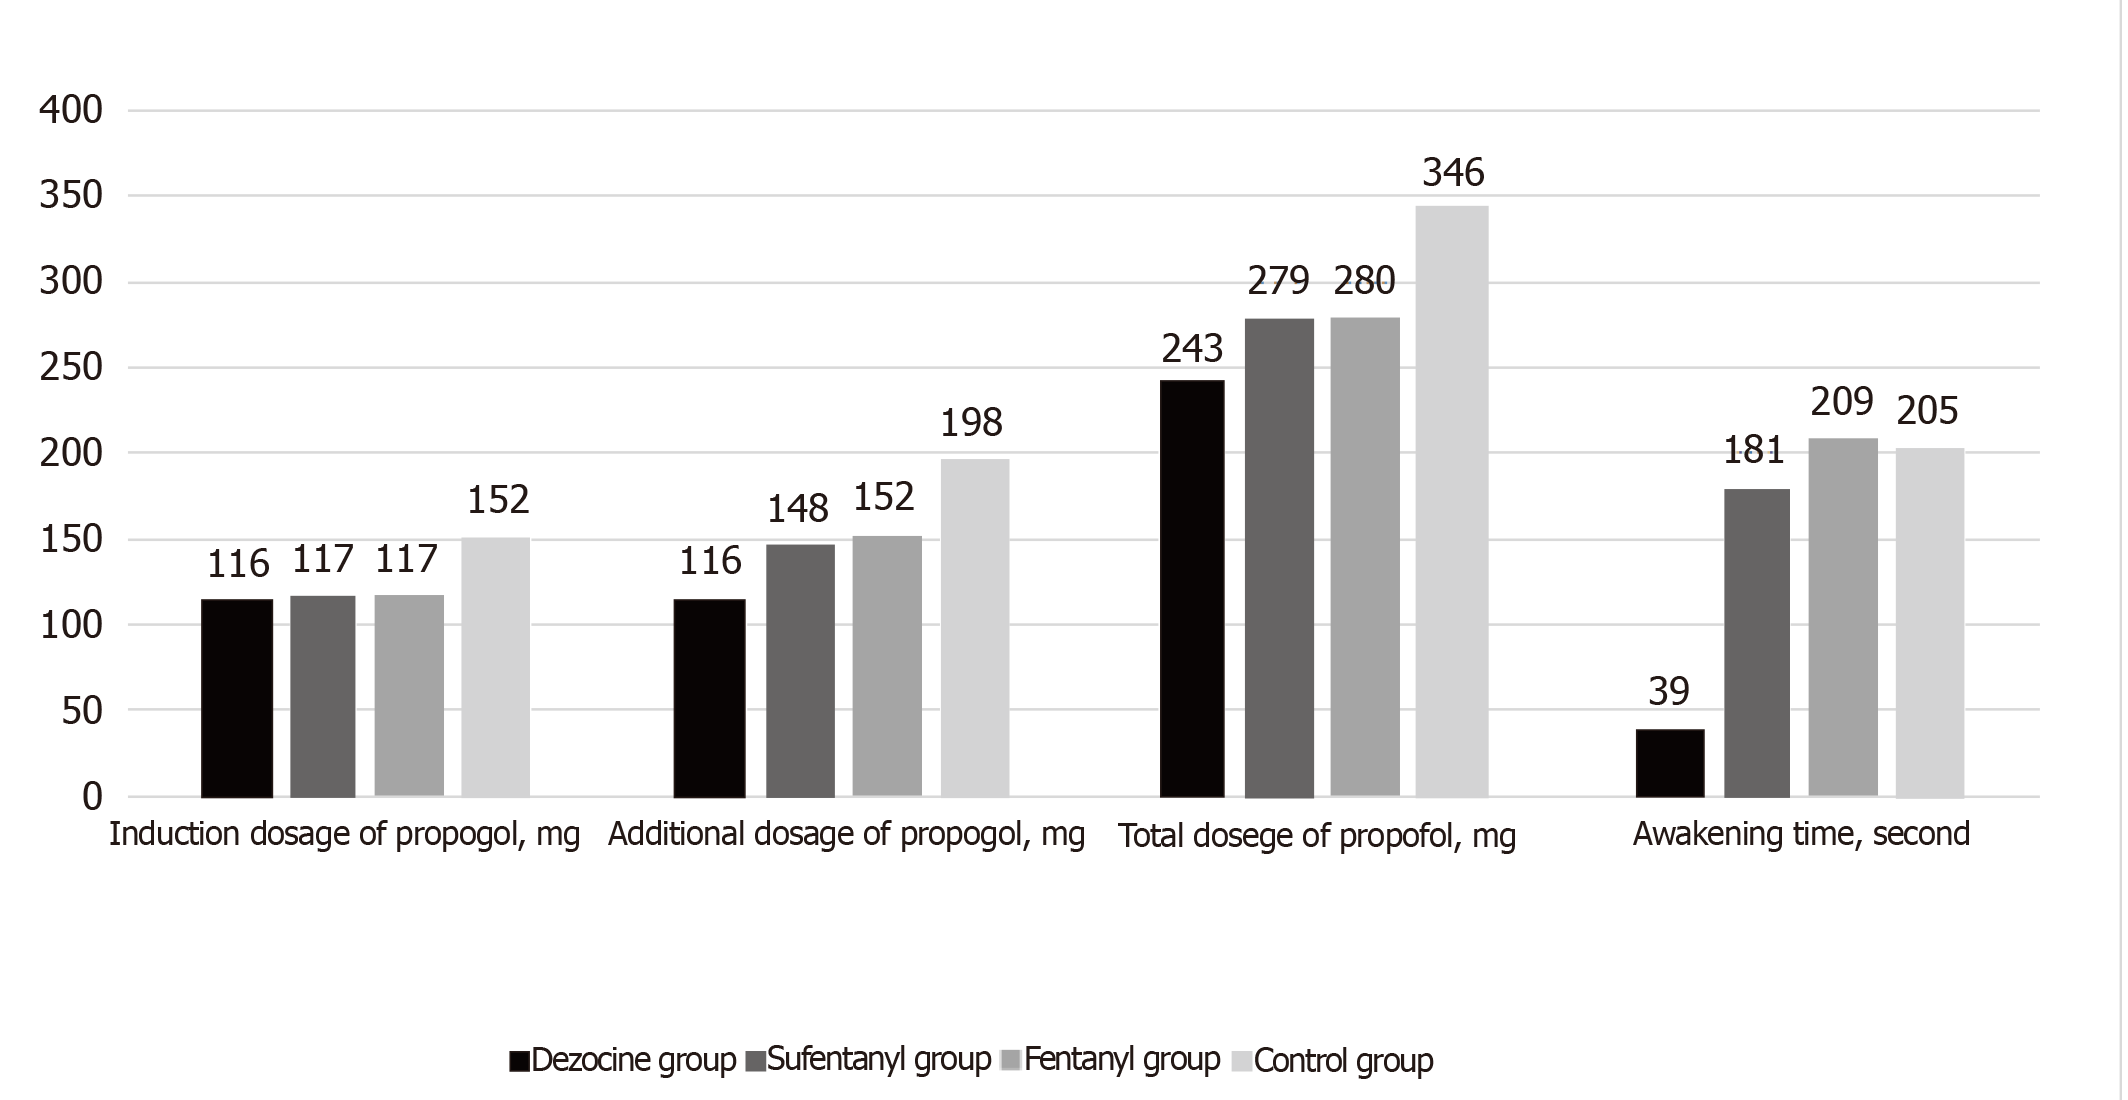
Figure 2 Dosage of propofol and awakening time among groups.
Figure 3 Steward score and postoperative pain score among groups.
Figure 4 Variety of indexes at different time points in the four groups.
A: Bispectral index; B: Mean arterial pressure; C:Pulse oxygen saturation; D: Respiratory rate. BIS: Bispectral index; MAP: Mean arterial pressure; SpO2: Pulse oxygen saturation; RR: Respiratory rate.
- Citation: Li XT, Ma CQ, Qi SH, Zhang LM. Combination of propofol and dezocine to improve safety and efficacy of anesthesia for gastroscopy and colonoscopy in adults: A randomized, double-blind, controlled trial. World J Clin Cases 2019; 7(20): 3237-3246
- URL: https://www.wjgnet.com/2307-8960/full/v7/i20/3237.htm
- DOI: https://dx.doi.org/10.12998/wjcc.v7.i20.3237


