Copyright
©The Author(s) 2019.
World J Clin Cases. Oct 6, 2019; 7(19): 2930-2941
Published online Oct 6, 2019. doi: 10.12998/wjcc.v7.i19.2930
Published online Oct 6, 2019. doi: 10.12998/wjcc.v7.i19.2930
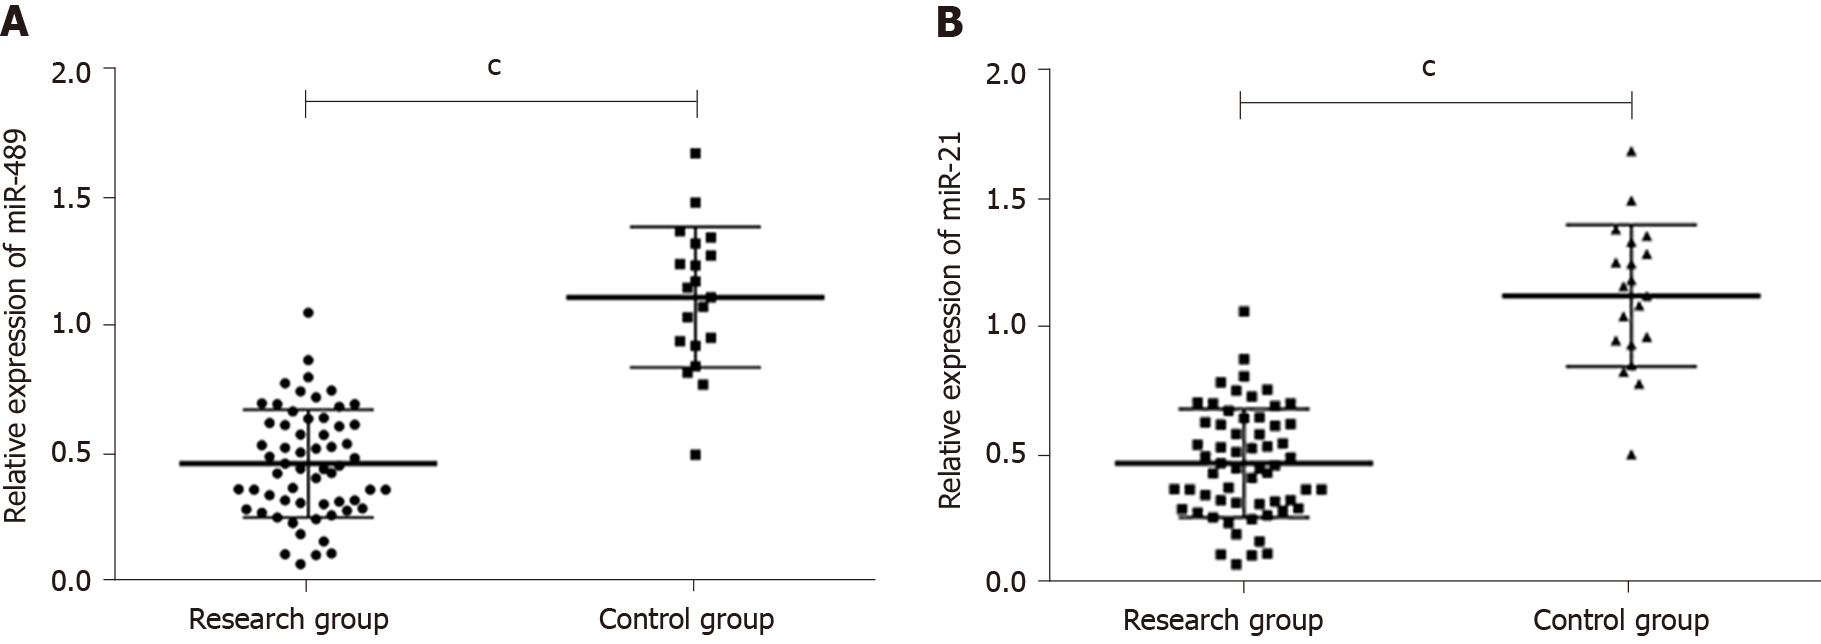
Figure 1 Comparison of relative expression of serum miR-489 and miR-21 between the research group and control group.
A: The expression of miR-489 in the research group was significantly lower than that in the control group (P < 0.001). B: The expression of mir-21 in the research group was significantly higher than that in the control group (P < 0.001). cP < 0.001.
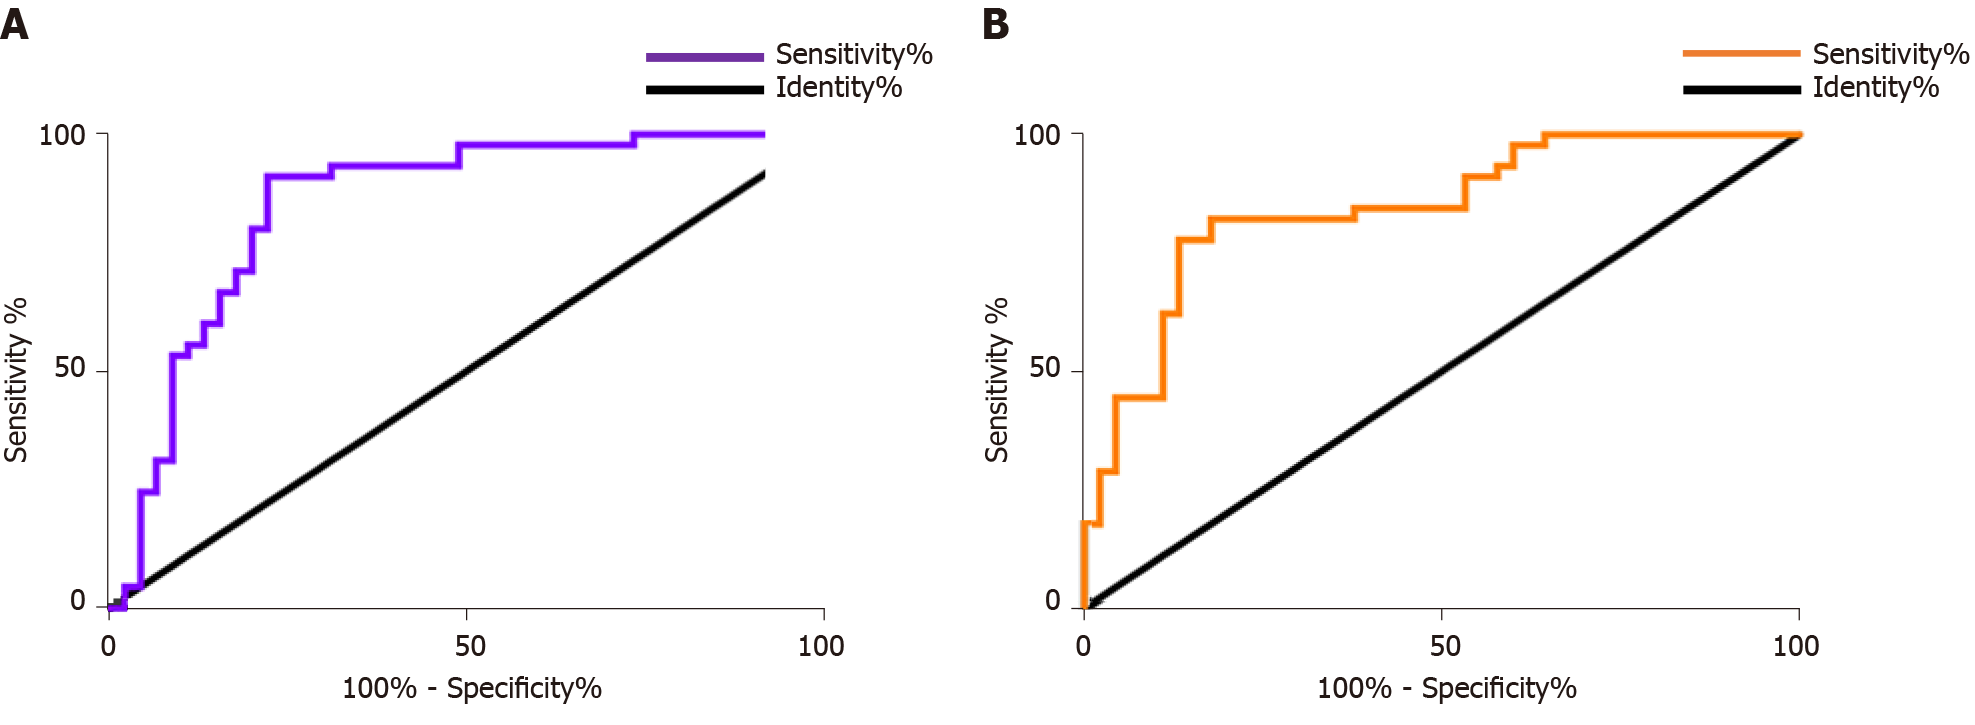
Figure 2 ROC curves of serum miR-489 and miR-21 for diagnosis of melanoma metastasis.
A: The sensitivity and specificity of serum miR-9a were, respectively, 75.56% and 80.00%. B: The sensitivity and specificity of serum miR-133b were, respectively, 77.78 and 82.22%.
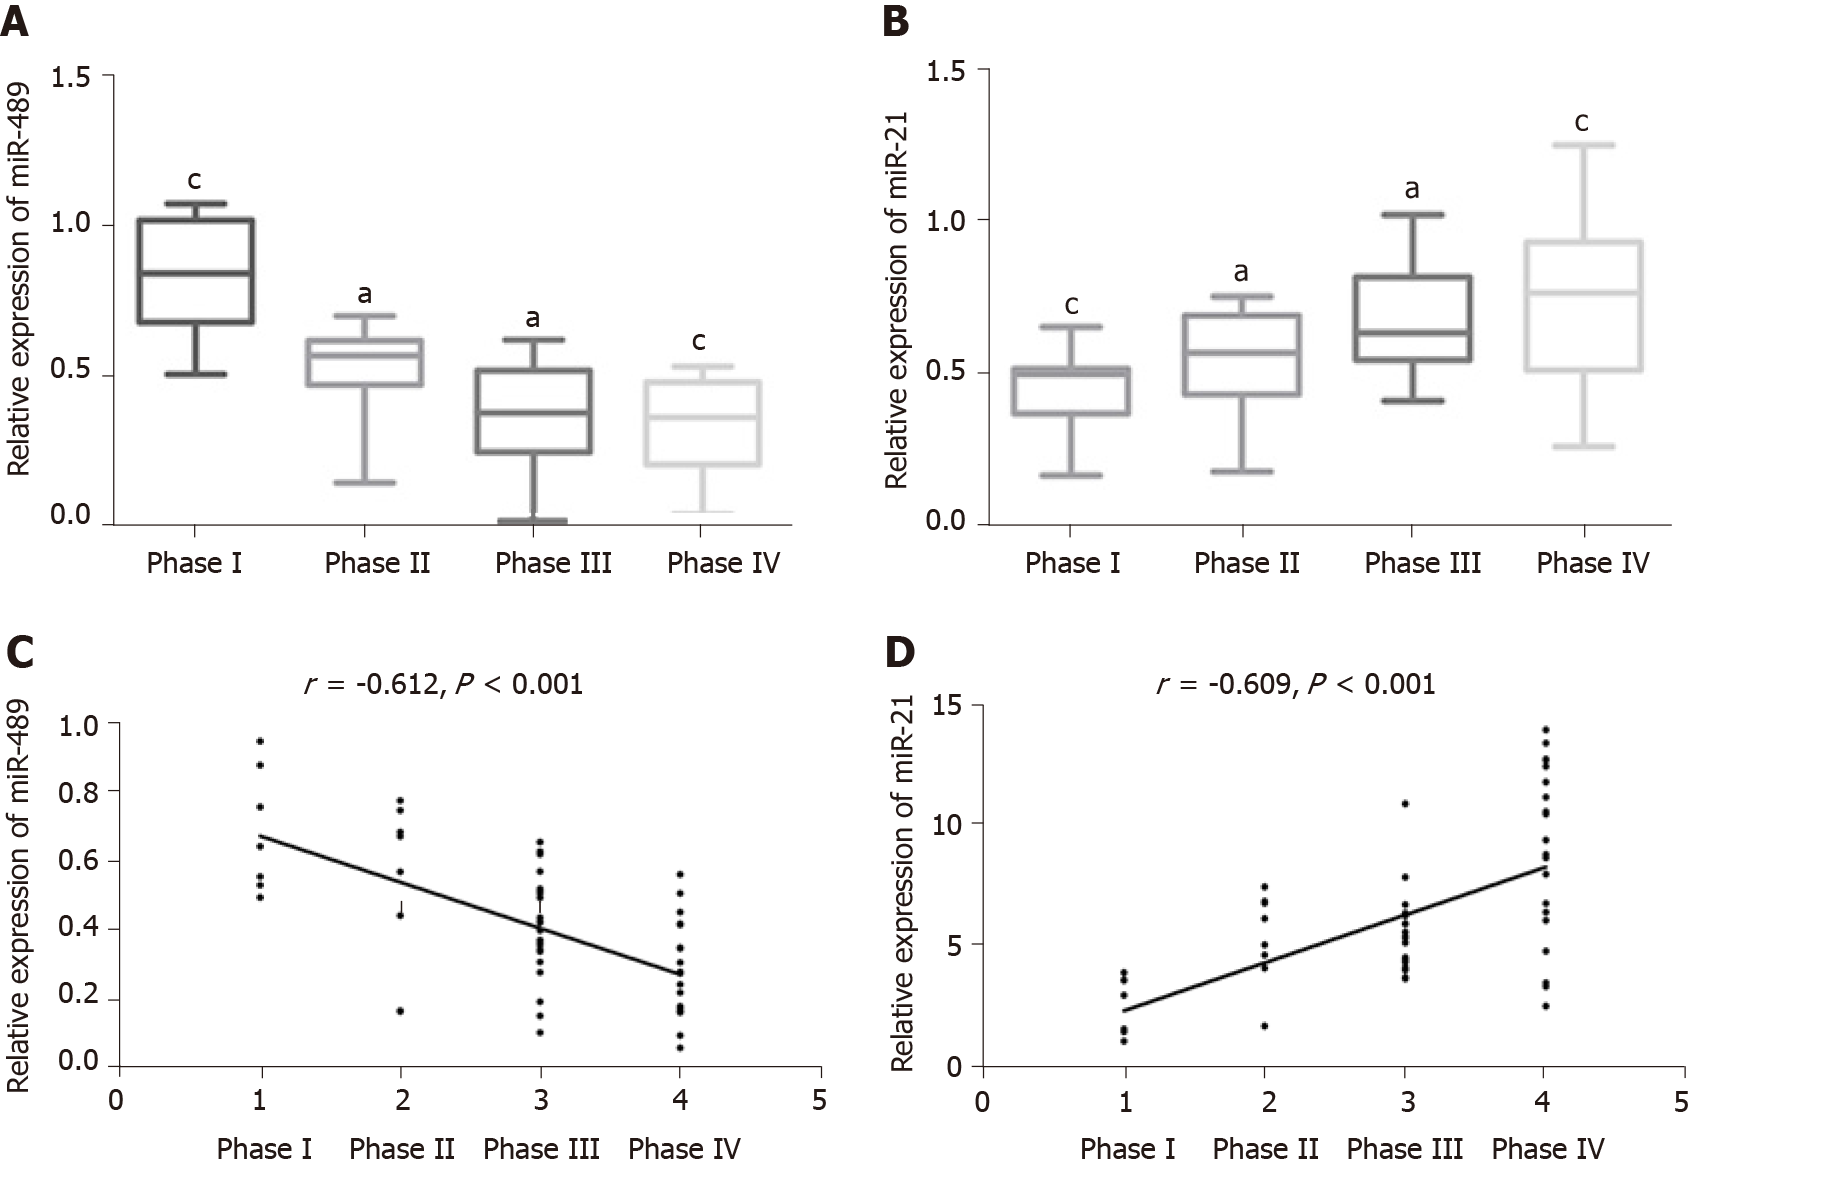
Figure 3 Correlation between relative expression of miR-489 and miR-21 in serum and TNM stage of melanoma in the research group.
A: The relative expression of serum miR-489 decreased with the increase of TNM stage (P < 0.05). aP < 0.05; cP < 0.001. B: The relative expression of serum miR-21 increased with the increase of TNM stage (P < 0.05). aP < 0.05; cP < 0.001. C: The relative expression of serum miR-489 was negatively correlated with TNM stage (r = -0.612, P < 0.001). D: The relative expression of serum miR-21 was positively correlated with TNM stage (r = 0.609, P < 0.001).
- Citation: Mo H, Guan J, Yuan ZC, Lin X, Wu ZJ, Liu B, He JL. Expression and predictive value of miR-489 and miR-21 in melanoma metastasis. World J Clin Cases 2019; 7(19): 2930-2941
- URL: https://www.wjgnet.com/2307-8960/full/v7/i19/2930.htm
- DOI: https://dx.doi.org/10.12998/wjcc.v7.i19.2930


