Copyright
©The Author(s) 2019.
World J Clin Cases. Sep 26, 2019; 7(18): 2851-2856
Published online Sep 26, 2019. doi: 10.12998/wjcc.v7.i18.2851
Published online Sep 26, 2019. doi: 10.12998/wjcc.v7.i18.2851
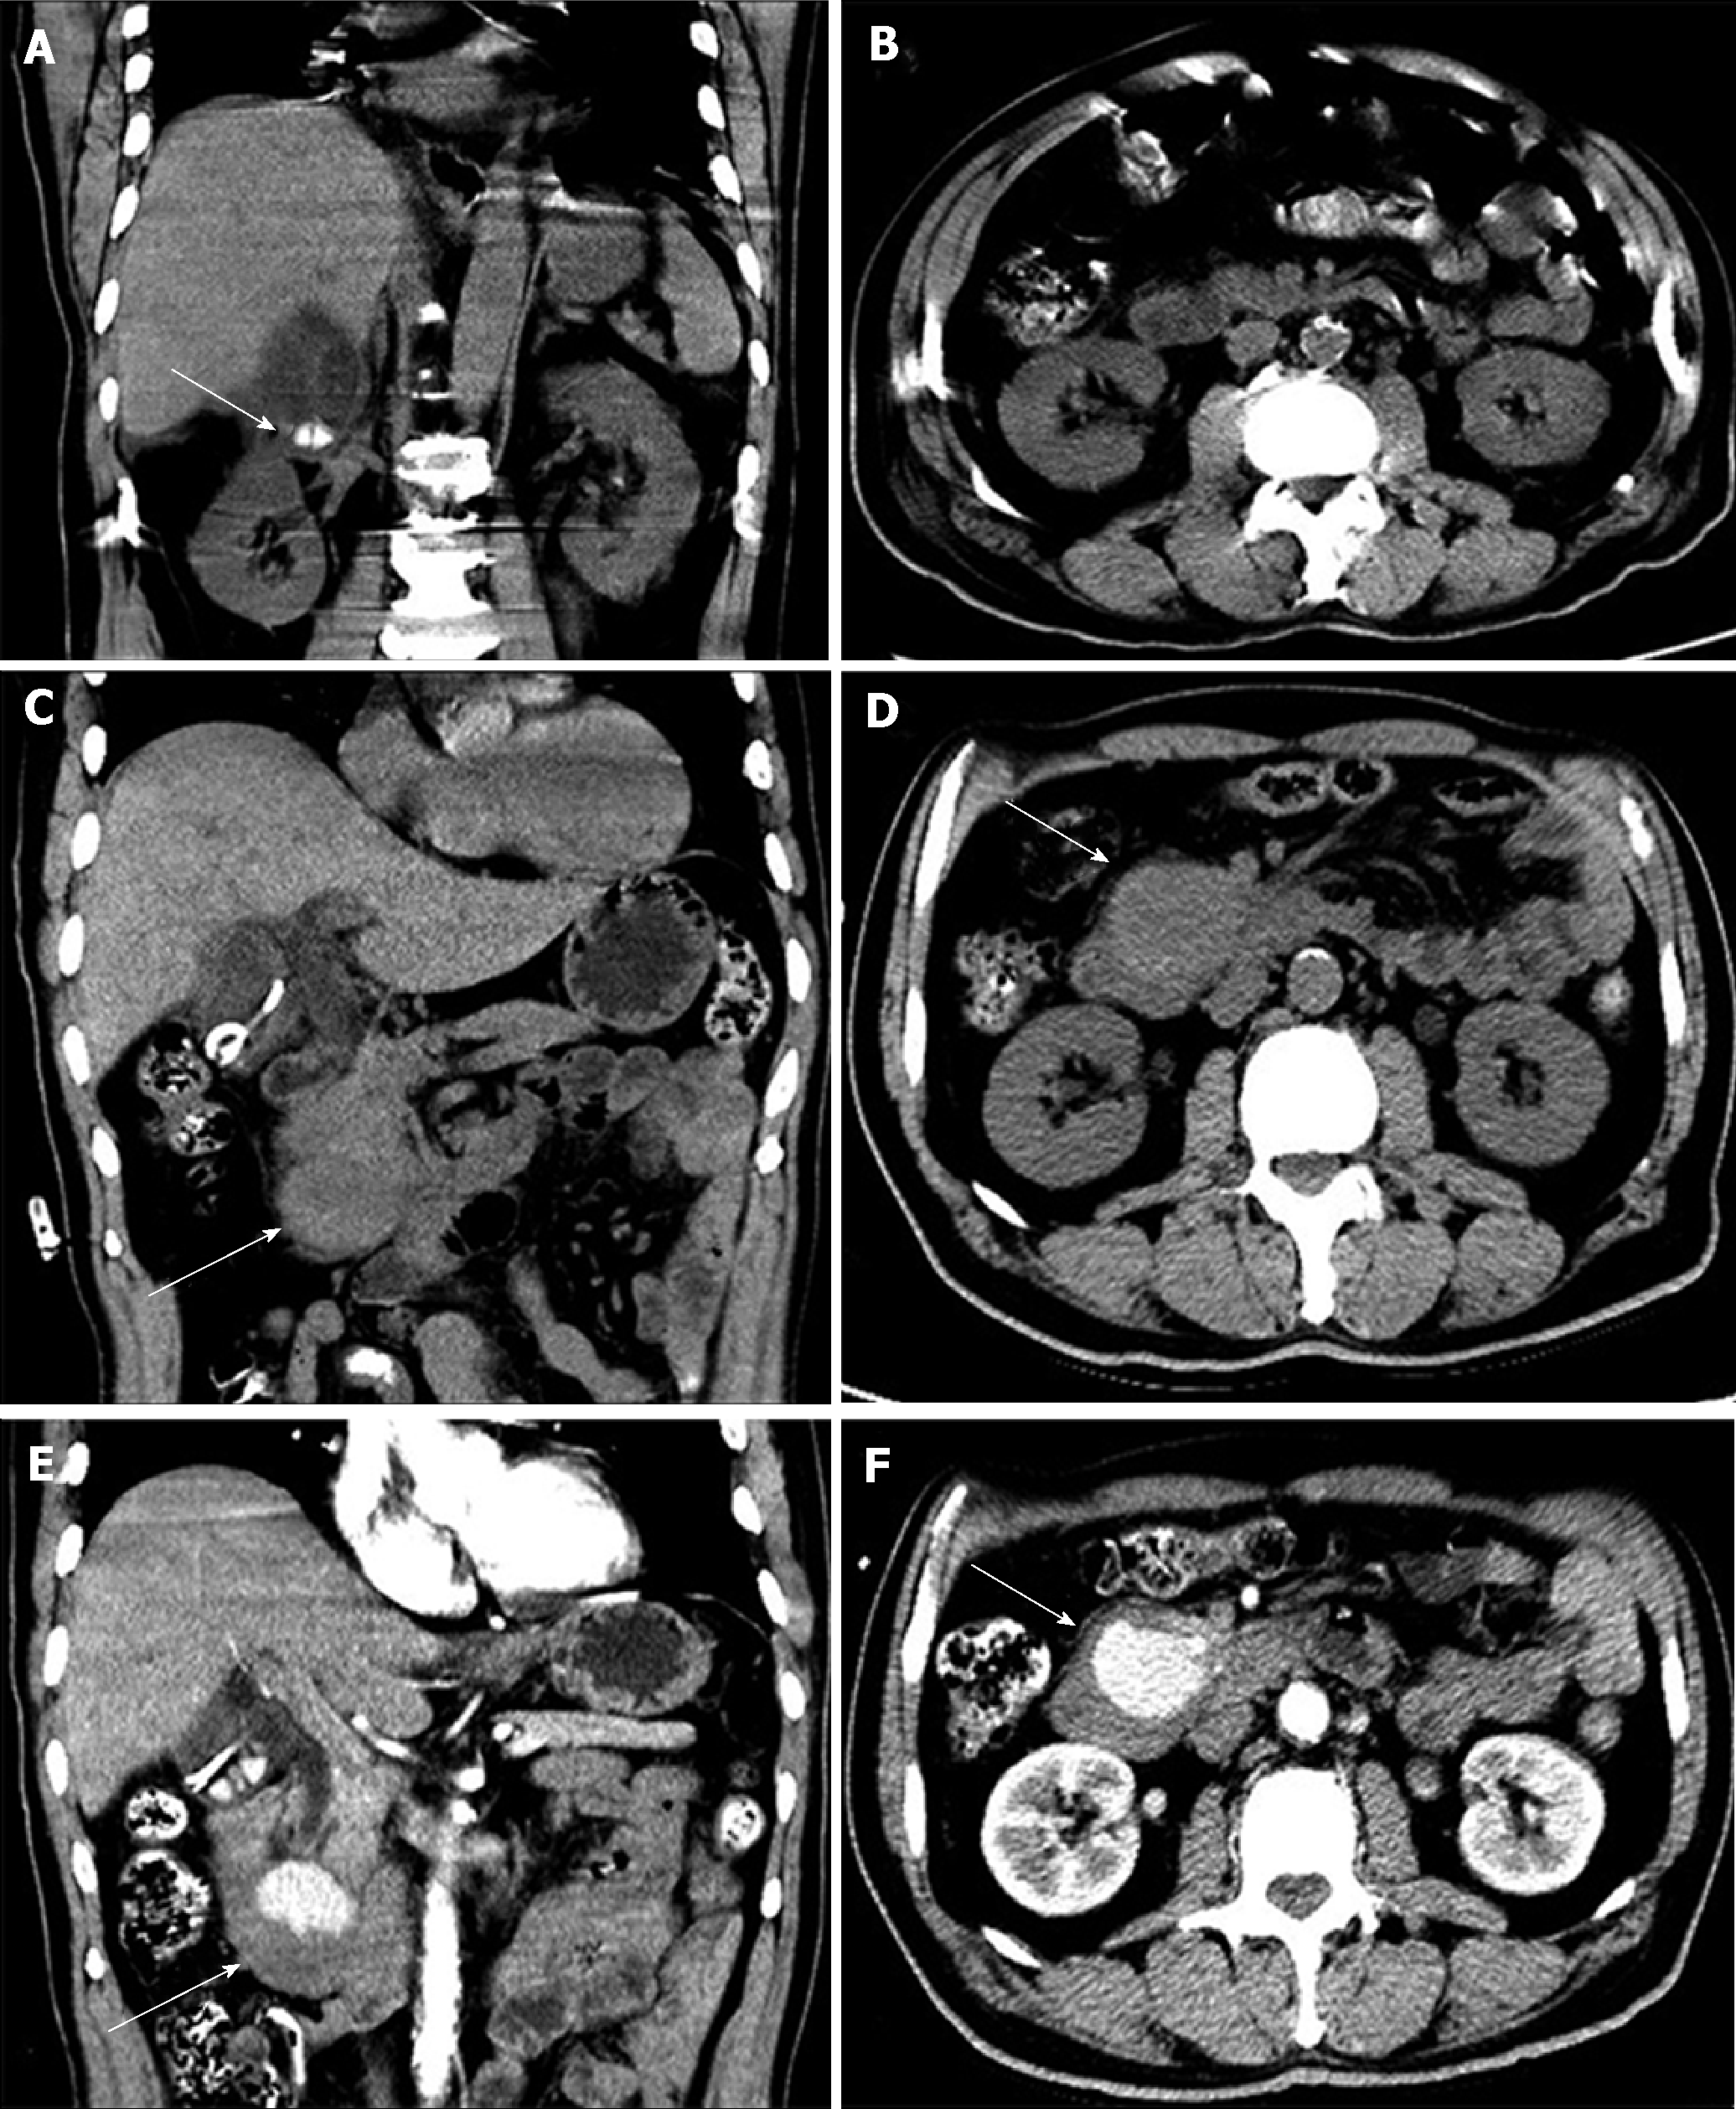
Figure 1 Computed tomography images.
A: Coronal computed tomography (CT) image showing the gallstones (white arrow) and acute cholecystitis; B: Axial CT image showing the normal morphology of the pancreas and that there was no mass between the pancreatic head and the duodenum; C and D: Coronal (C) and axial (D) CT images revealing an emerging 3.8 cm × 3.9 cm × 3.0 cm mass (white arrow) between the pancreatic head and the third portion of the duodenum; E and F: Coronal (E) and axial (F) contrast-enhanced CT images showing a 4.4 cm × 3.2 cm × 3.0 cm, well defined, ovoid, enhancing mass (white arrow) between the pancreatic head and the duodenum.
Figure 2 Superior mesenteric artery angiography.
A: Selective superior mesenteric artery angiography demonstrated a pseudoaneurysm of the inferior pancreaticoduodenal artery; B and C: Angiography after embolization showed complete occlusion of the pseudoaneurysm. The presence of microcoils can be observed (black arrow).
Figure 3 Gastroduodenal endoscopy.
A: Gastroduodenal endoscopy revealed a 1.0 cm × 1.2 cm depressed lesion with blood clots (white arrow) in the third portion of the duodenum and the surrounding mucosa of the lesion swelled; B: Gastroduodenal endoscopy 5 d later showed that the lesion was reduced distinctly (white arrow) and the mucosa was congestive; C: Gastroduodenal endoscopy showed that the lesion disappeared (white arrow) and the mucosa recovered two months after discharge.
- Citation: Xu QD, Gu SG, Liang JH, Zheng SD, Lin ZH, Zhang PD, Yan J. Inferior pancreaticoduodenal artery pseudoaneurysm in a patient with calculous cholecystitis: A case report. World J Clin Cases 2019; 7(18): 2851-2856
- URL: https://www.wjgnet.com/2307-8960/full/v7/i18/2851.htm
- DOI: https://dx.doi.org/10.12998/wjcc.v7.i18.2851


