Copyright
©The Author(s) 2019.
World J Clin Cases. Aug 26, 2019; 7(16): 2384-2392
Published online Aug 26, 2019. doi: 10.12998/wjcc.v7.i16.2384
Published online Aug 26, 2019. doi: 10.12998/wjcc.v7.i16.2384
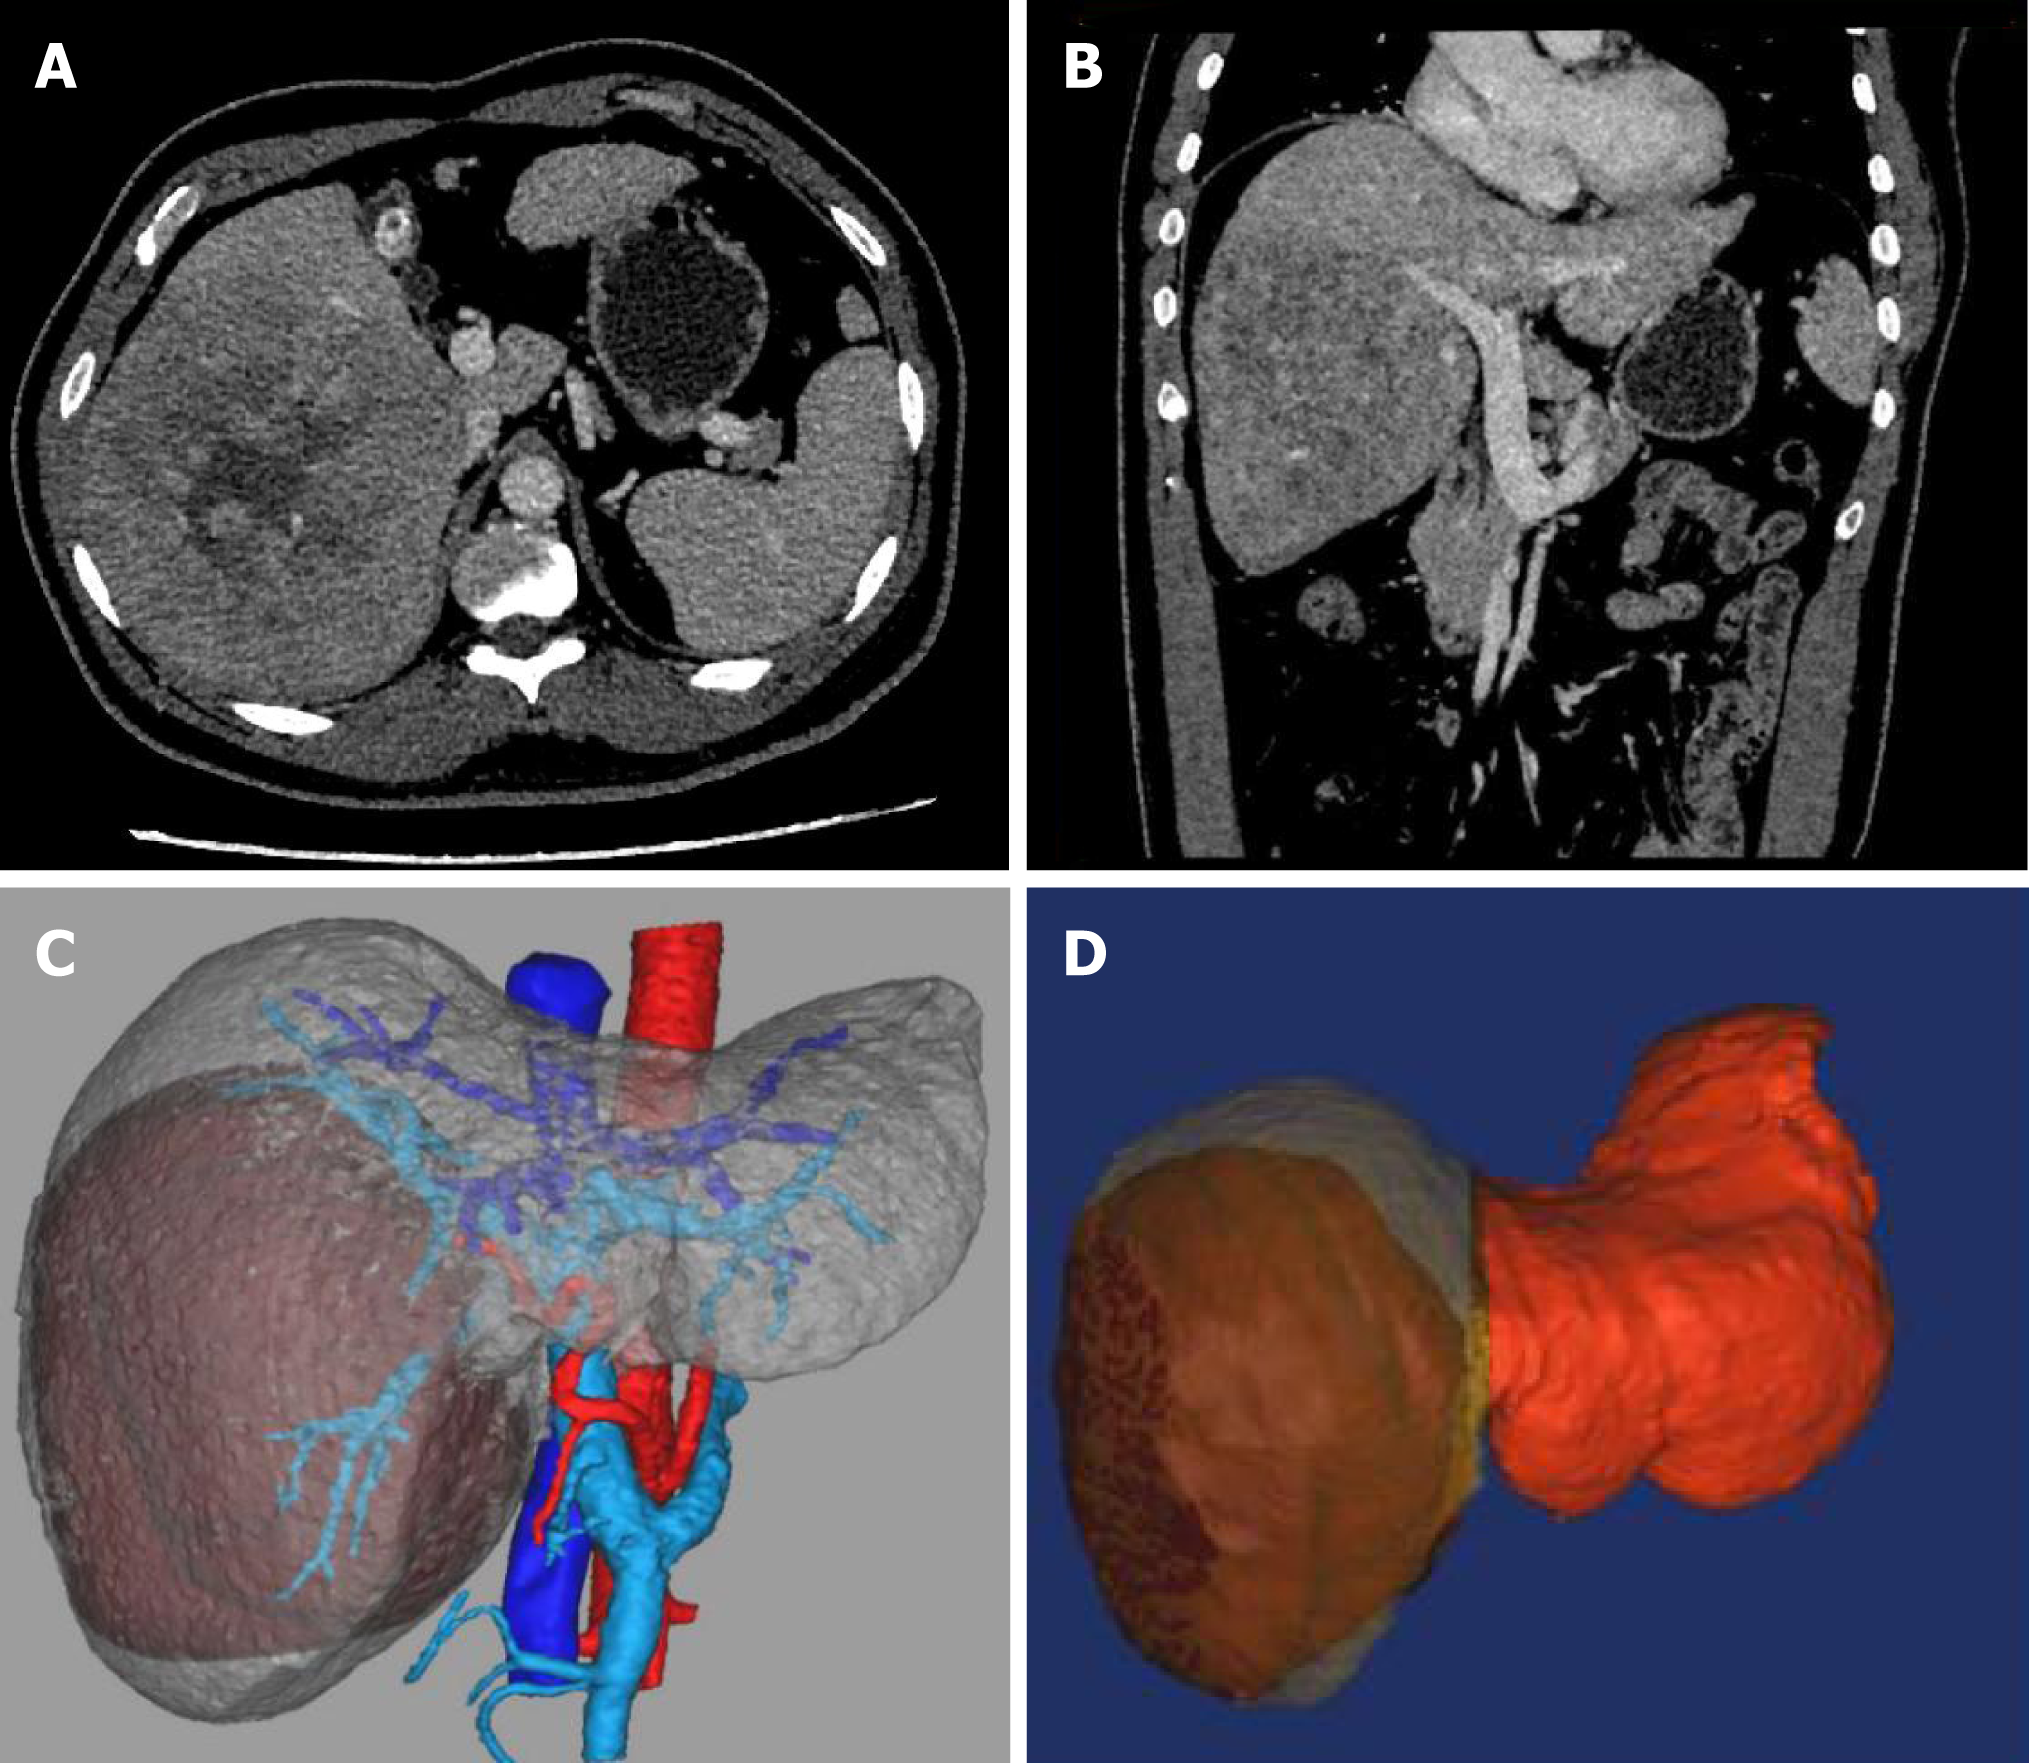
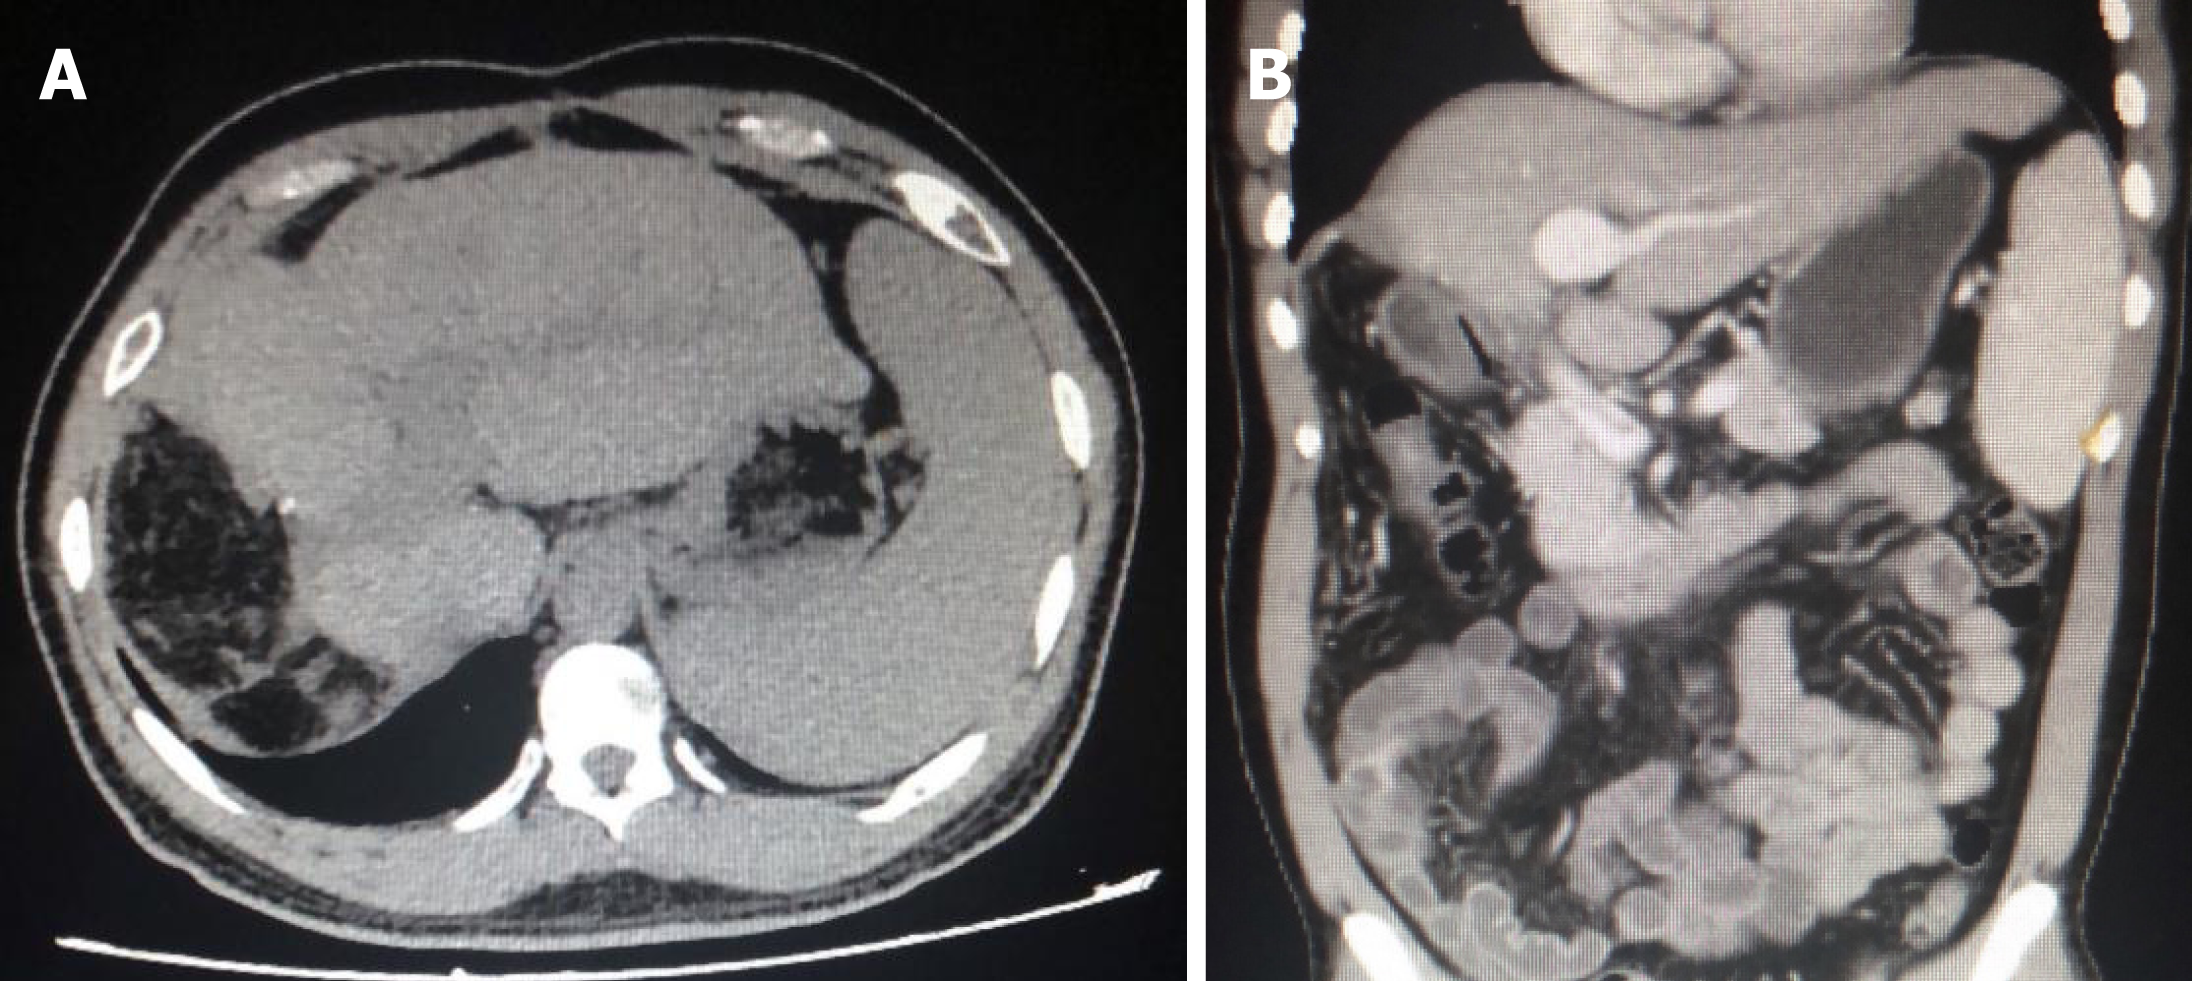
Figure 1 Preoperative computed tomography images and 3D reconstruction.
A and B: Computed tomography (CT) transverse (A) and coronal (B) images before operation; C: 3D image showing the relationship between tumor, blood vessels, and the bile ducts; D: 3D image (red color for residual liver, gray color for tumor).
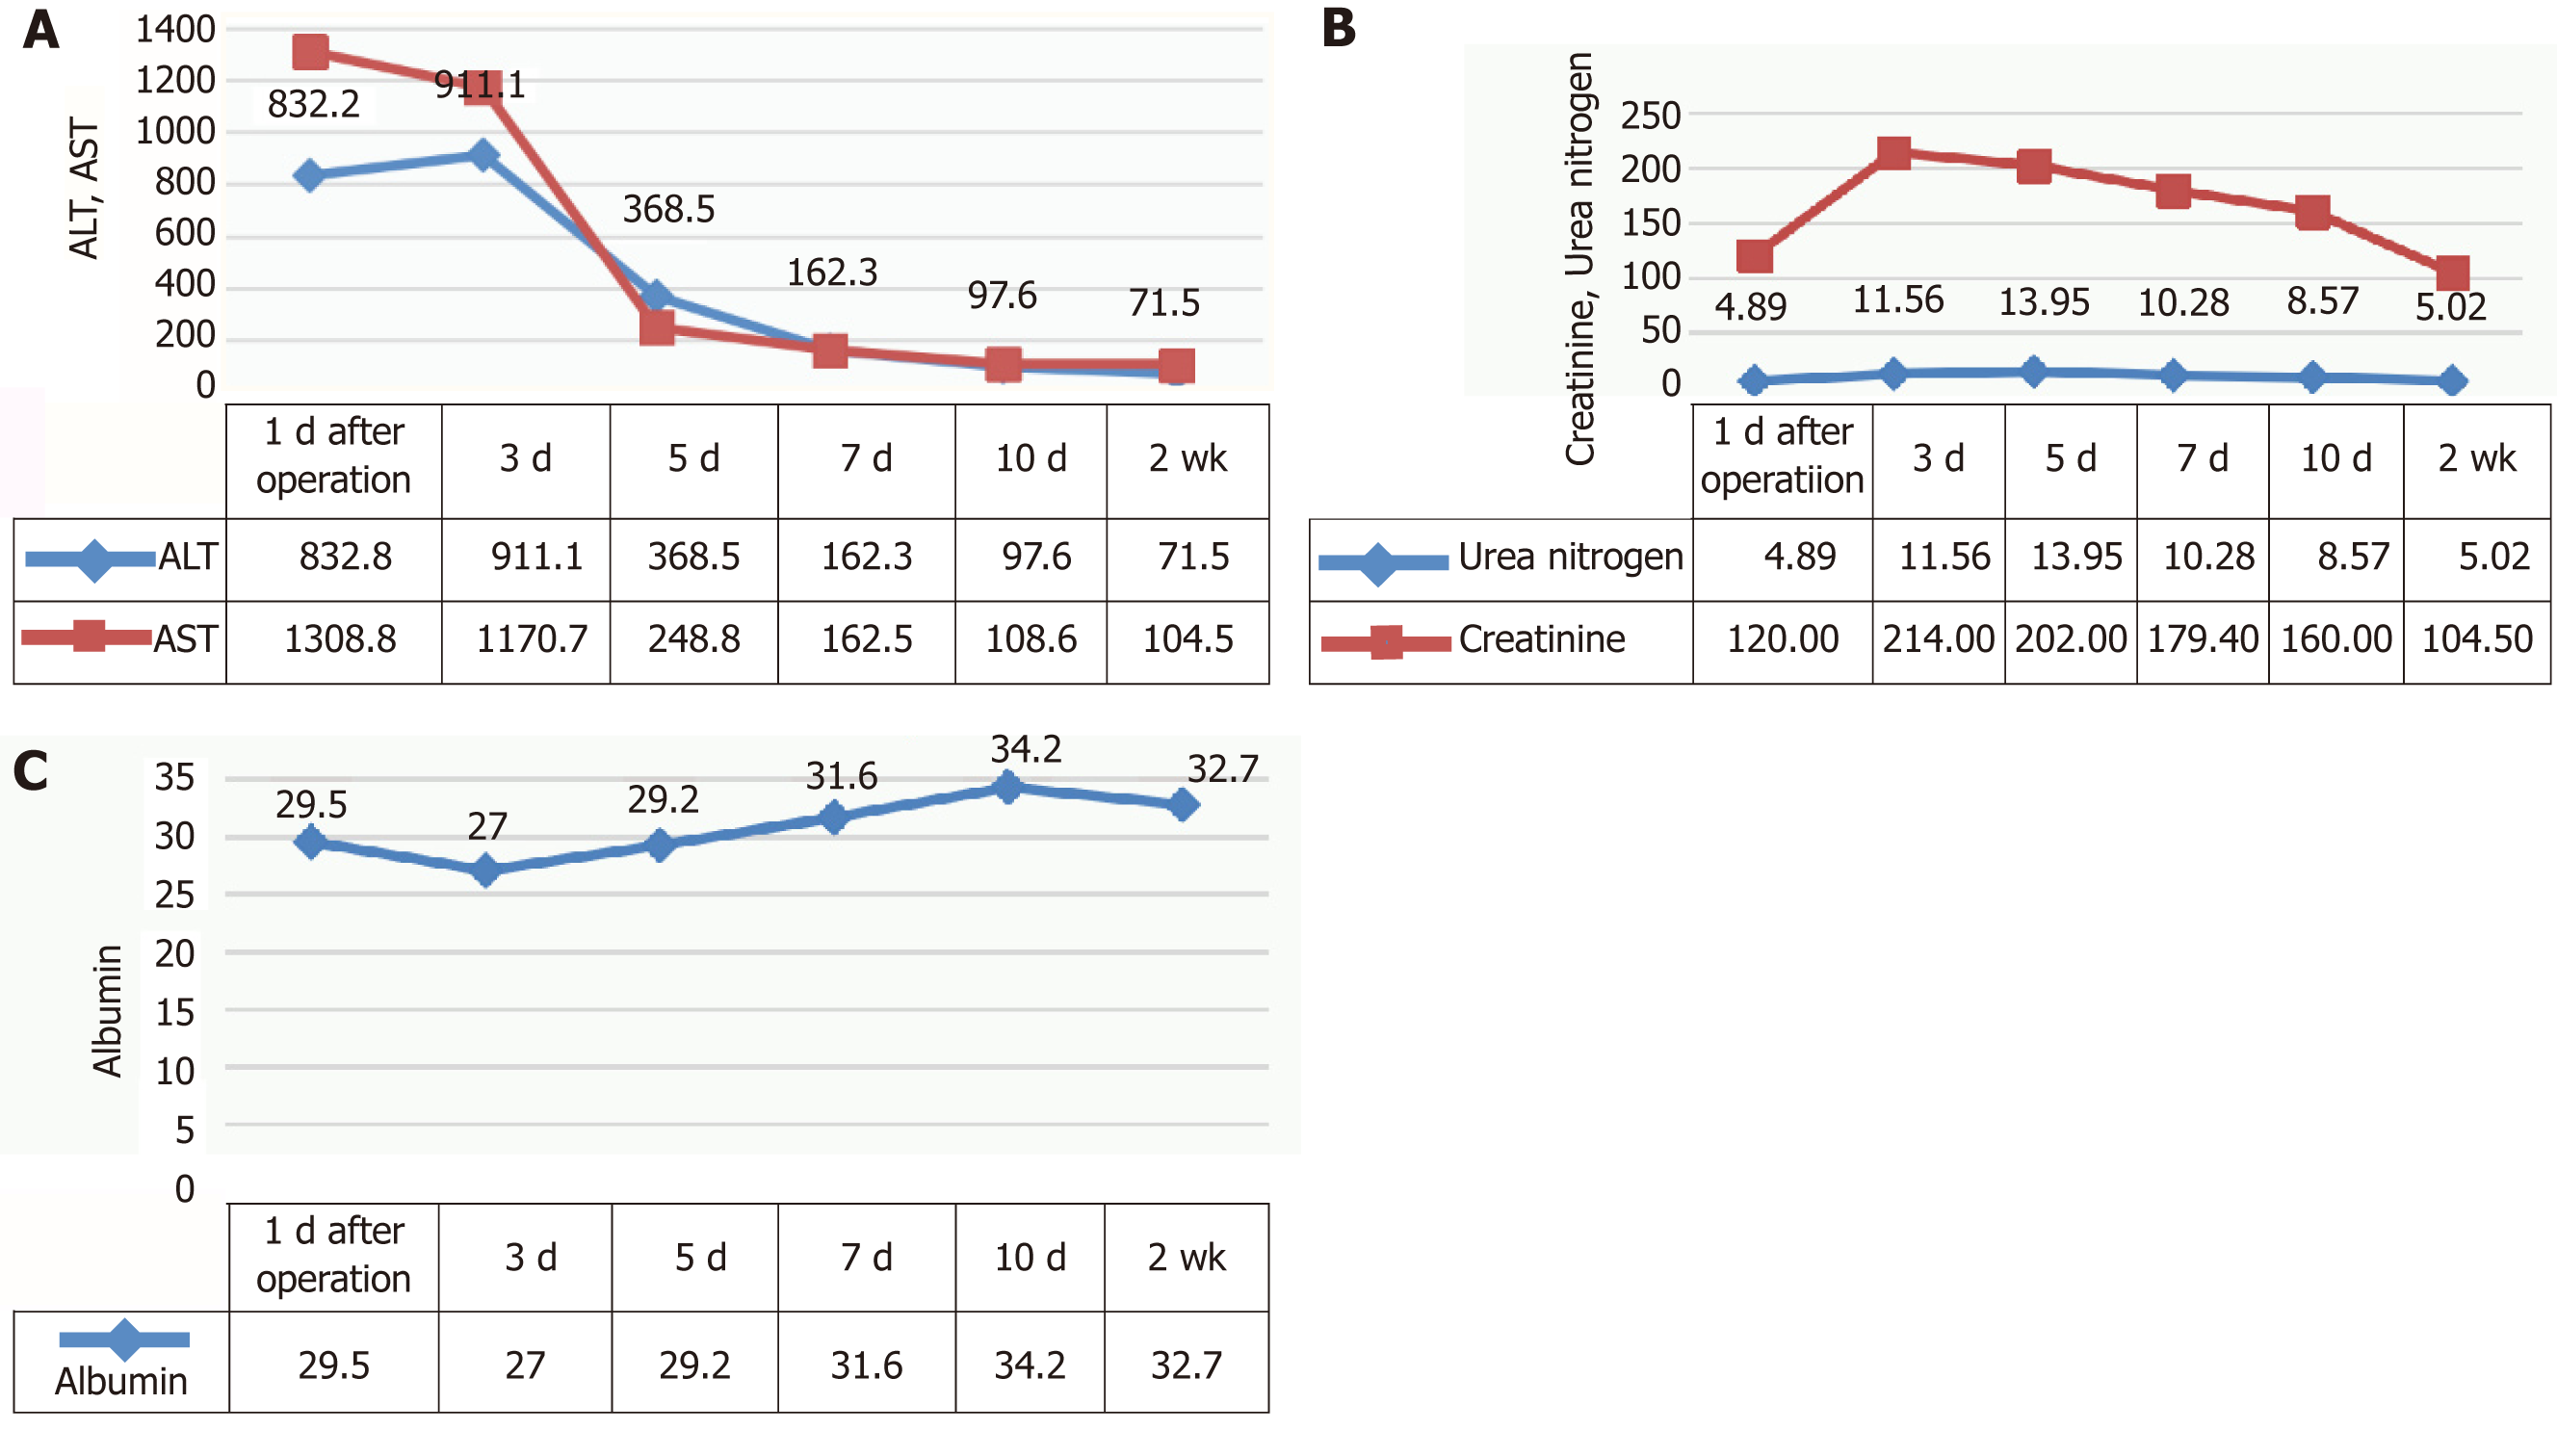
Figure 2 Changes of laboratory examinations after operation.
A: Postoperative changes of transaminase (green line: ALT; yellow line: AST); B: Postoperative changes of renal function (green line: creatinine; yellow line: urea nitrogen); C: Postoperative albumin changes. ALT: Alanine transaminase; AST: Aspartate transaminase.
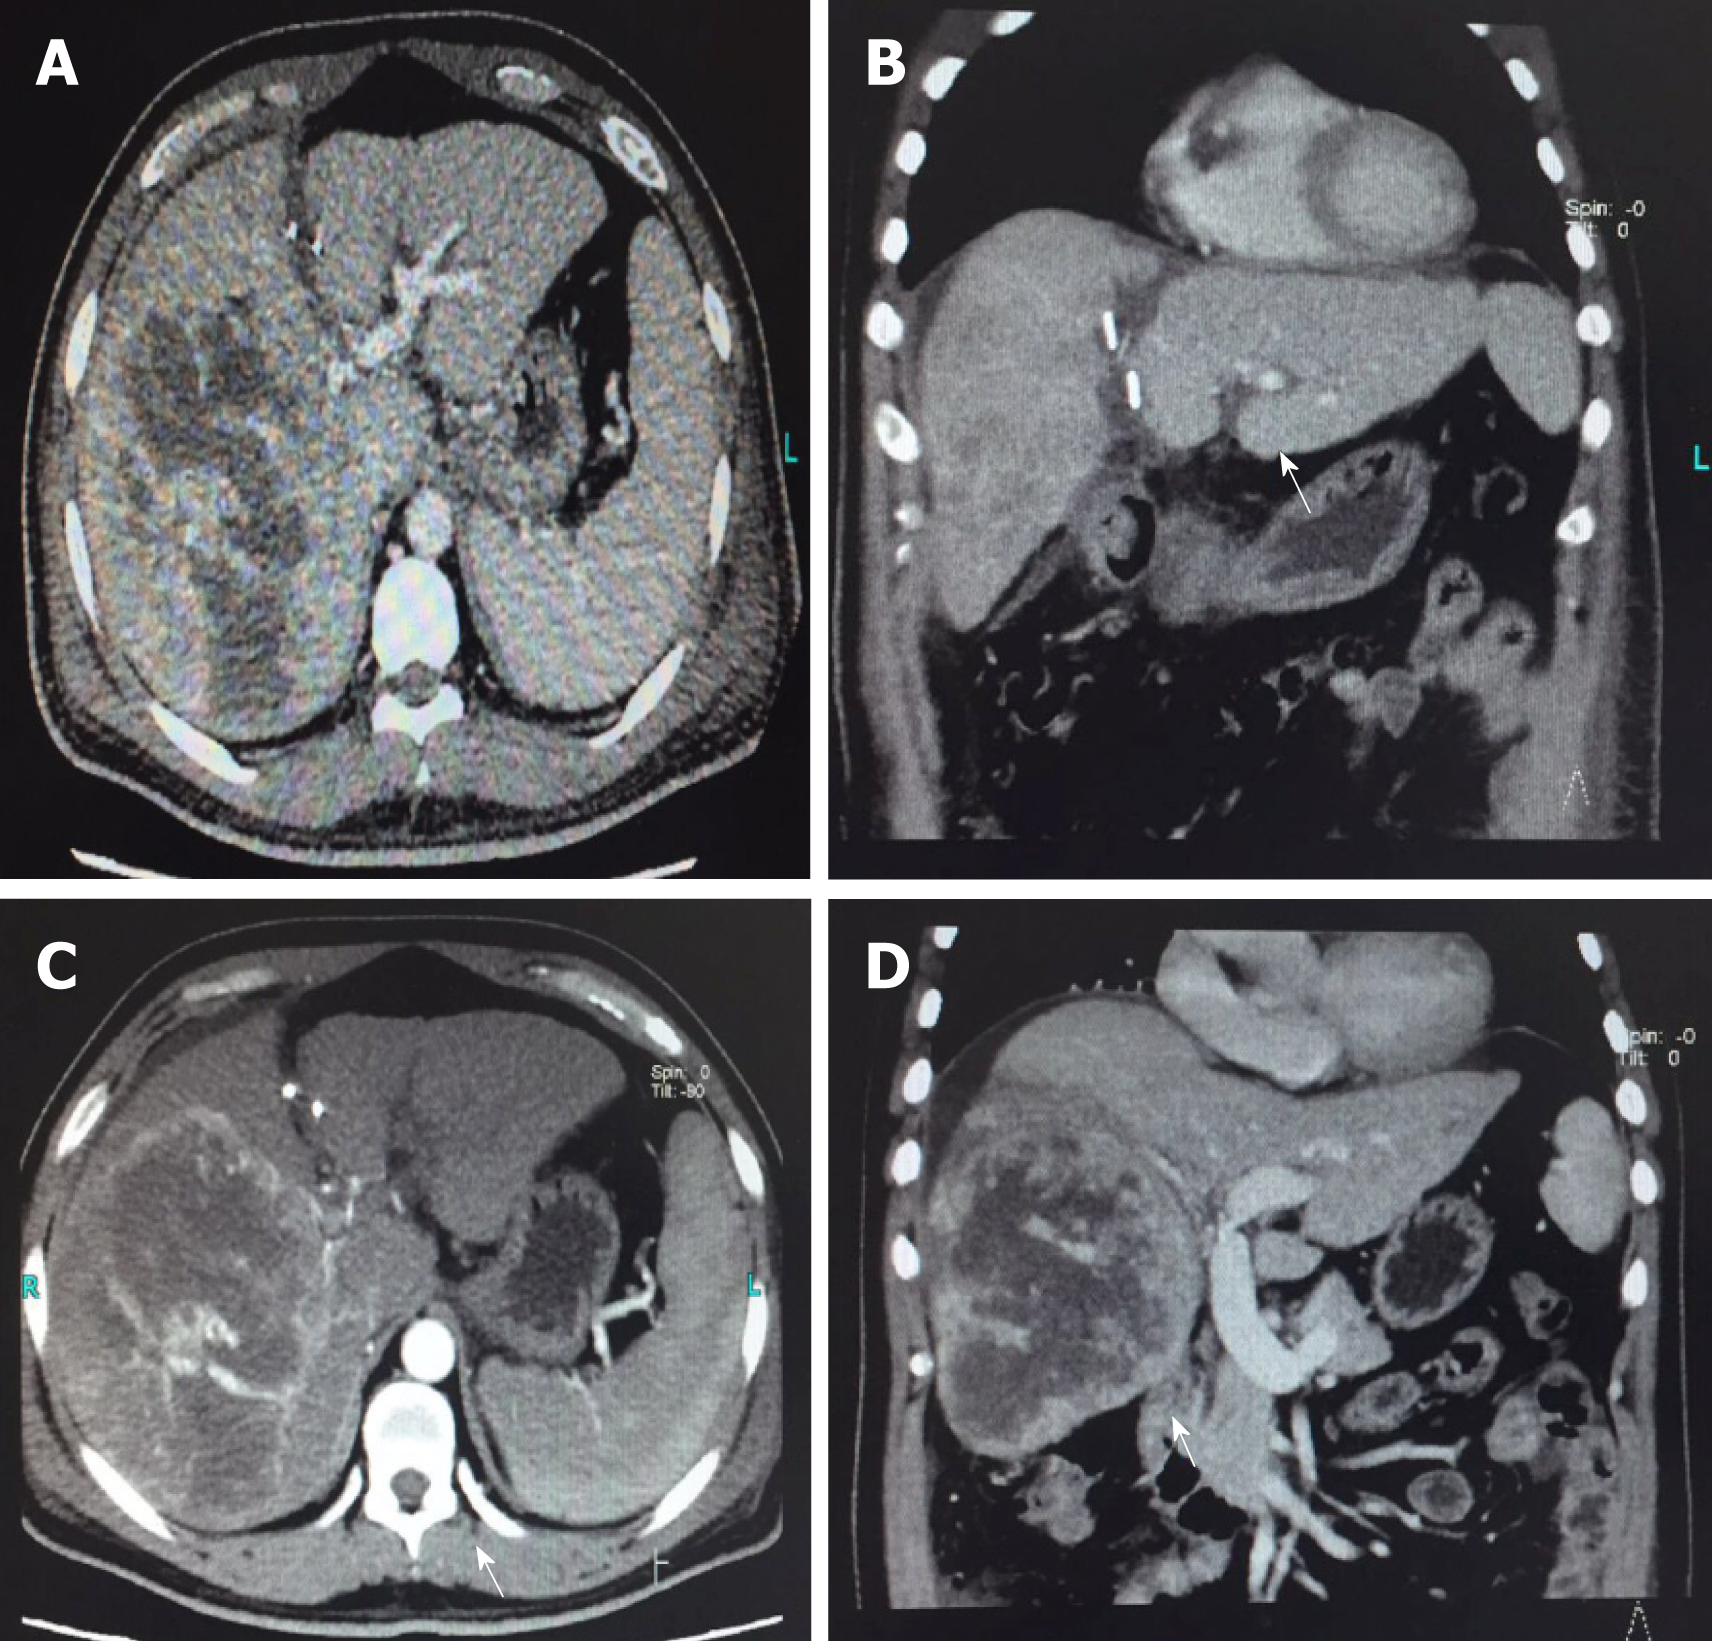
Figure 3 Postoperative computed tomography images.
A and B: Computed tomography (CT) transverse (A) and coronal (B) images on the 9th day after operation; C and D: CT transverse (C) and coronal (D) images on the 16th day after operation.
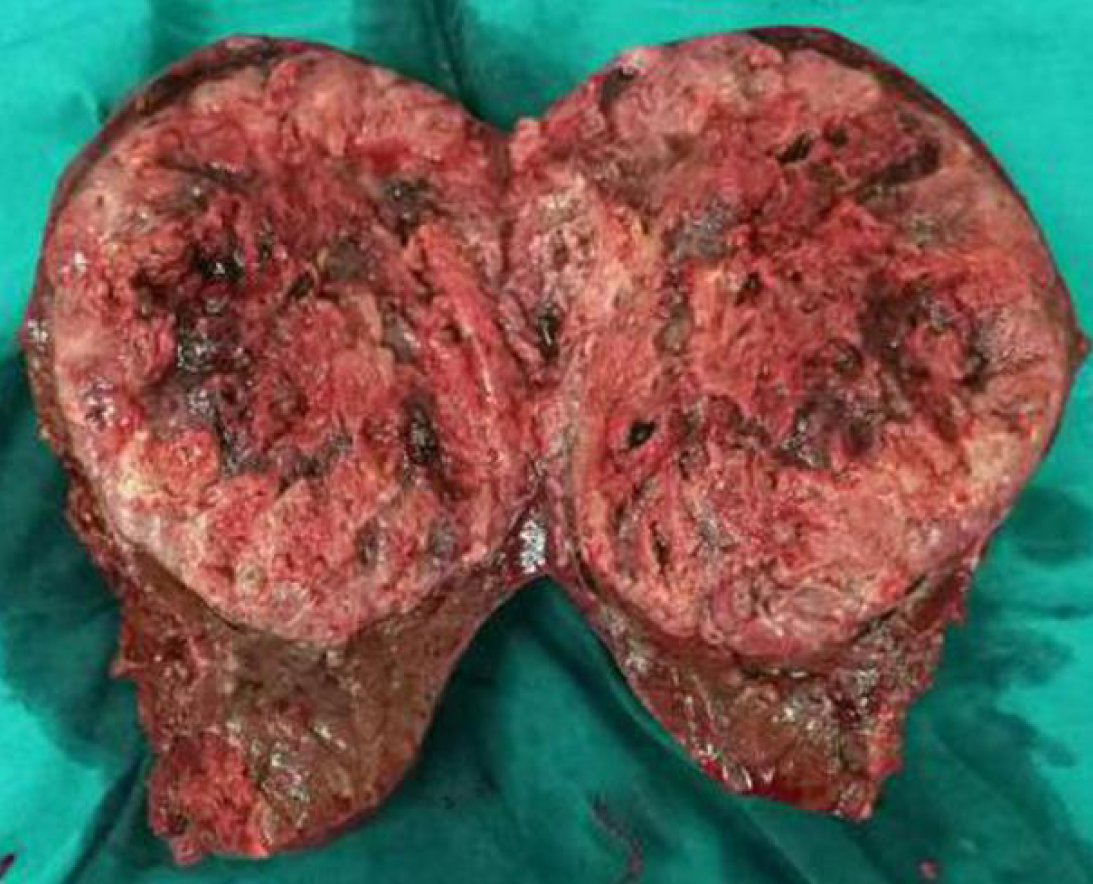
Figure 4 Postoperative liver specimen.
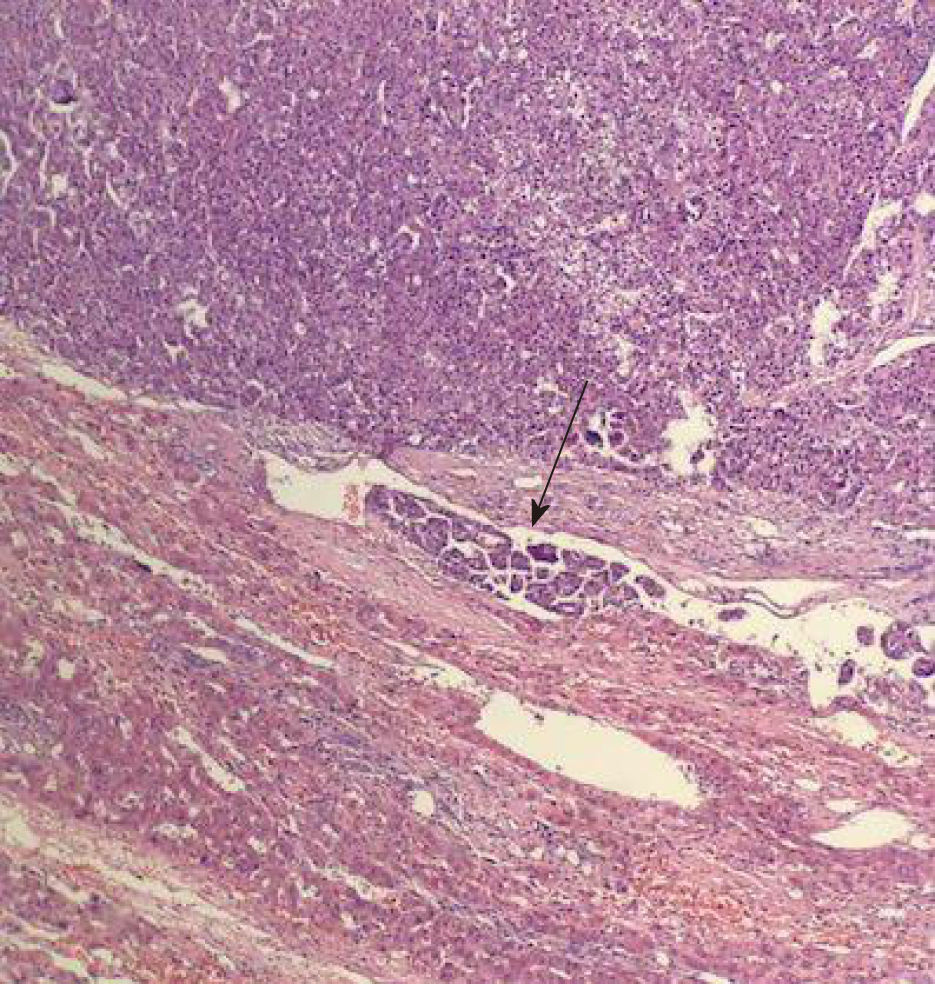
Figure 5 Pathological picture.
The arrow in the picture shows a clear microvascular tumor thrombus.
Figure 6 Twenty-month follow-up computed tomography images indicating no recurrence of tumor.
A and B: Computed tomography (CT) transverse (A) and coronal (B) images obtained in August 2018.
- Citation: Liu L, Li NF, Zhang Q, Lin L. Hepatocellular carcinoma successfully treated with ALPPS and apatinib: A case report. World J Clin Cases 2019; 7(16): 2384-2392
- URL: https://www.wjgnet.com/2307-8960/full/v7/i16/2384.htm
- DOI: https://dx.doi.org/10.12998/wjcc.v7.i16.2384


