Copyright
©The Author(s) 2019.
World J Clin Cases. Aug 26, 2019; 7(16): 2287-2301
Published online Aug 26, 2019. doi: 10.12998/wjcc.v7.i16.2287
Published online Aug 26, 2019. doi: 10.12998/wjcc.v7.i16.2287
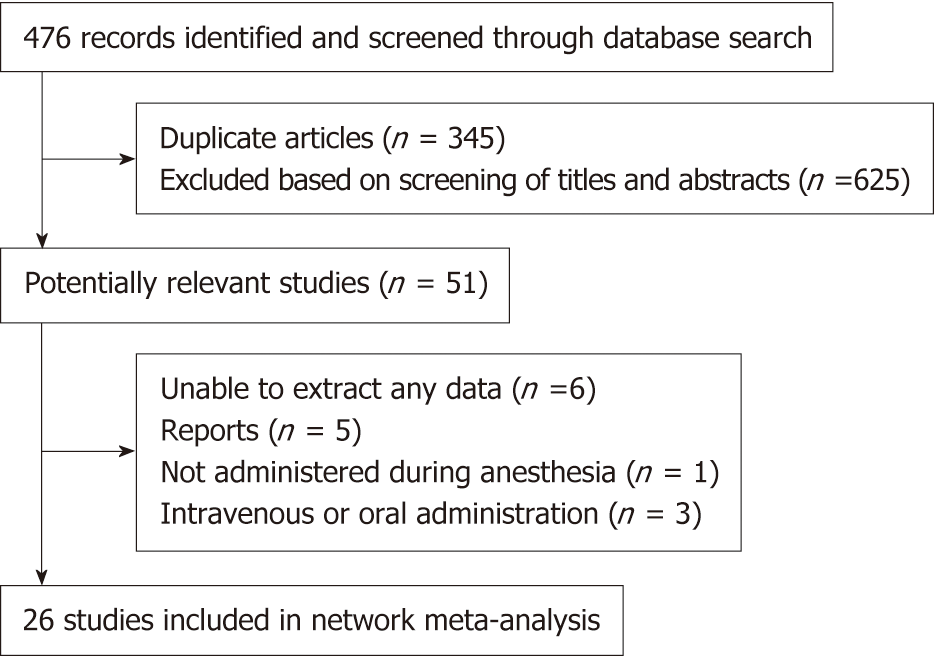
Figure 1 Flow chart of literature search and selection process, inclusion, and exclusion.
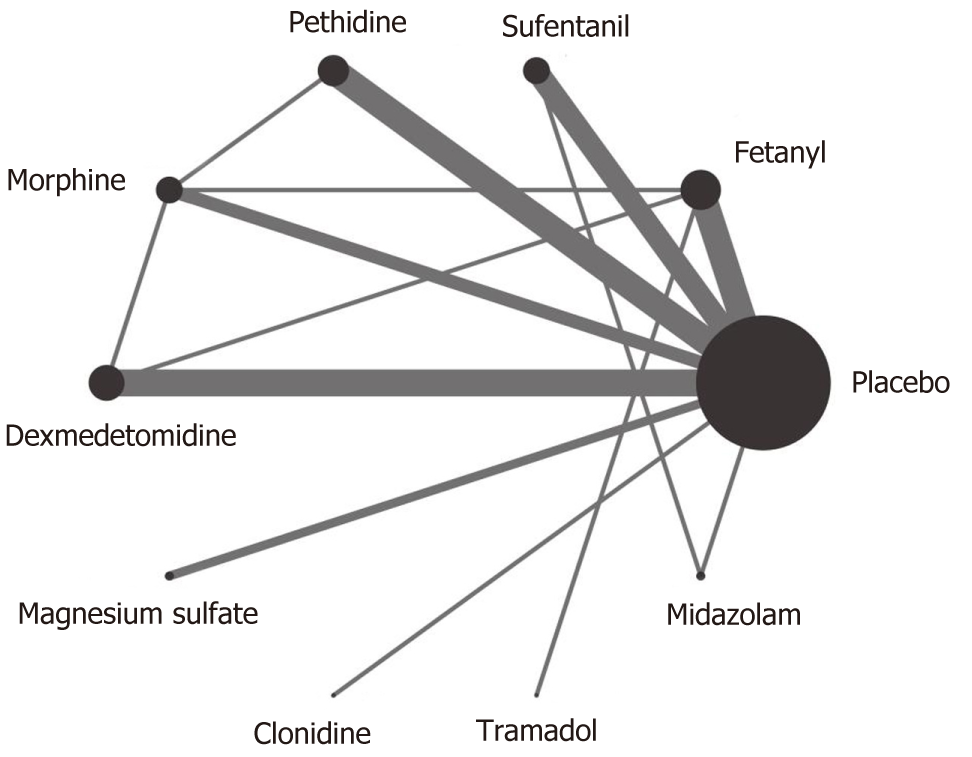
Figure 2 Network plot of eligible comparisons of all neuraxial adjuvants for the prevention of shivering.
The width of the lines is proportional to the number of each pair of direct comparisons, and the size of the point is proportional to sample size.
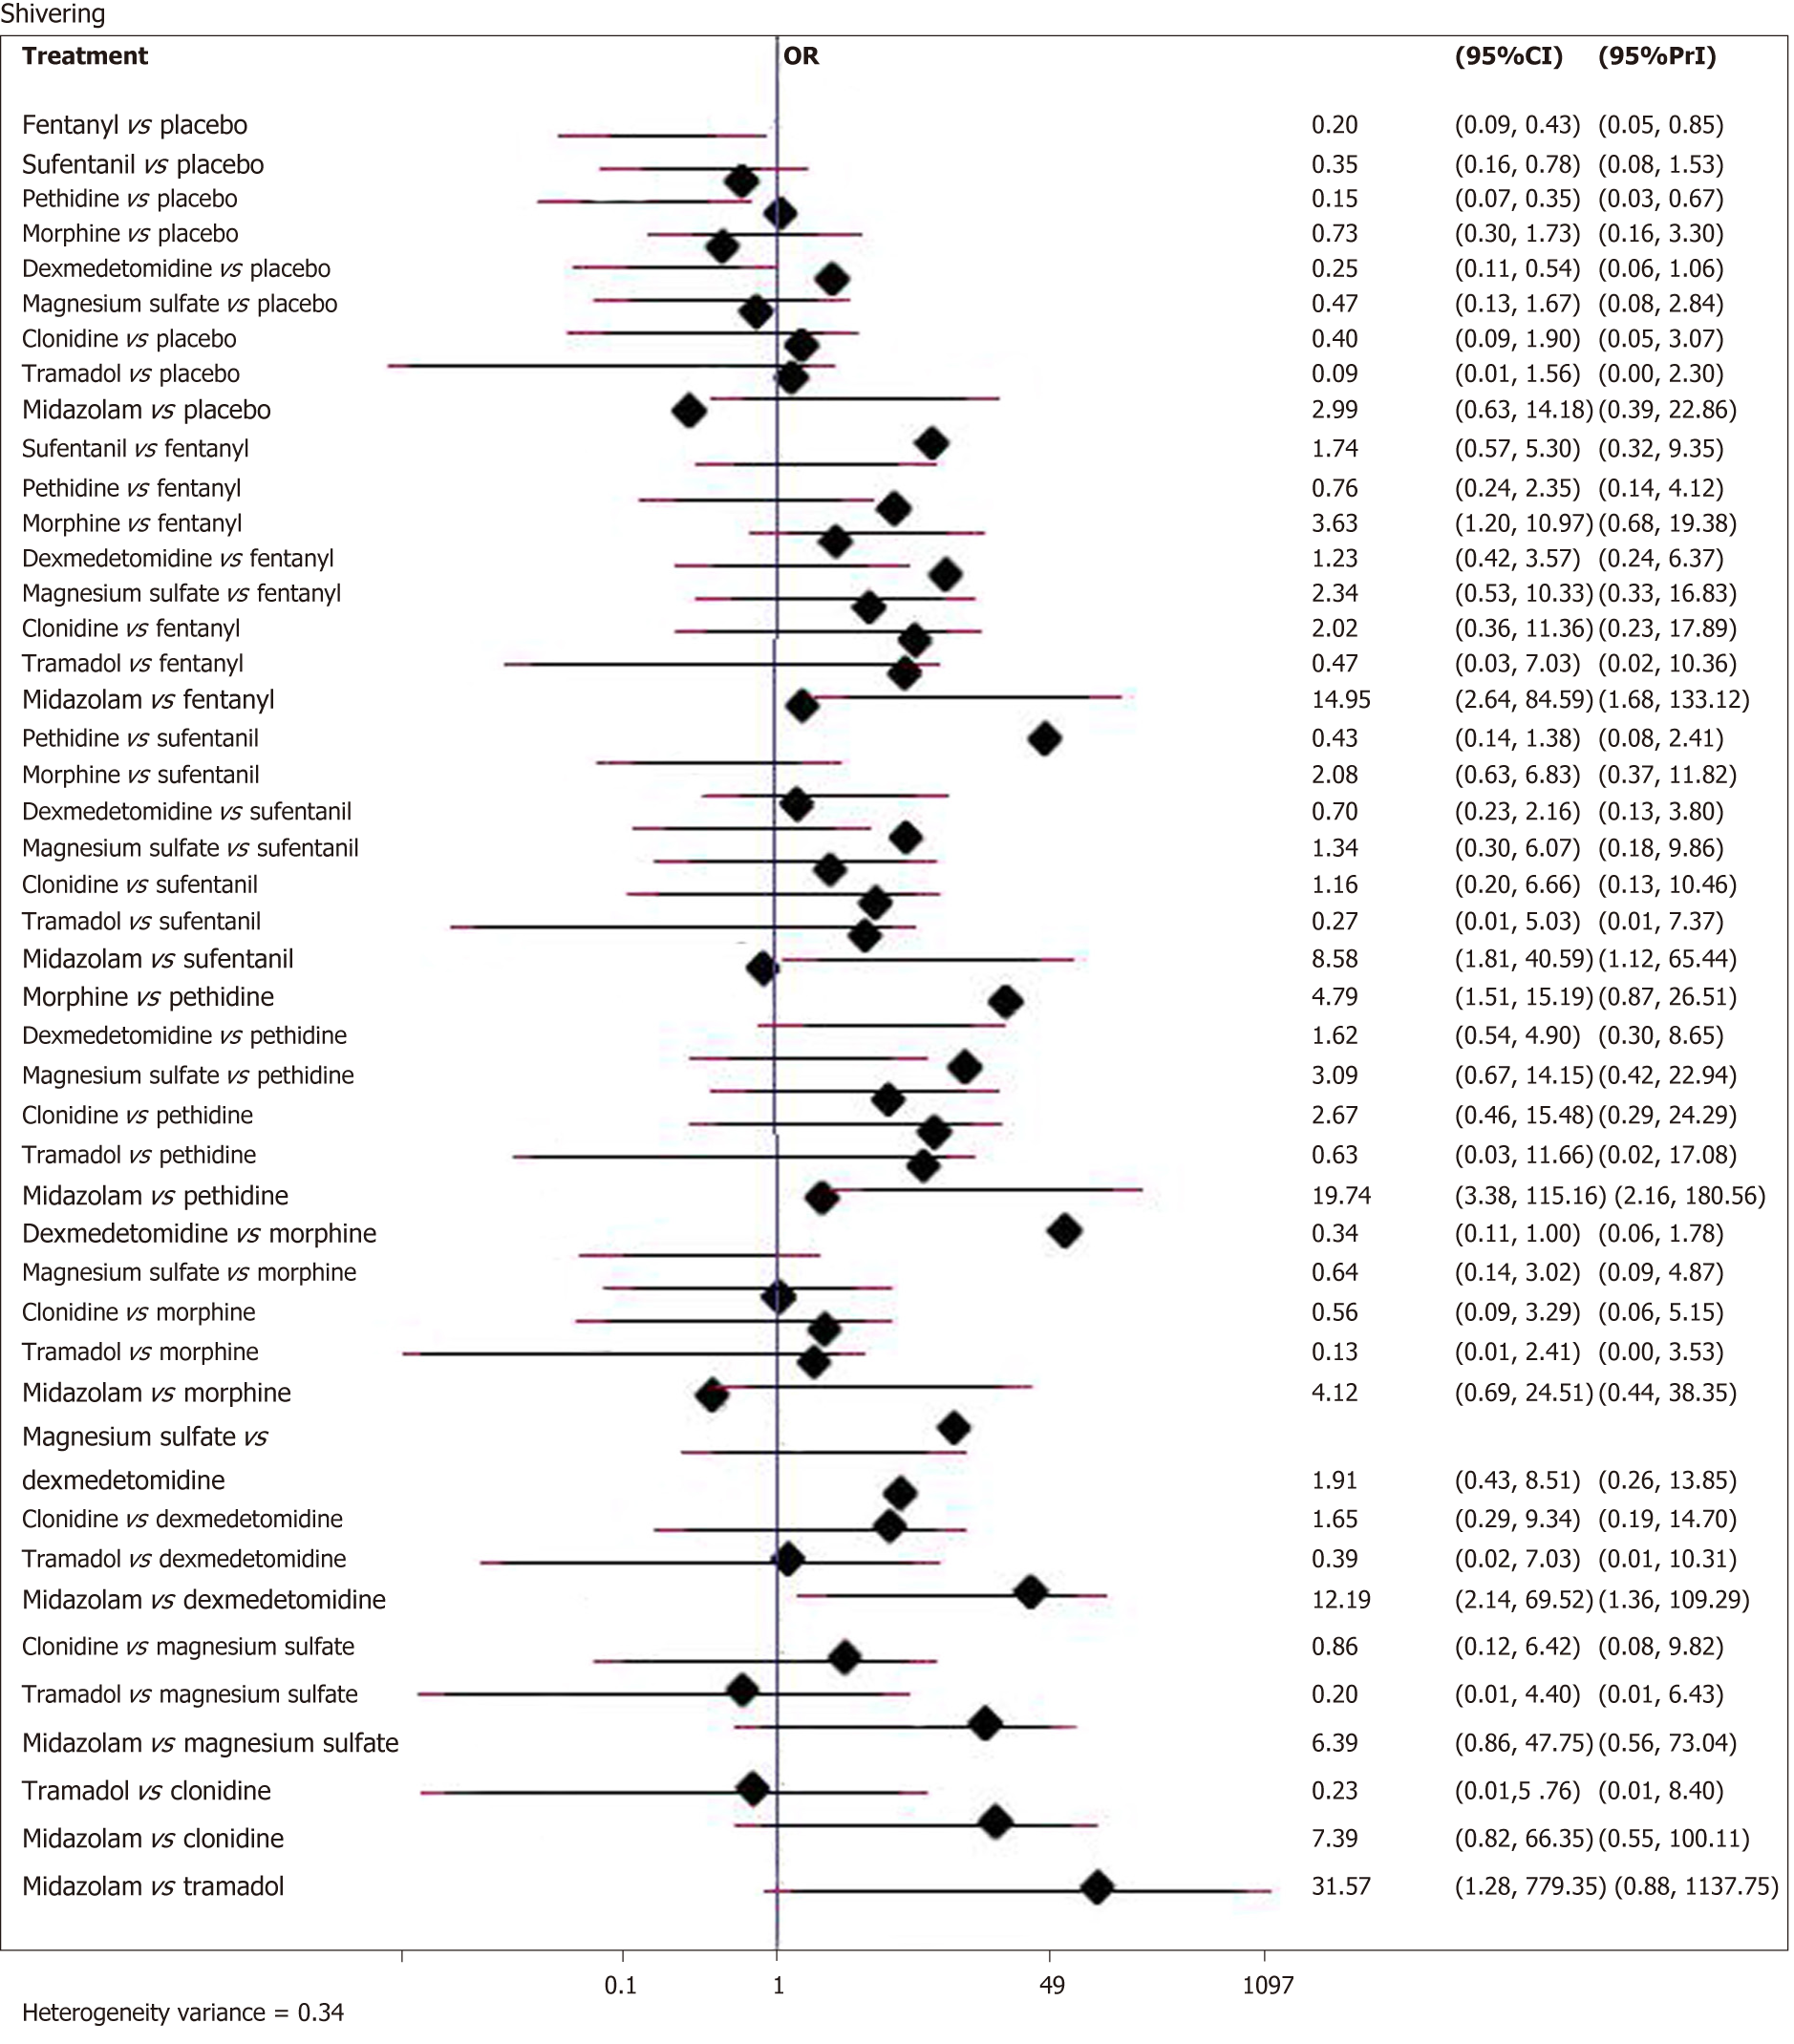
Figure 3 Forest plots of the effect of all neuraxial adjuvants in the prevention of shivering.
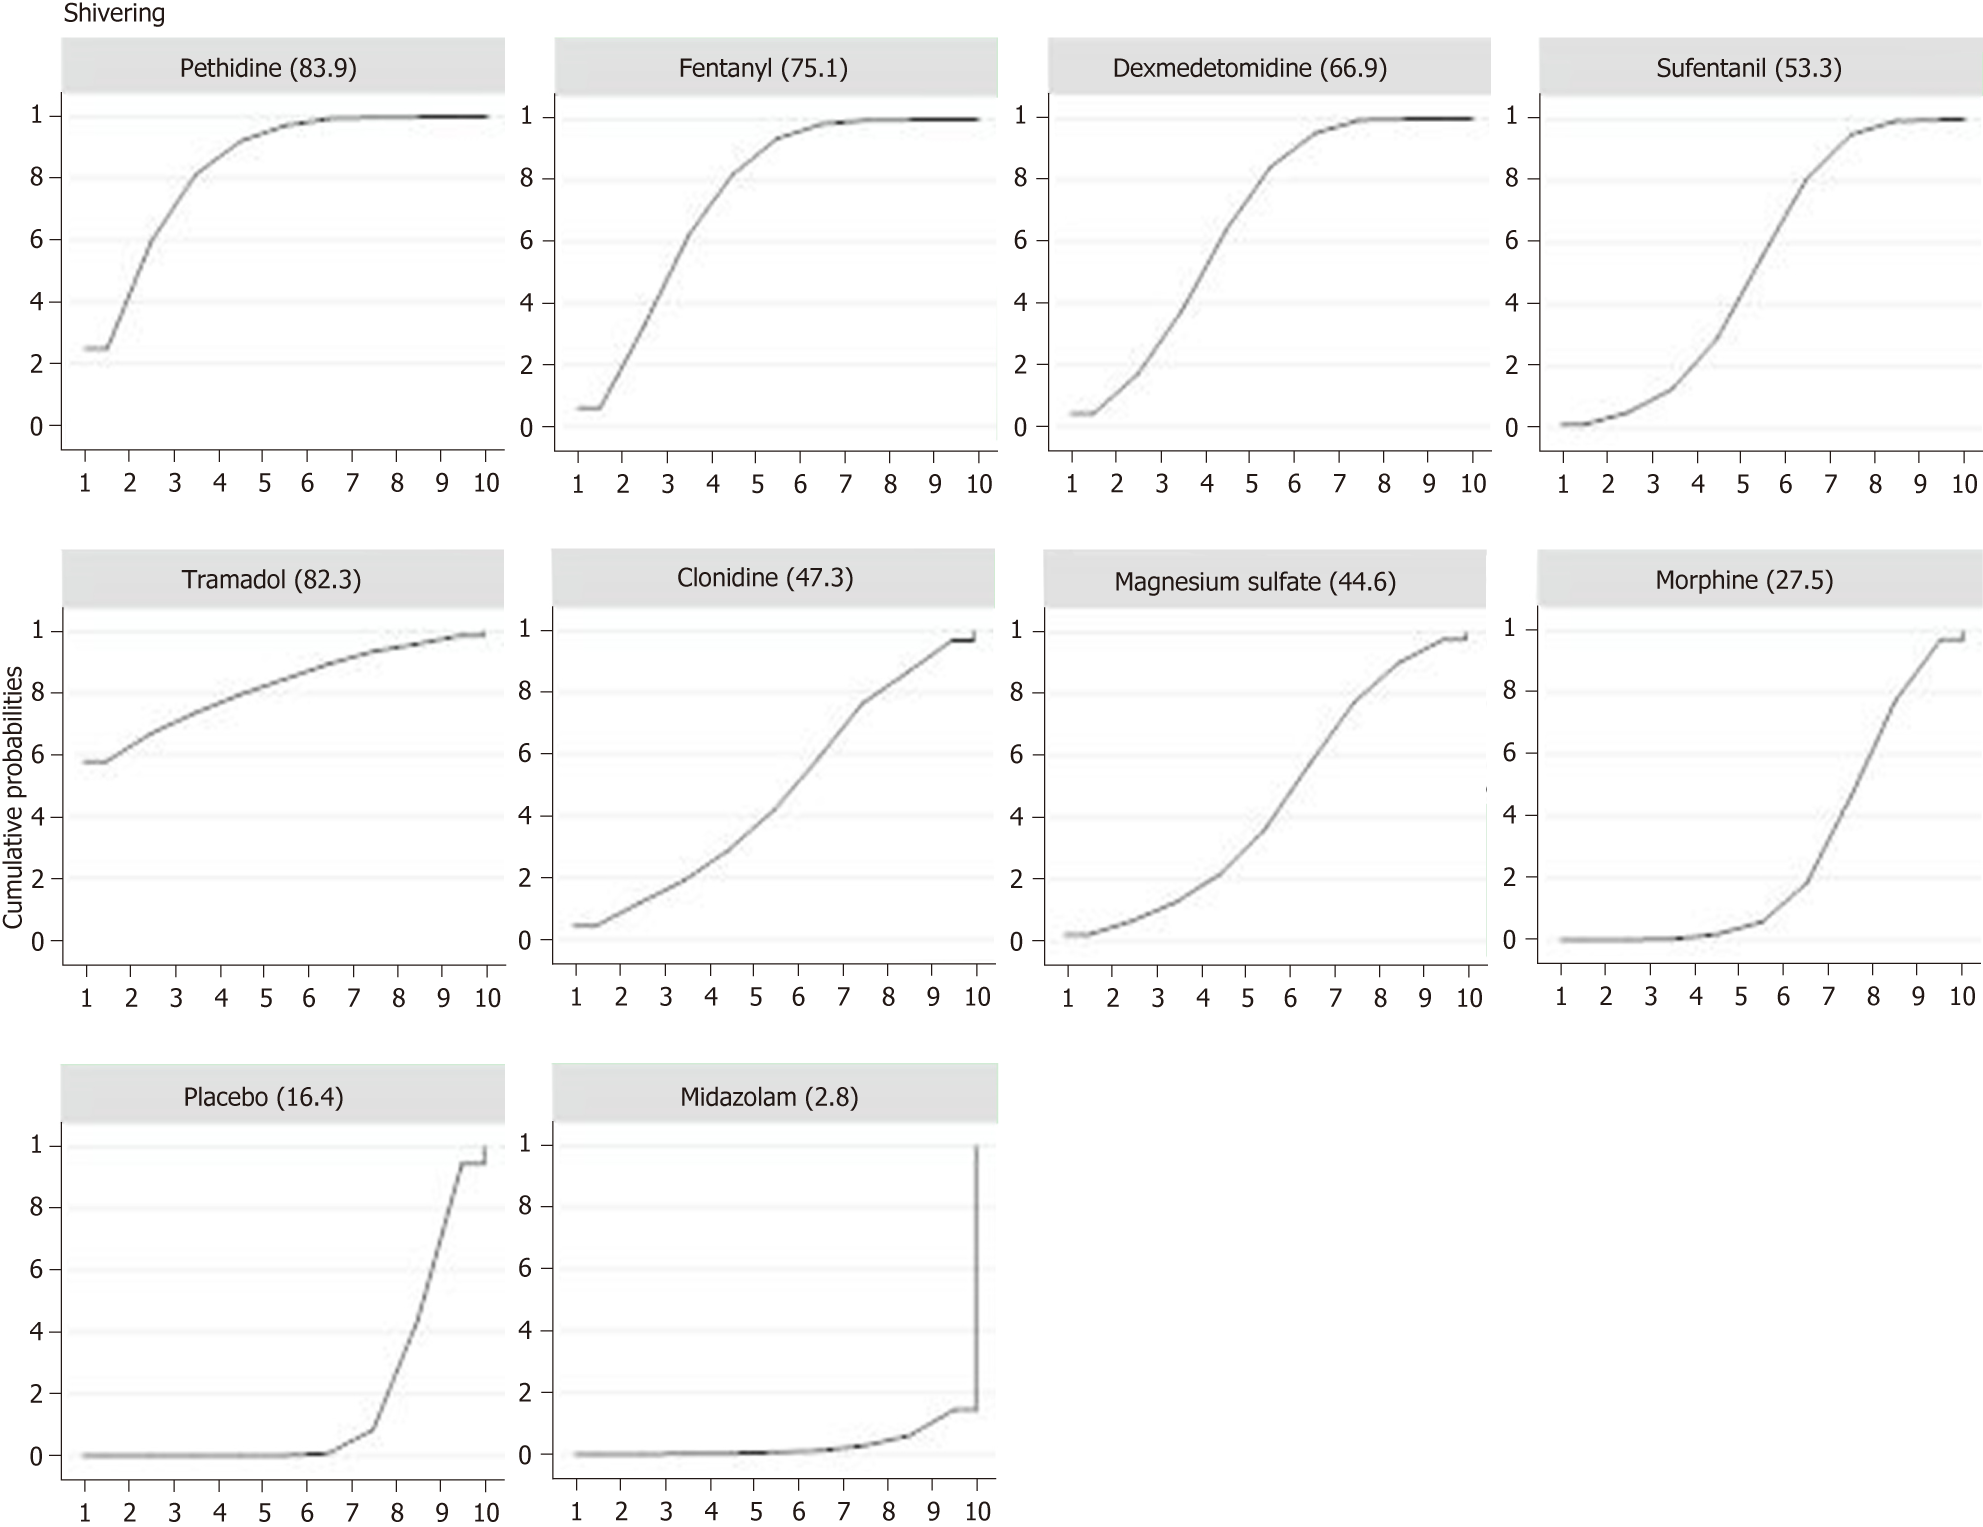
Figure 4 Ranking of SUCRA values of the incidence of shivering.
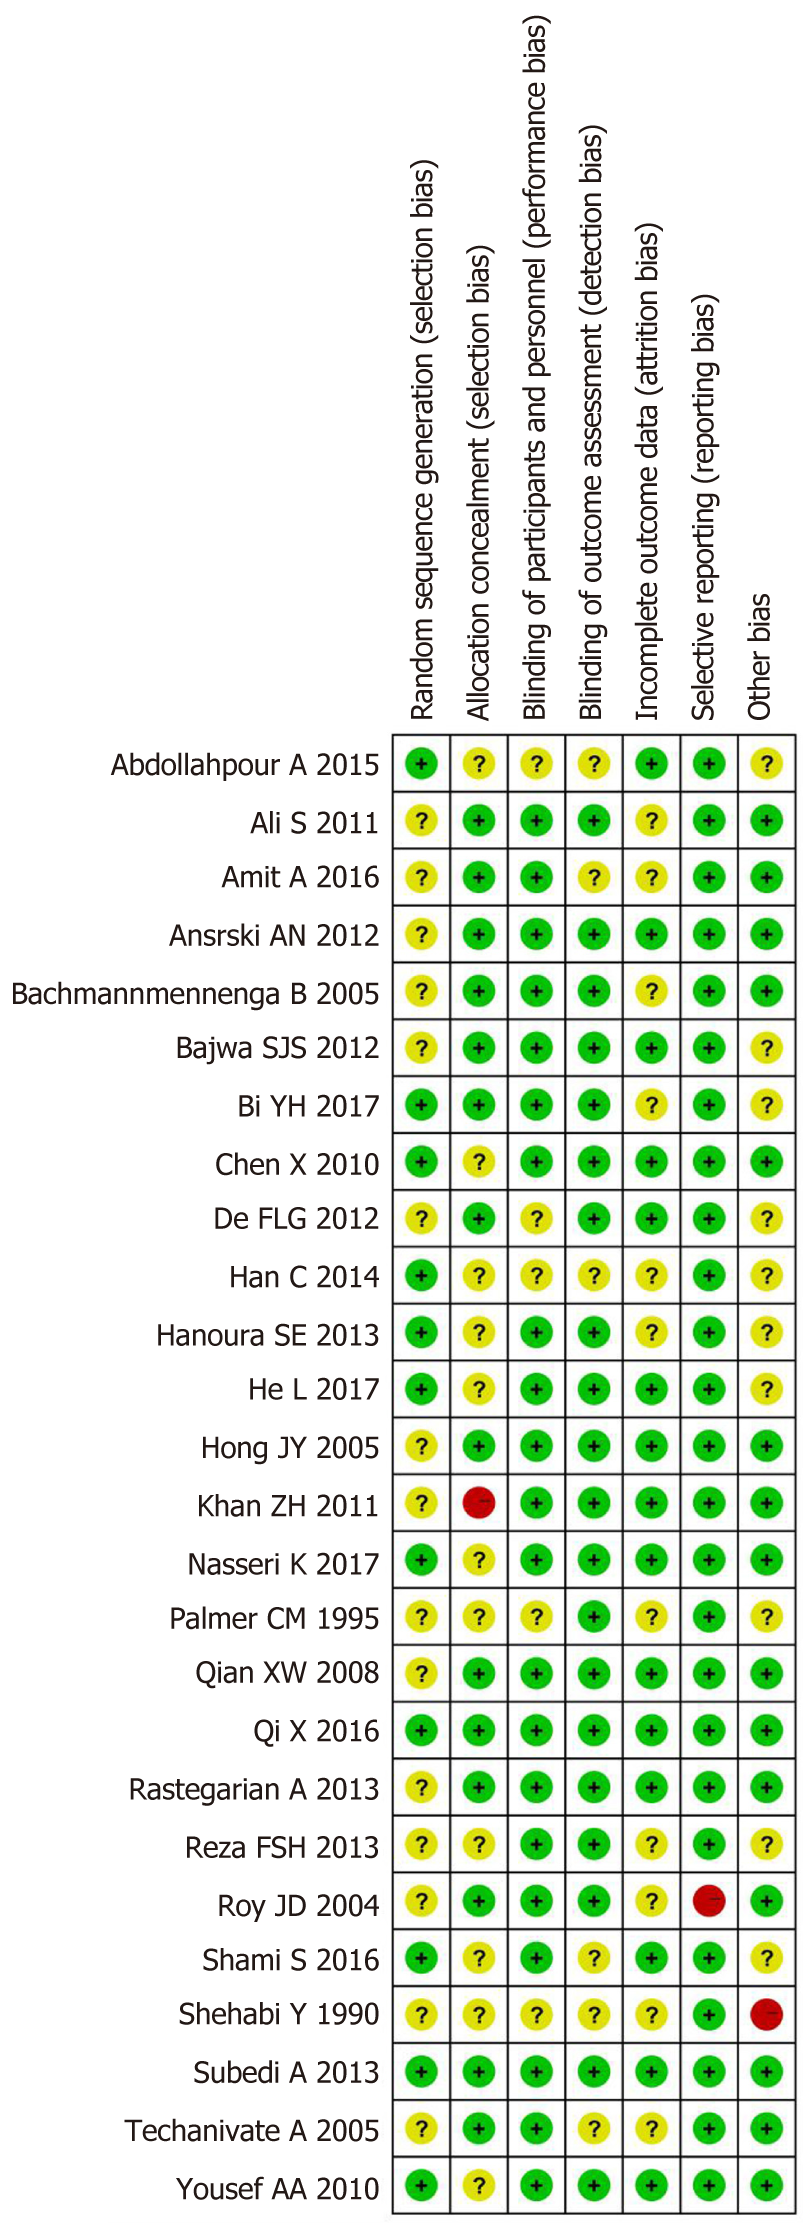
Figure 5 Risk of bias assessment.
Green circle: Low risk of bias; red circle: high risk of bias; yellow circle: Unclear risk of bias.
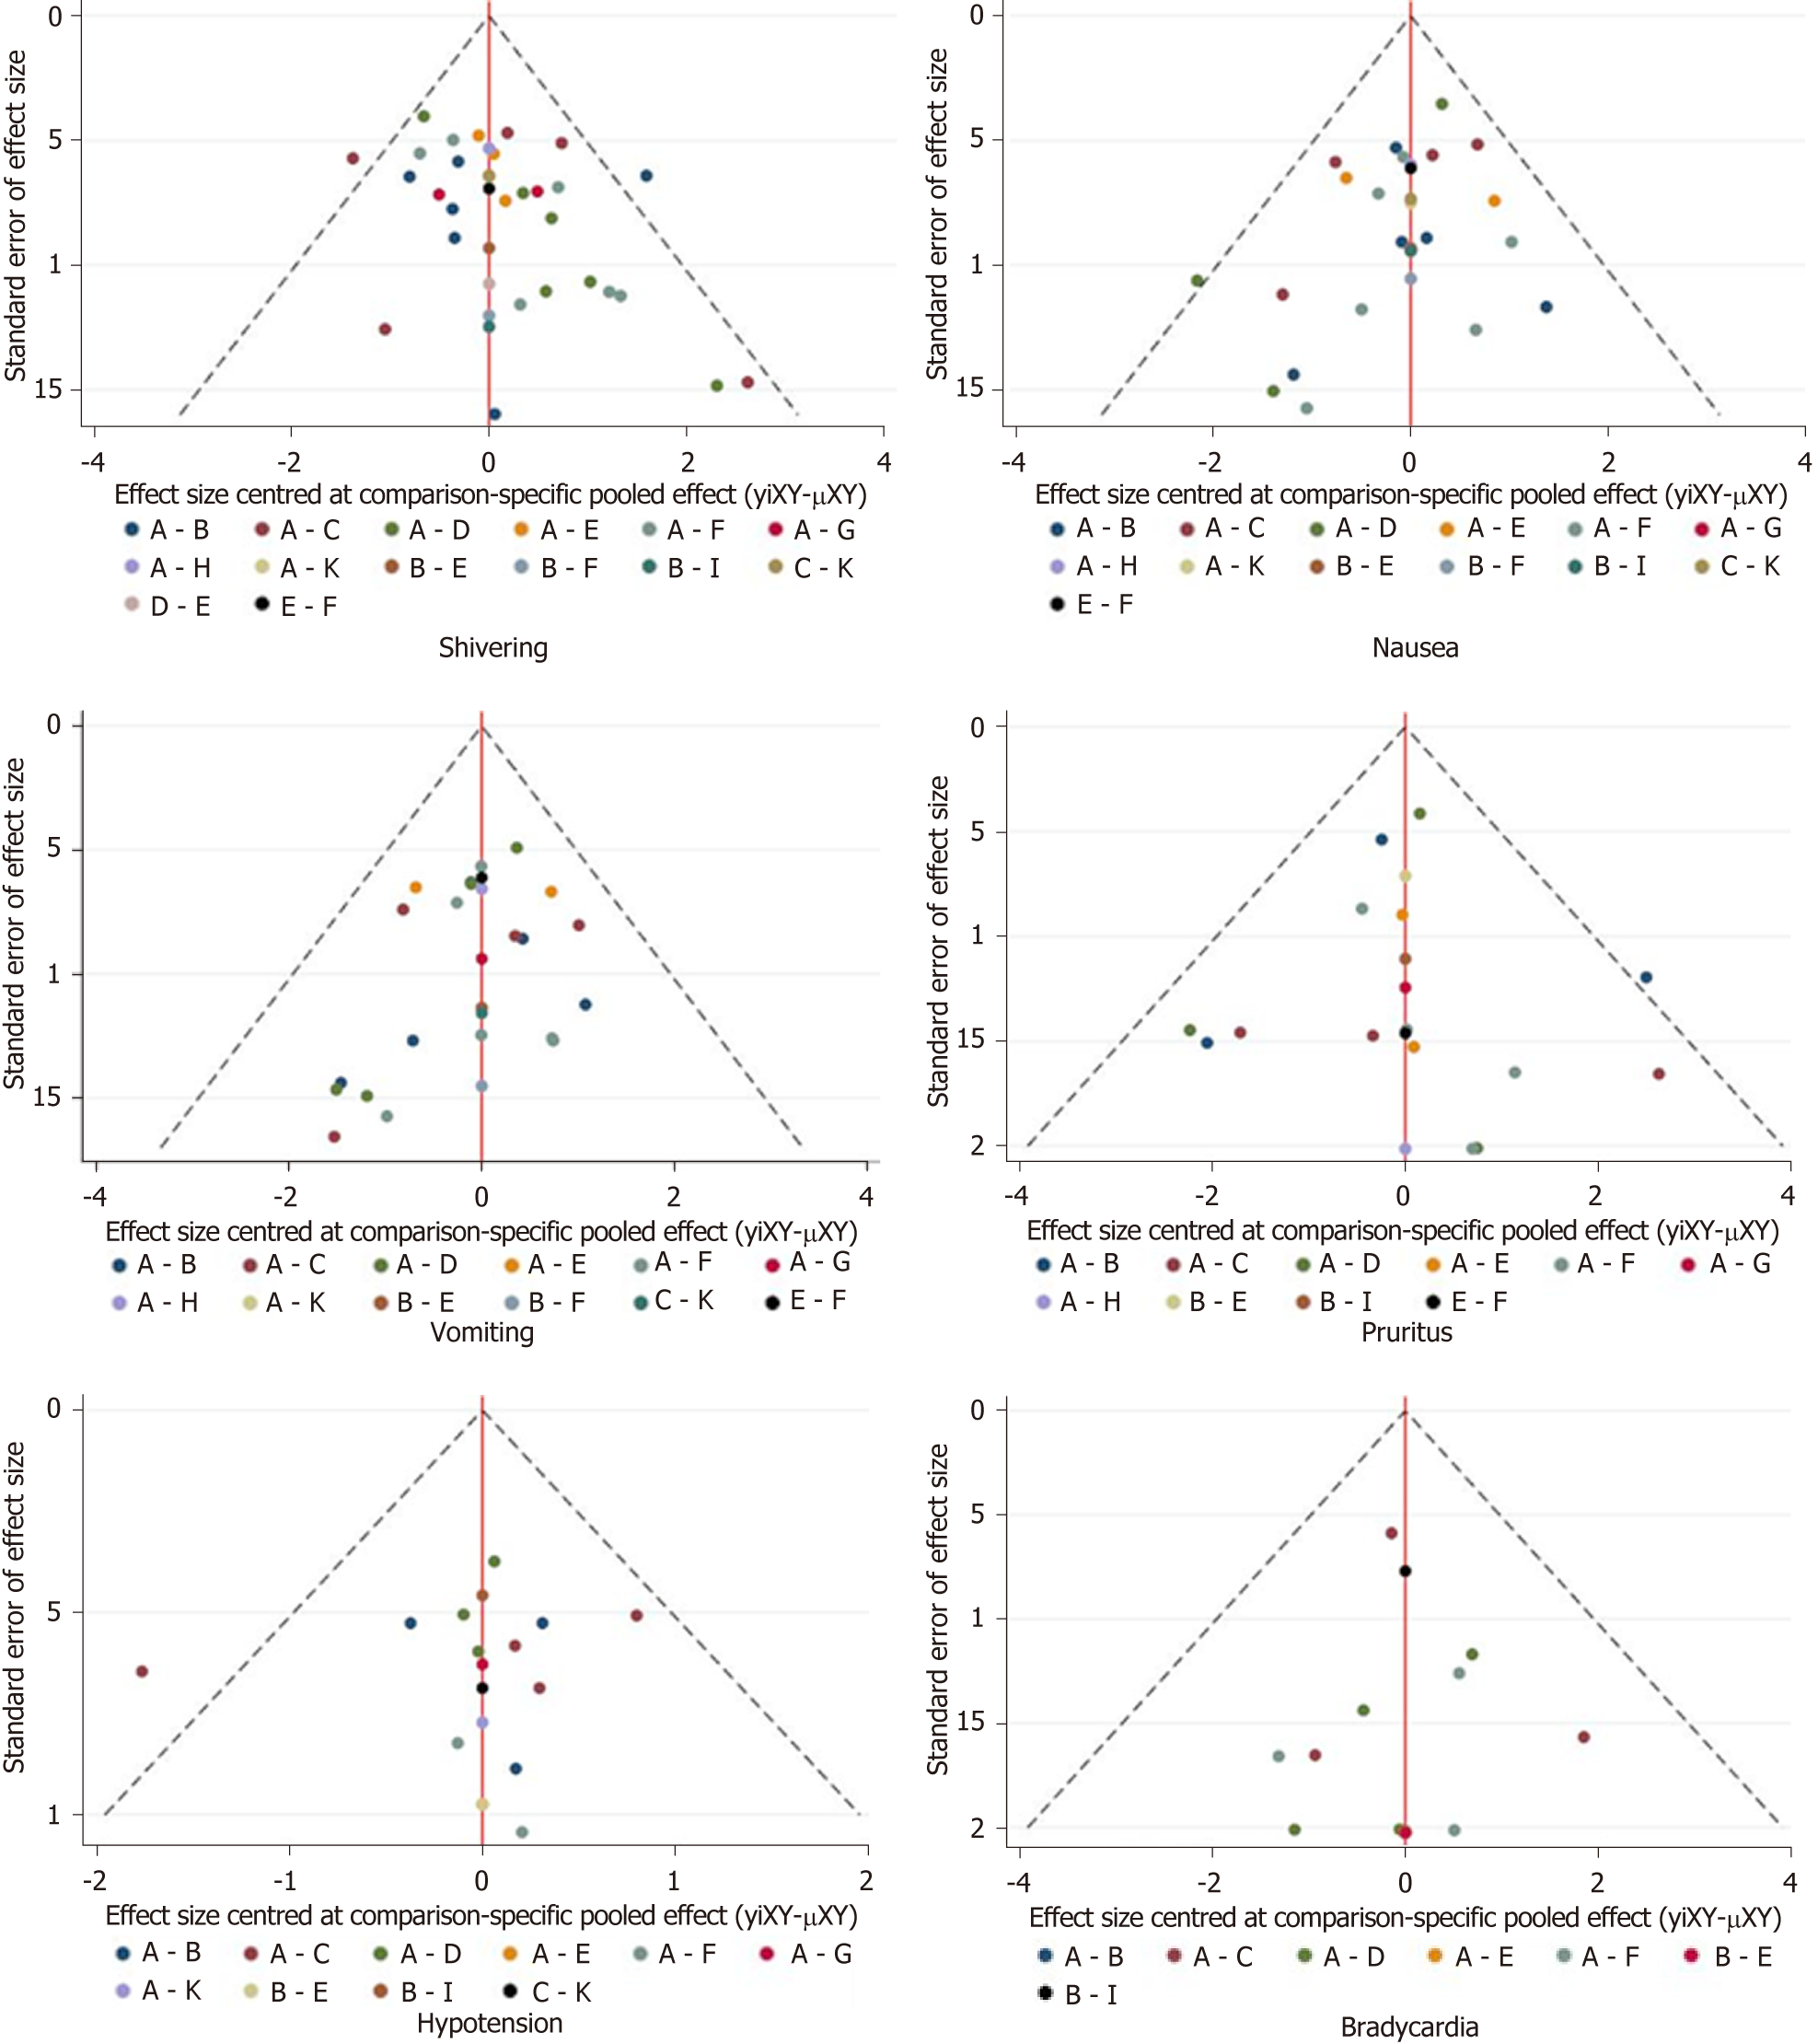
Figure 6 Funnel plots of publication bias.
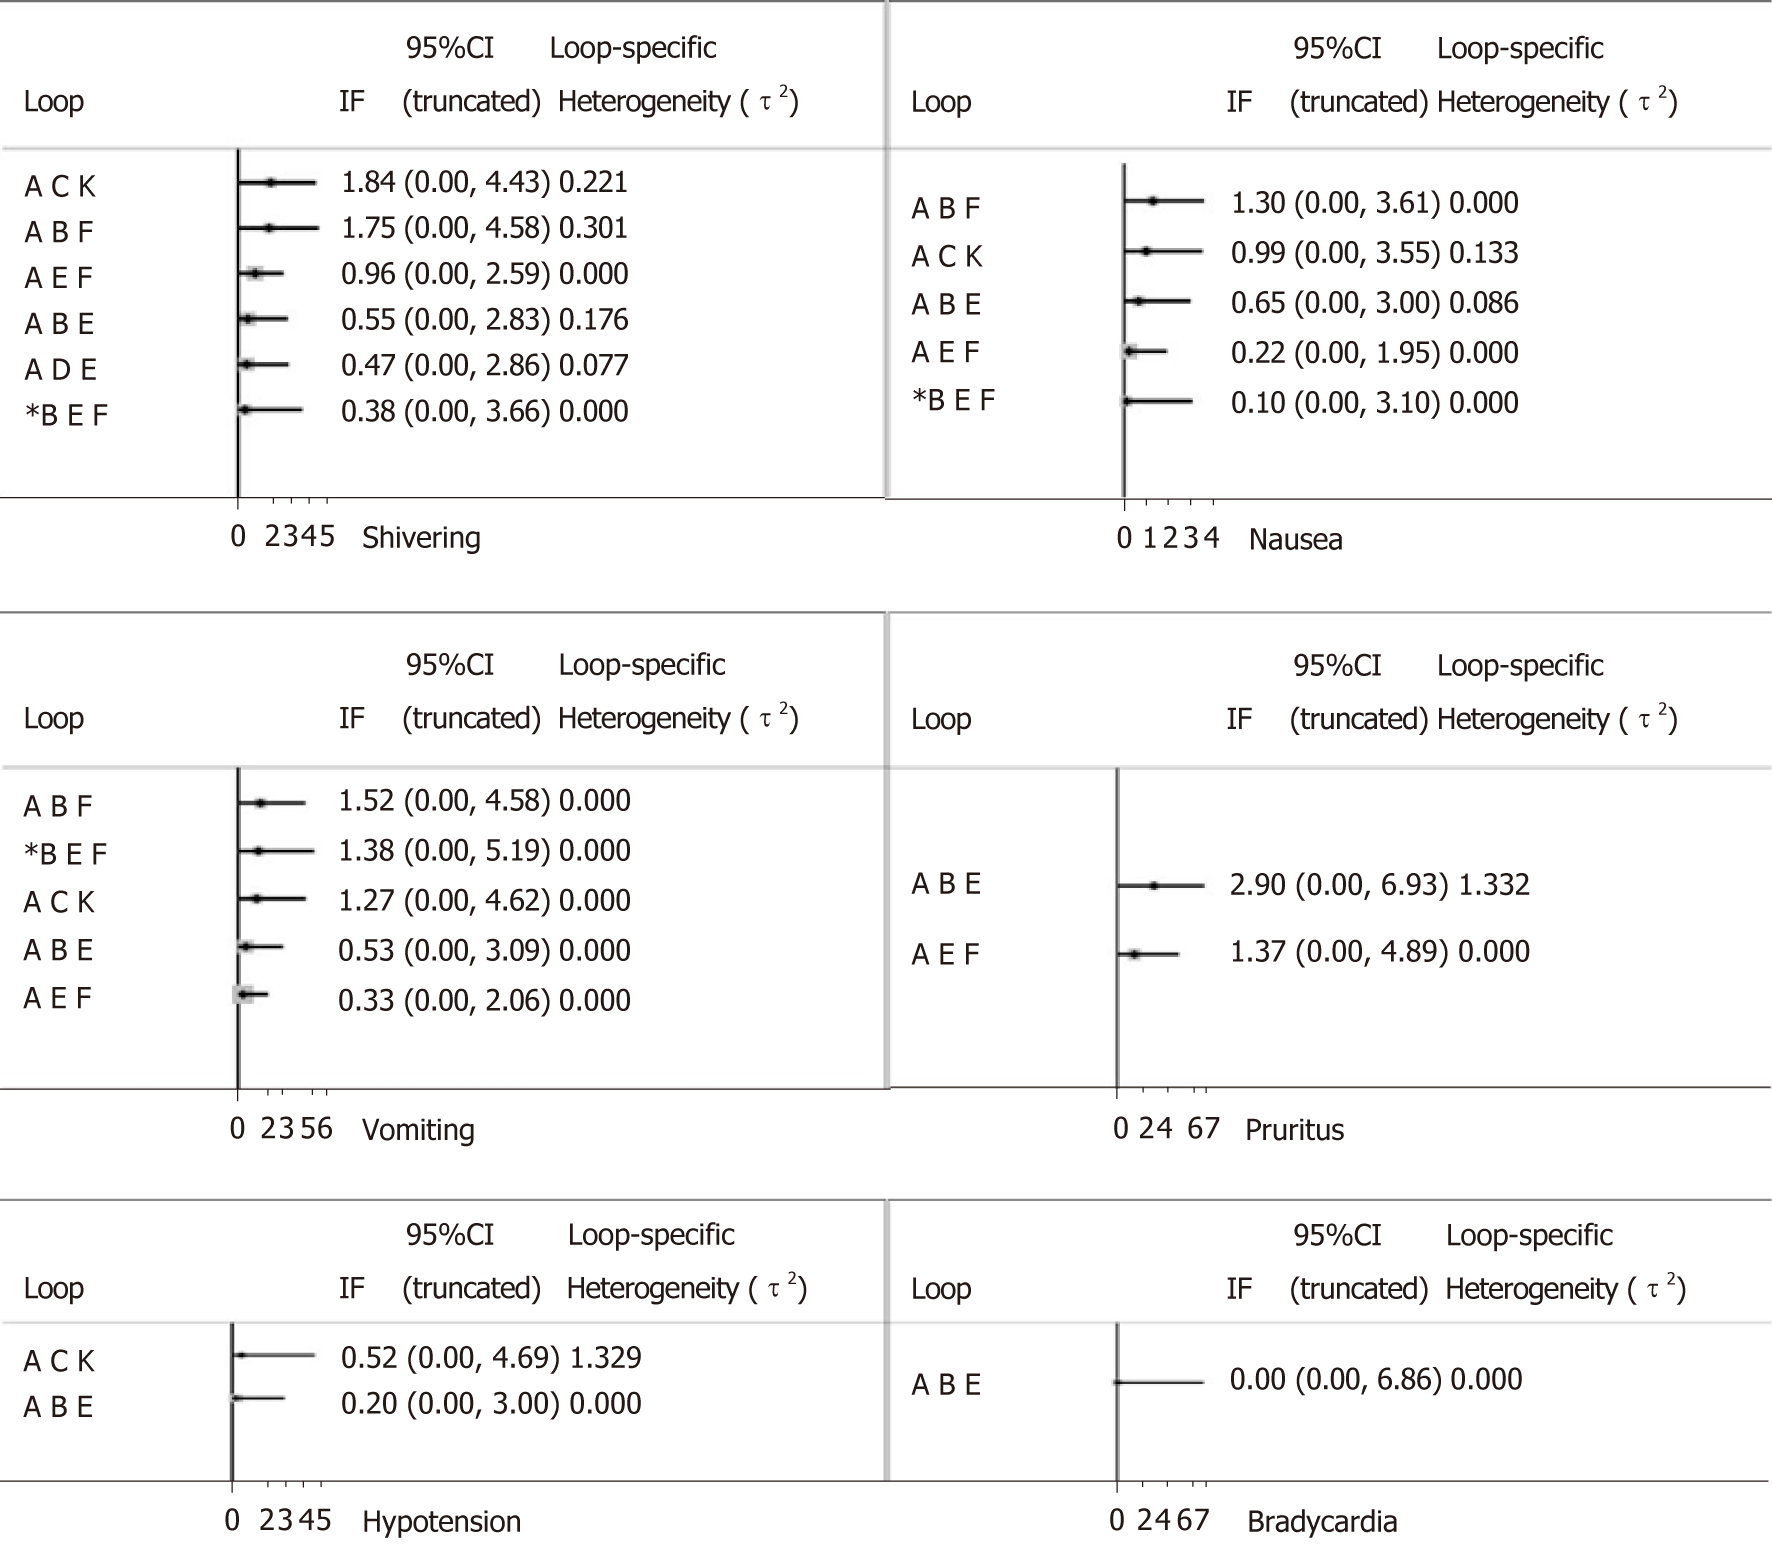
Figure 7 Inconsistency plots, node-splitting assessment.
- Citation: Zhang YW, Zhang J, Hu JQ, Wen CL, Dai SY, Yang DF, Li LF, Wu QB. Neuraxial adjuvants for prevention of perioperative shivering during cesarean section: A network meta-analysis following the PRISMA guidelines. World J Clin Cases 2019; 7(16): 2287-2301
- URL: https://www.wjgnet.com/2307-8960/full/v7/i16/2287.htm
- DOI: https://dx.doi.org/10.12998/wjcc.v7.i16.2287


