Copyright
©The Author(s) 2019.
World J Clin Cases. Aug 26, 2019; 7(16): 2189-2203
Published online Aug 26, 2019. doi: 10.12998/wjcc.v7.i16.2189
Published online Aug 26, 2019. doi: 10.12998/wjcc.v7.i16.2189
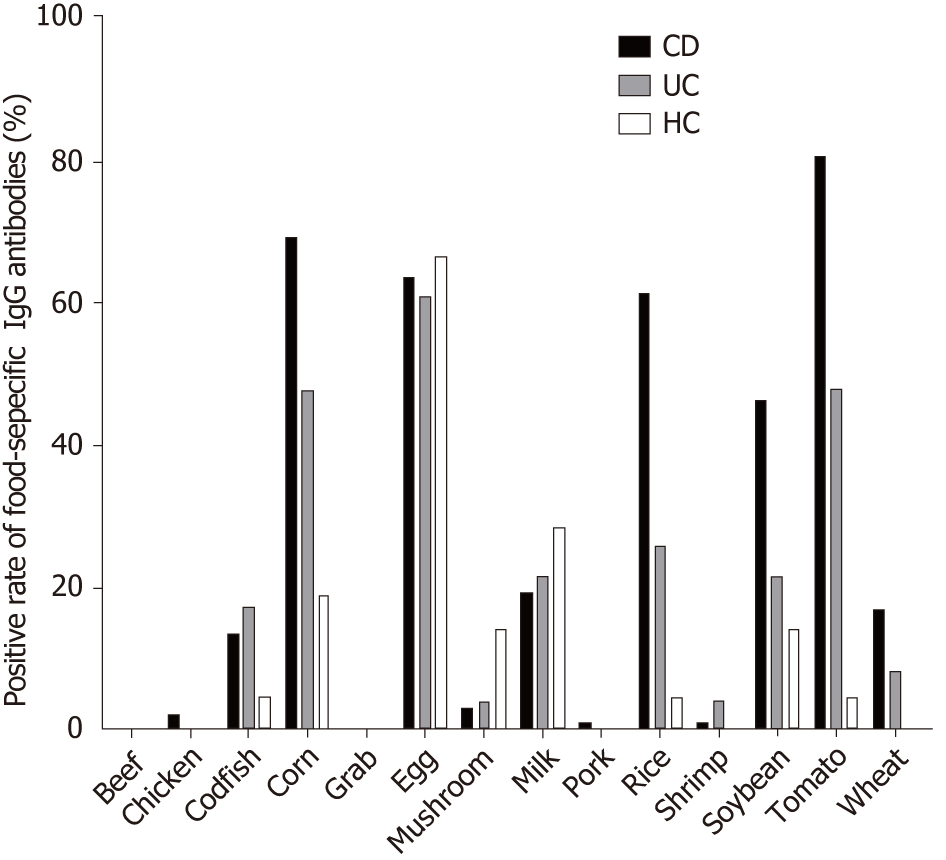
Figure 1 High sensitivity to food antigens in inflammatory bowel disease patients.
A: Positive rate of food-specific IgG antibodies in CD patients, UC patients and HCs. Statistics: Chi-squared test; B: The number of IgG-positive food items in CD patients, UC patients and HCs; C: Comparison of the total serum IgG levels in CD patients, UC patients and HCs. Statistics: ANOVA), aP < 0.05, bP < 0.01, cP < 0.001. UC: Ulcerative colitis; CD: Crohn’s disease; HCs: Healthy controls; ANOVA: One-way analysis of variance.
Figure 2 Distribution of positive IgG to food allergens in CD patients, UC patients and HCs.
UC: Ulcerative colitis; CD: Crohn’s disease; HCs: Healthy controls.
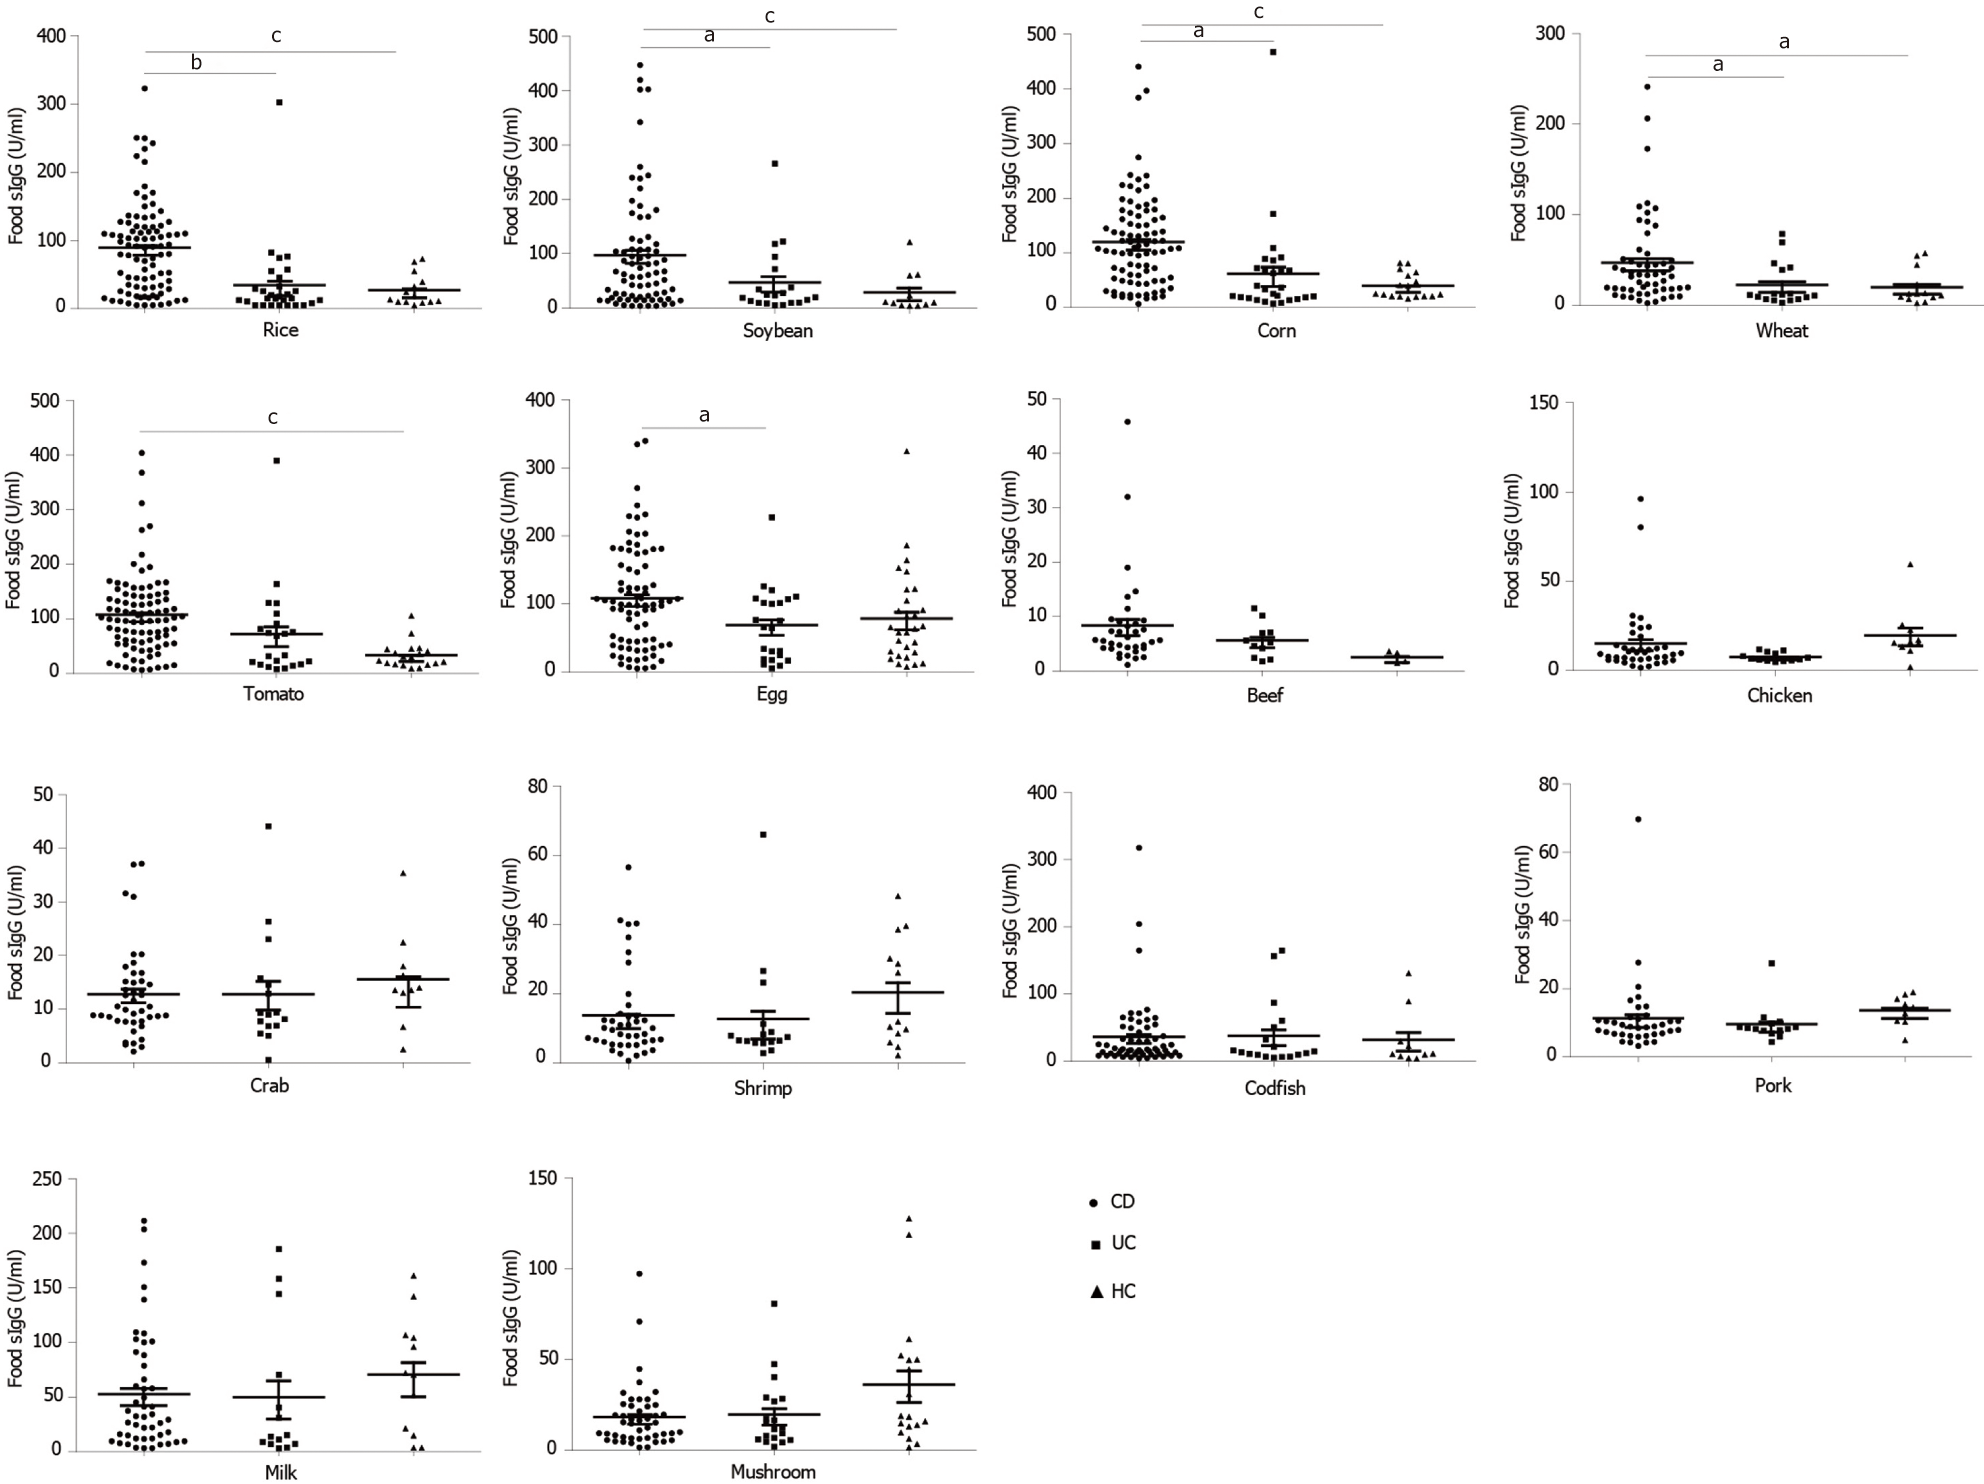
Figure 3 The levels of food-specific IgG against 14 common daily foods in CD patients, UC patients and HCs.
Statistics: ANOVA, aP < 0.05, bP < 0.01, cP < 0.001. UC: Ulcerative colitis; CD: Crohn’s disease; HCs: Healthy controls; ANOVA: One-way analysis of variance.
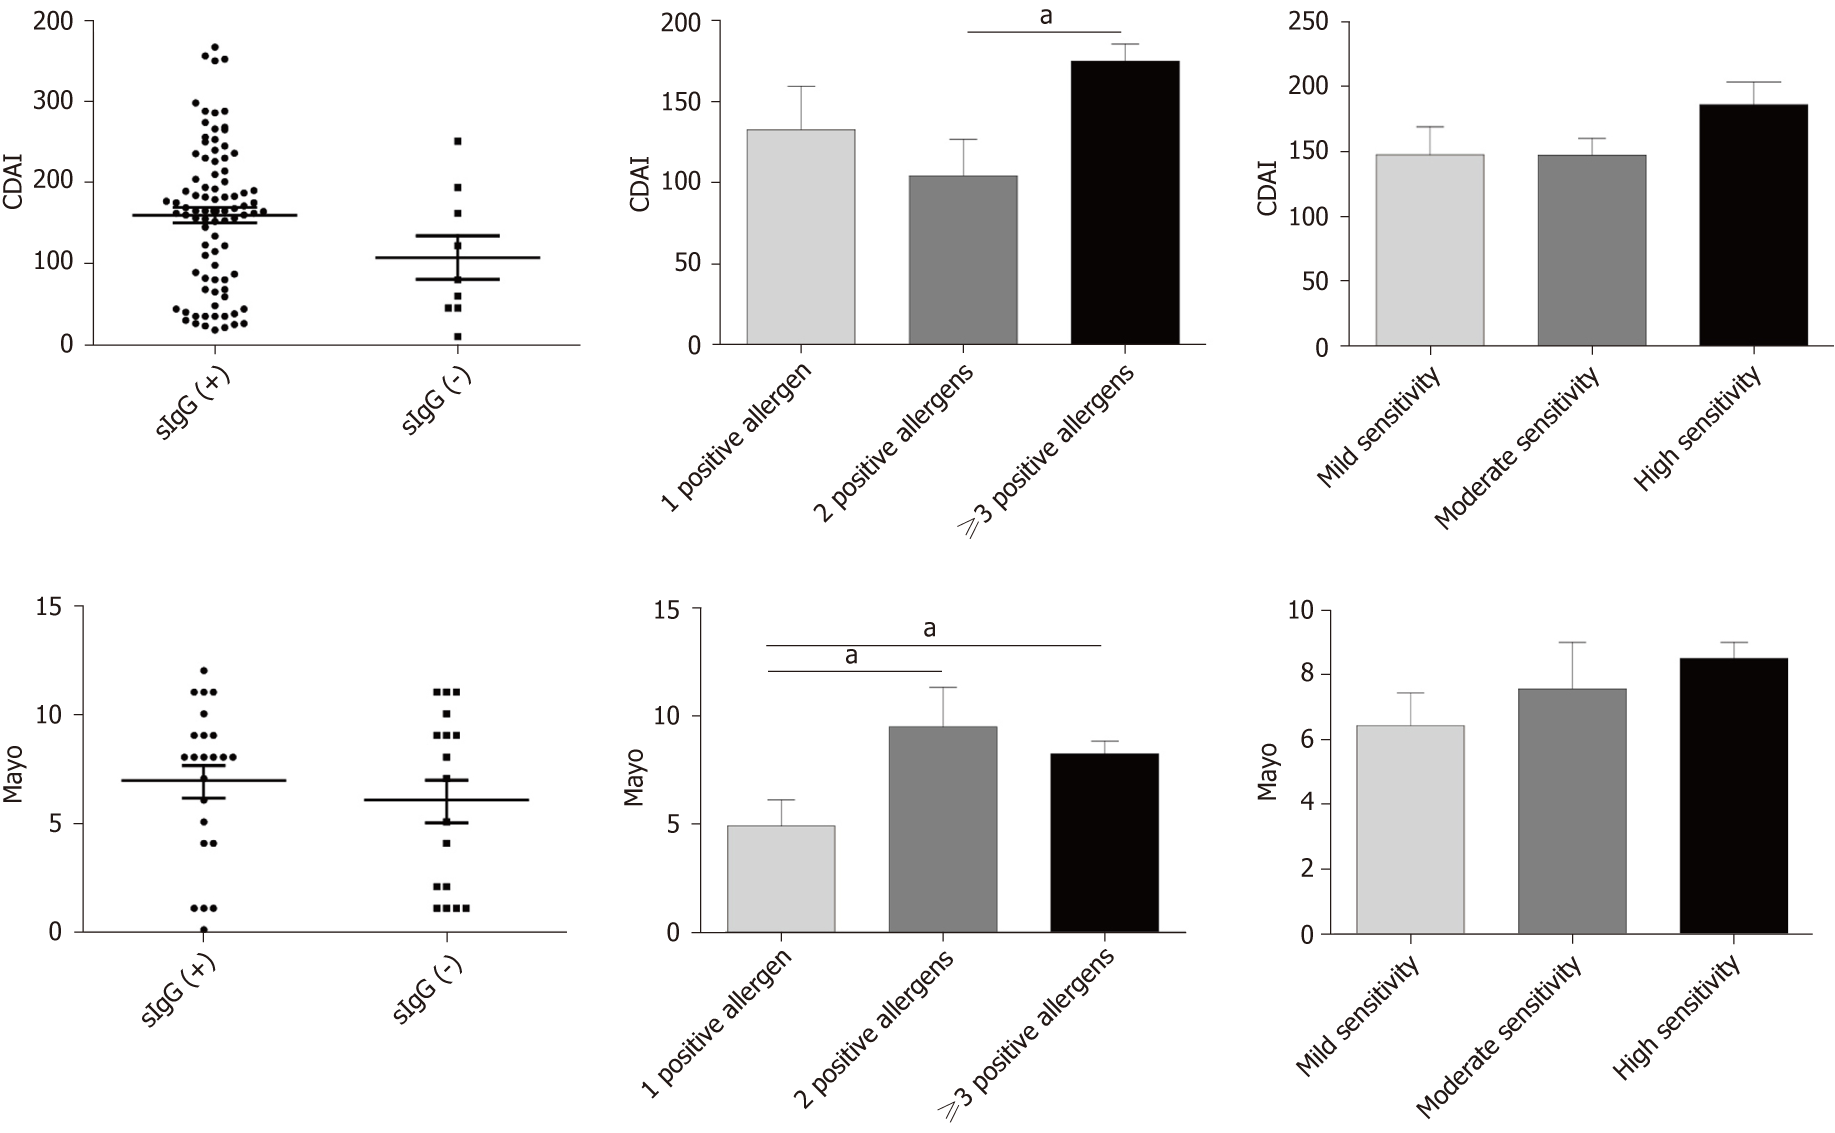
Figure 4 Association between food-specific IgG antibodies and disease activity.
Data are shown as mean ± SD by ANOVA, aP < 0.05. ; ANOVA: One-way analysis of variance.
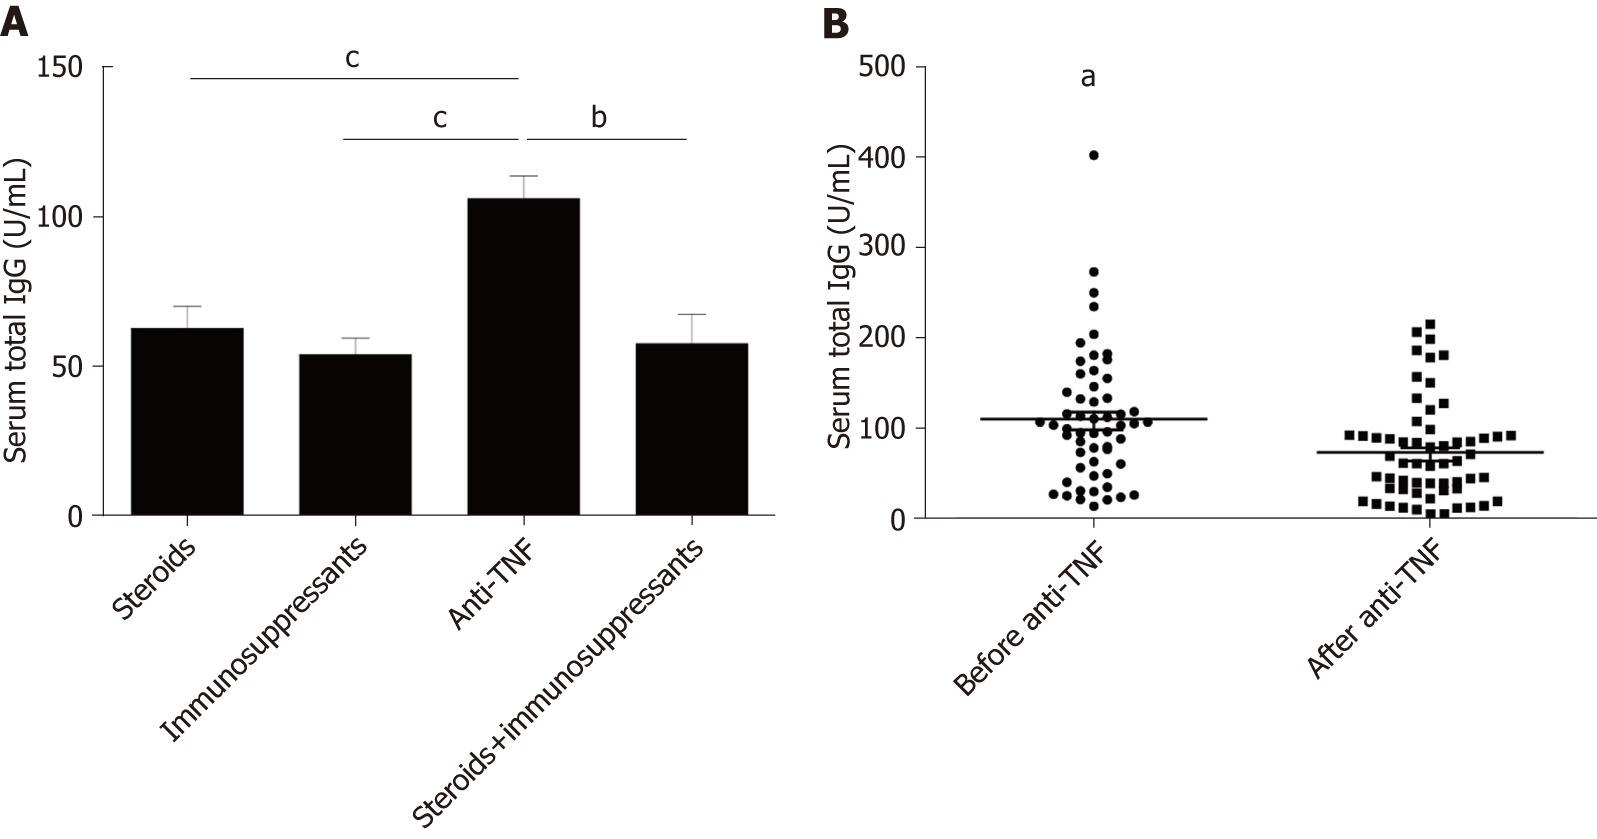
Figure 5 Serum food-specific IgG concentrations in patients treated with different medications and comparison of food-specific IgGs for inflammatory bowel disease patients before and after Infliximab treatment.
A: Serum food-specific IgG concentrations in patients treated with different medications. Statistics: ANOVA; B: Comparison of Food-specific IgGs for inflammatory bowel disease patients before and after Infliximab treatment. Statistics: paired-samples t test, aP < 0.05, bP < 0.01, cP < 0.001. ANOVA: One-way analysis of variance.
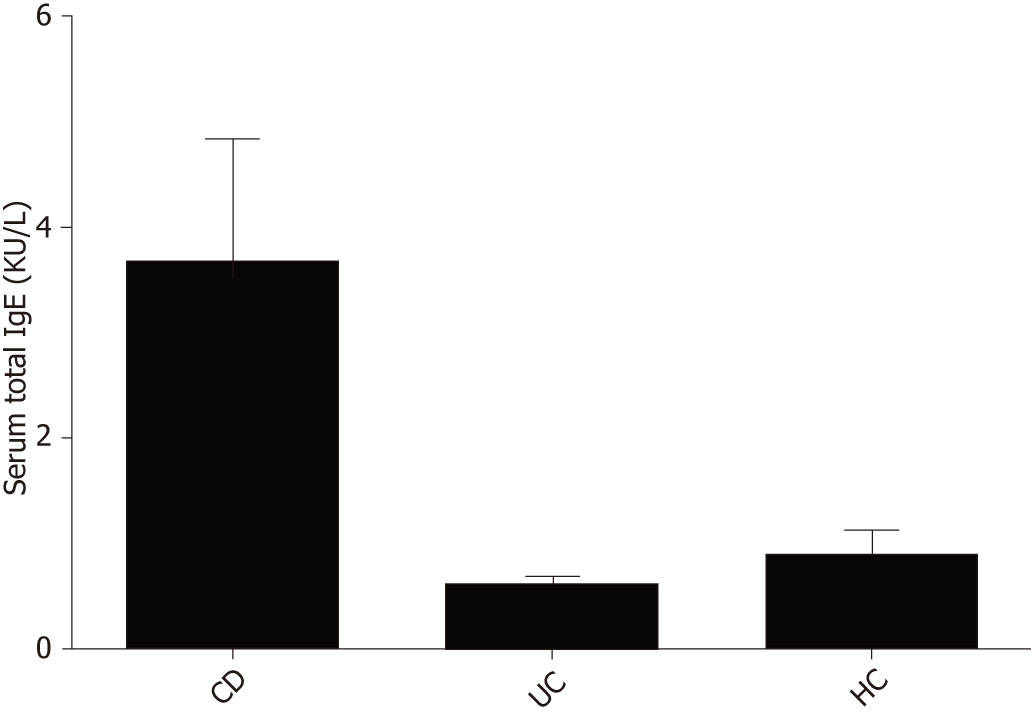
Figure 6 Comparison of total serum IgE levels between CD patients, UC patients and HCs.
Statistics: ANOVA. UC: Ulcerative colitis; CD: Crohn’s disease; HCs: Healthy controls; ANOVA: One-way analysis of variance.
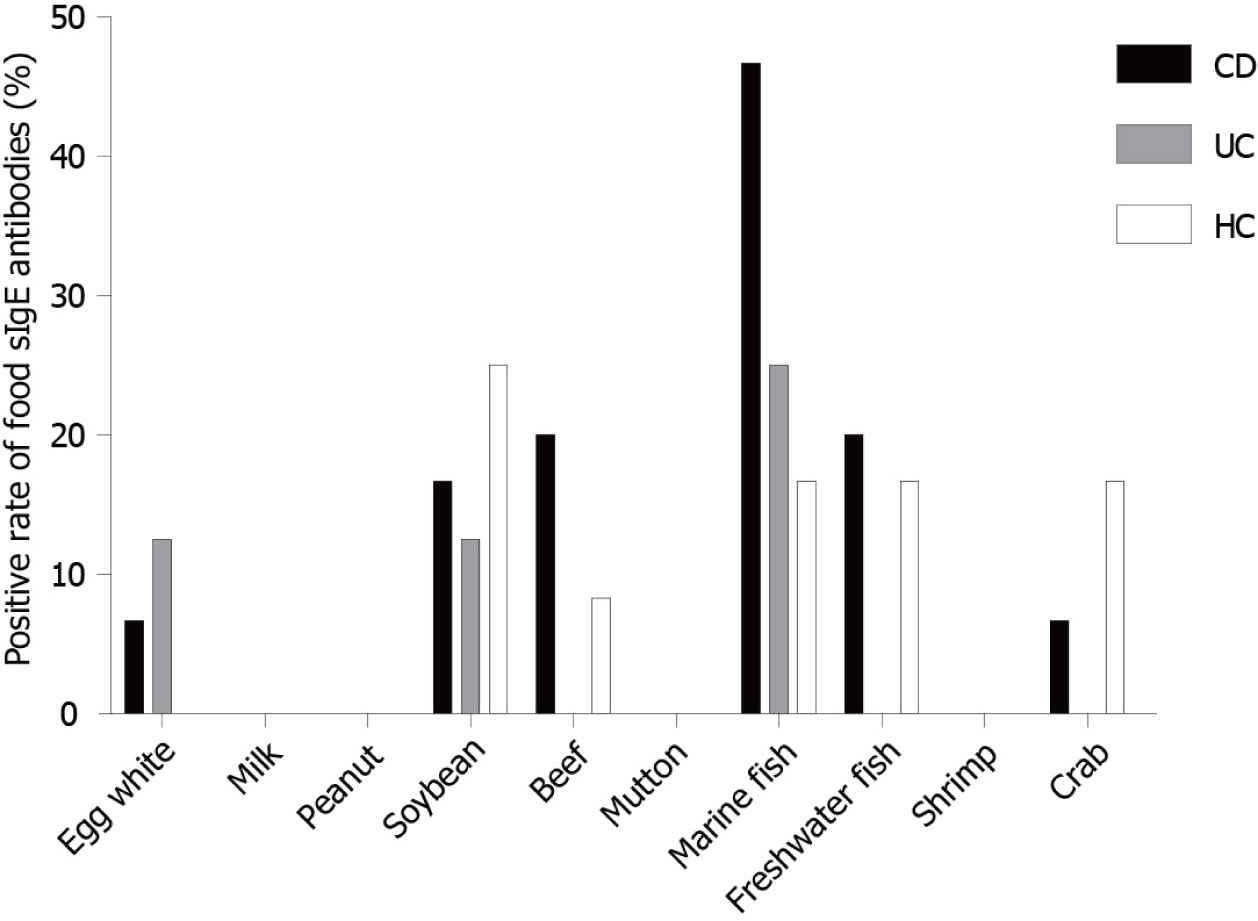
Figure 7 Distribution of positive IgE to food allergens in CD patients, UC patients and HCs.
UC: Ulcerative colitis; CD: Crohn’s disease; HCs: Healthy controls.
- Citation: Wang HY, Li Y, Li JJ, Jiao CH, Zhao XJ, Li XT, Lu MJ, Mao XQ, Zhang HJ. Serological investigation of IgG and IgE antibodies against food antigens in patients with inflammatory bowel disease. World J Clin Cases 2019; 7(16): 2189-2203
- URL: https://www.wjgnet.com/2307-8960/full/v7/i16/2189.htm
- DOI: https://dx.doi.org/10.12998/wjcc.v7.i16.2189


