Copyright
©The Author(s) 2019.
World J Clin Cases. Aug 6, 2019; 7(15): 2081-2086
Published online Aug 6, 2019. doi: 10.12998/wjcc.v7.i15.2081
Published online Aug 6, 2019. doi: 10.12998/wjcc.v7.i15.2081
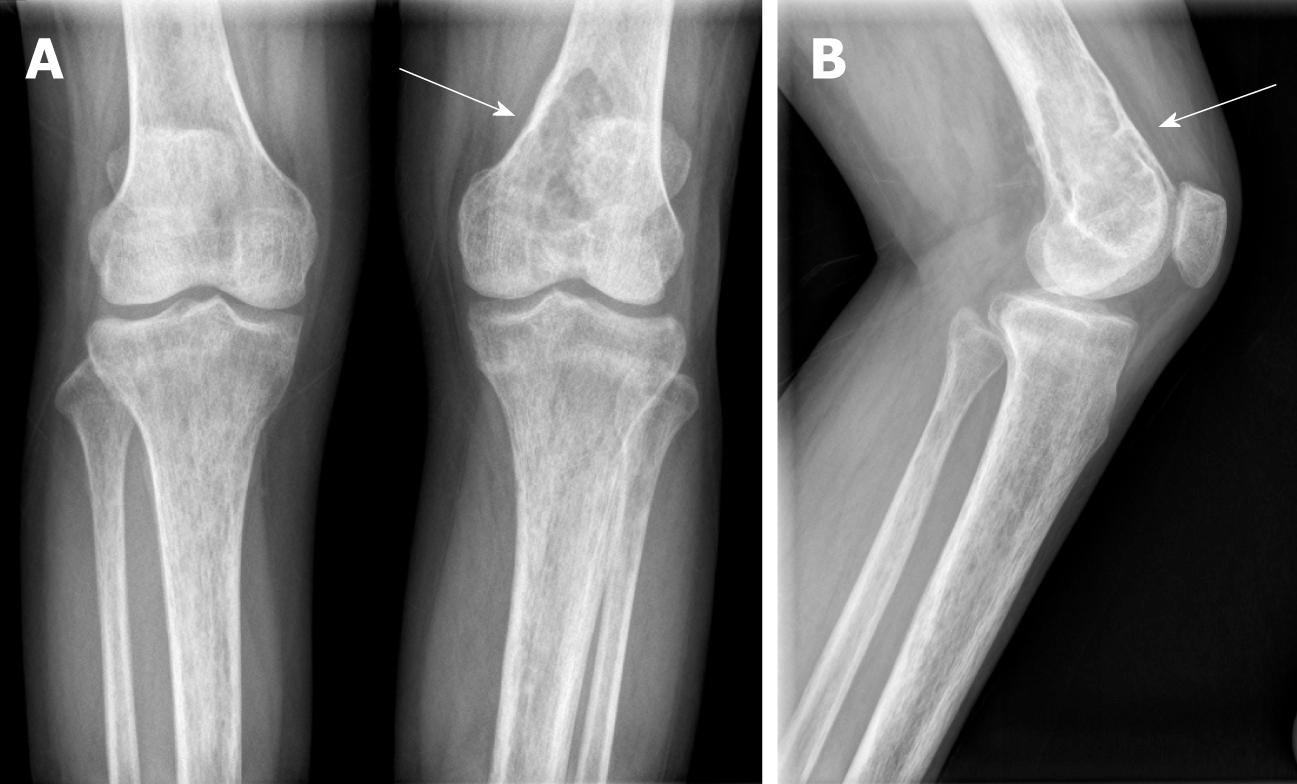
Figure 1 X-rays of knee joints.
A: Anteroposterior view; B: Lateral view. Bone trabeculae of both knees are sparse, bone density is widely reduced, and an oval osteolytic area is shown in the inferior medullary cavity of the left femur (arrow).
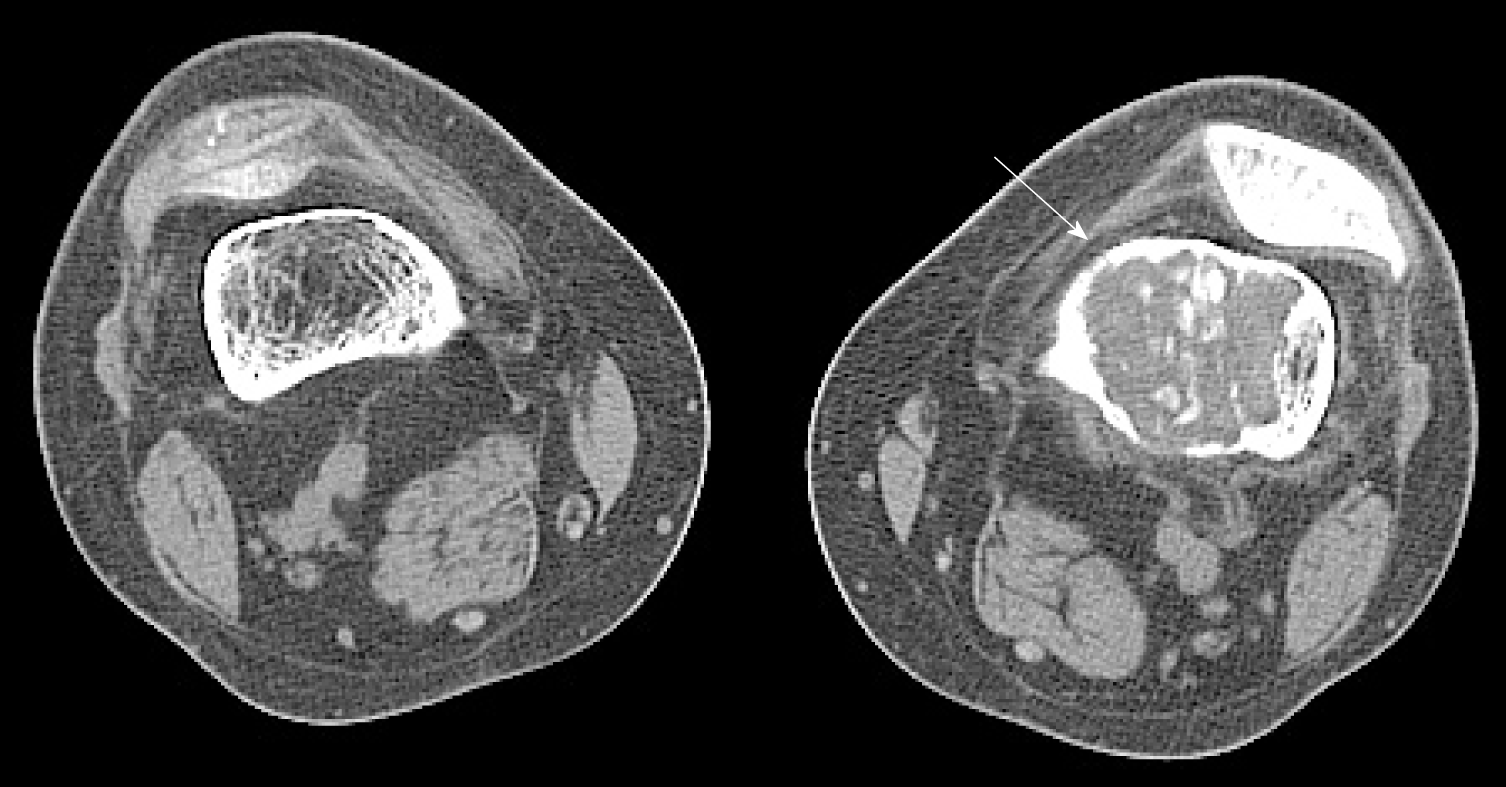
Figure 2 Computed tomography scans of knee joints.
Mixed density shadows are shown in the intramedullary cavity of the left femur (arrow). Computed tomography values are 45-70 HU.
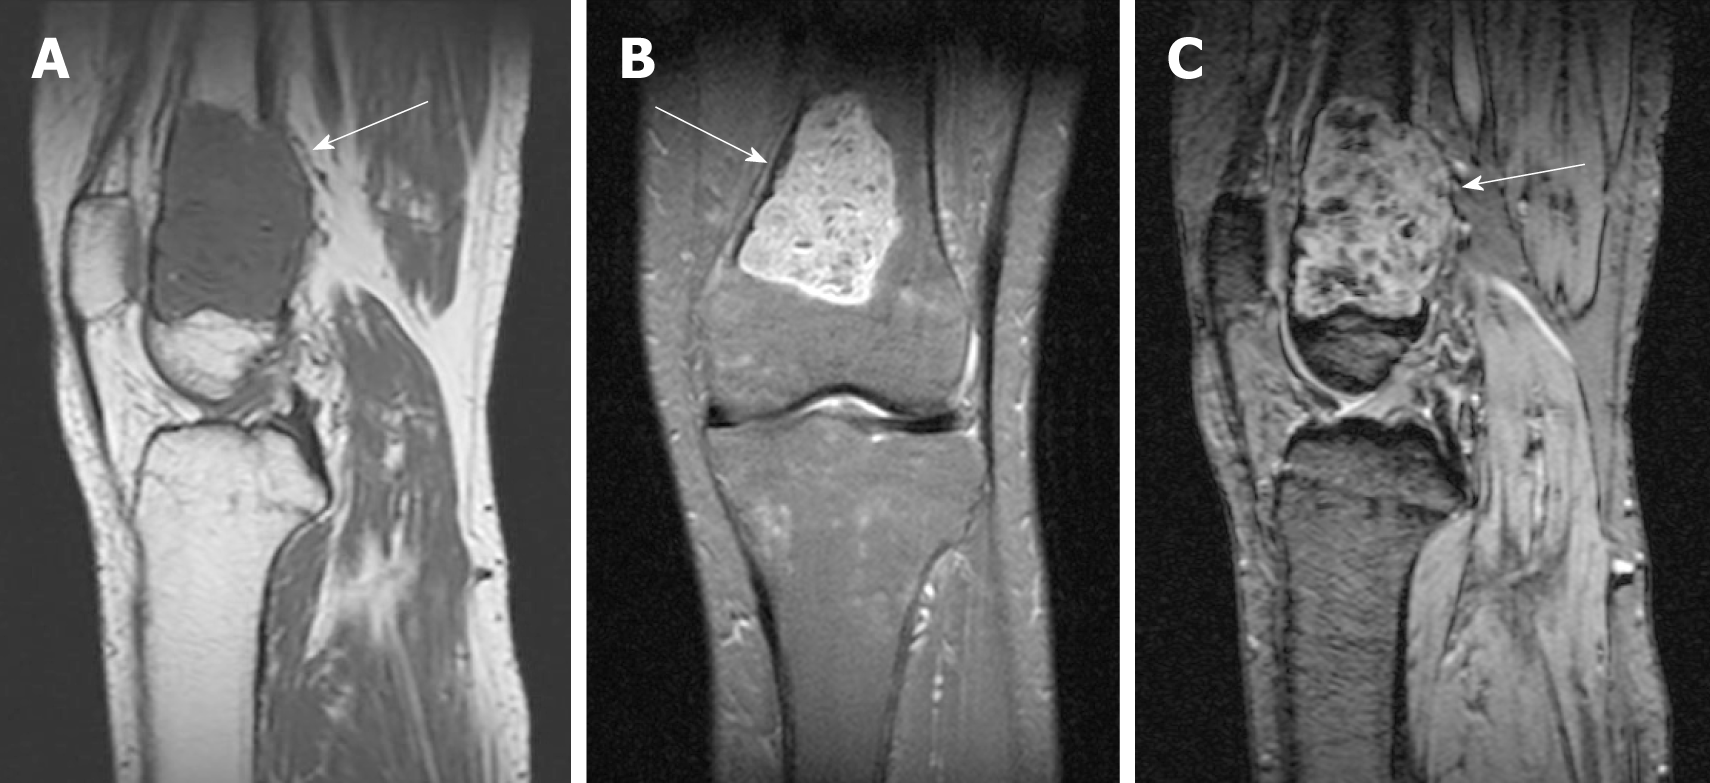
Figure 3 Magnetic resonance imaging of the left knee.
A: T1WI sagittal view; B: PDWI coronal view; C: PDWI sagittal view. T1 hypointense (arrow, A) and T2 high-low mixed signal (arrows, B and C) are shown.
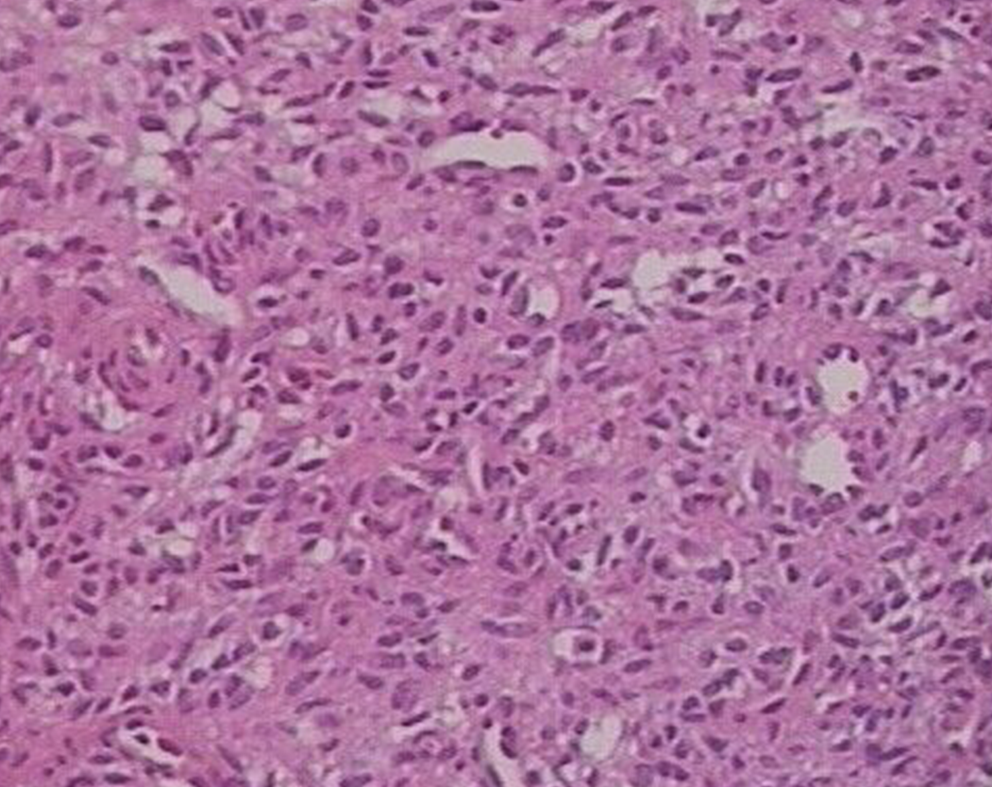
Figure 4 Histology of the resected tumor.
Note the presence of short spindle cells and a large number of blood vessels. Some spindle cells grew around blood vessels. HE staining, 100×.
- Citation: Tang D, Wang XM, Zhang YS, Mi XX. Oncogenic osteomalacia caused by a phosphaturic mesenchymal tumor of the femur: A case report. World J Clin Cases 2019; 7(15): 2081-2086
- URL: https://www.wjgnet.com/2307-8960/full/v7/i15/2081.htm
- DOI: https://dx.doi.org/10.12998/wjcc.v7.i15.2081


