Copyright
©The Author(s) 2019.
World J Clin Cases. Jul 6, 2019; 7(13): 1677-1685
Published online Jul 6, 2019. doi: 10.12998/wjcc.v7.i13.1677
Published online Jul 6, 2019. doi: 10.12998/wjcc.v7.i13.1677
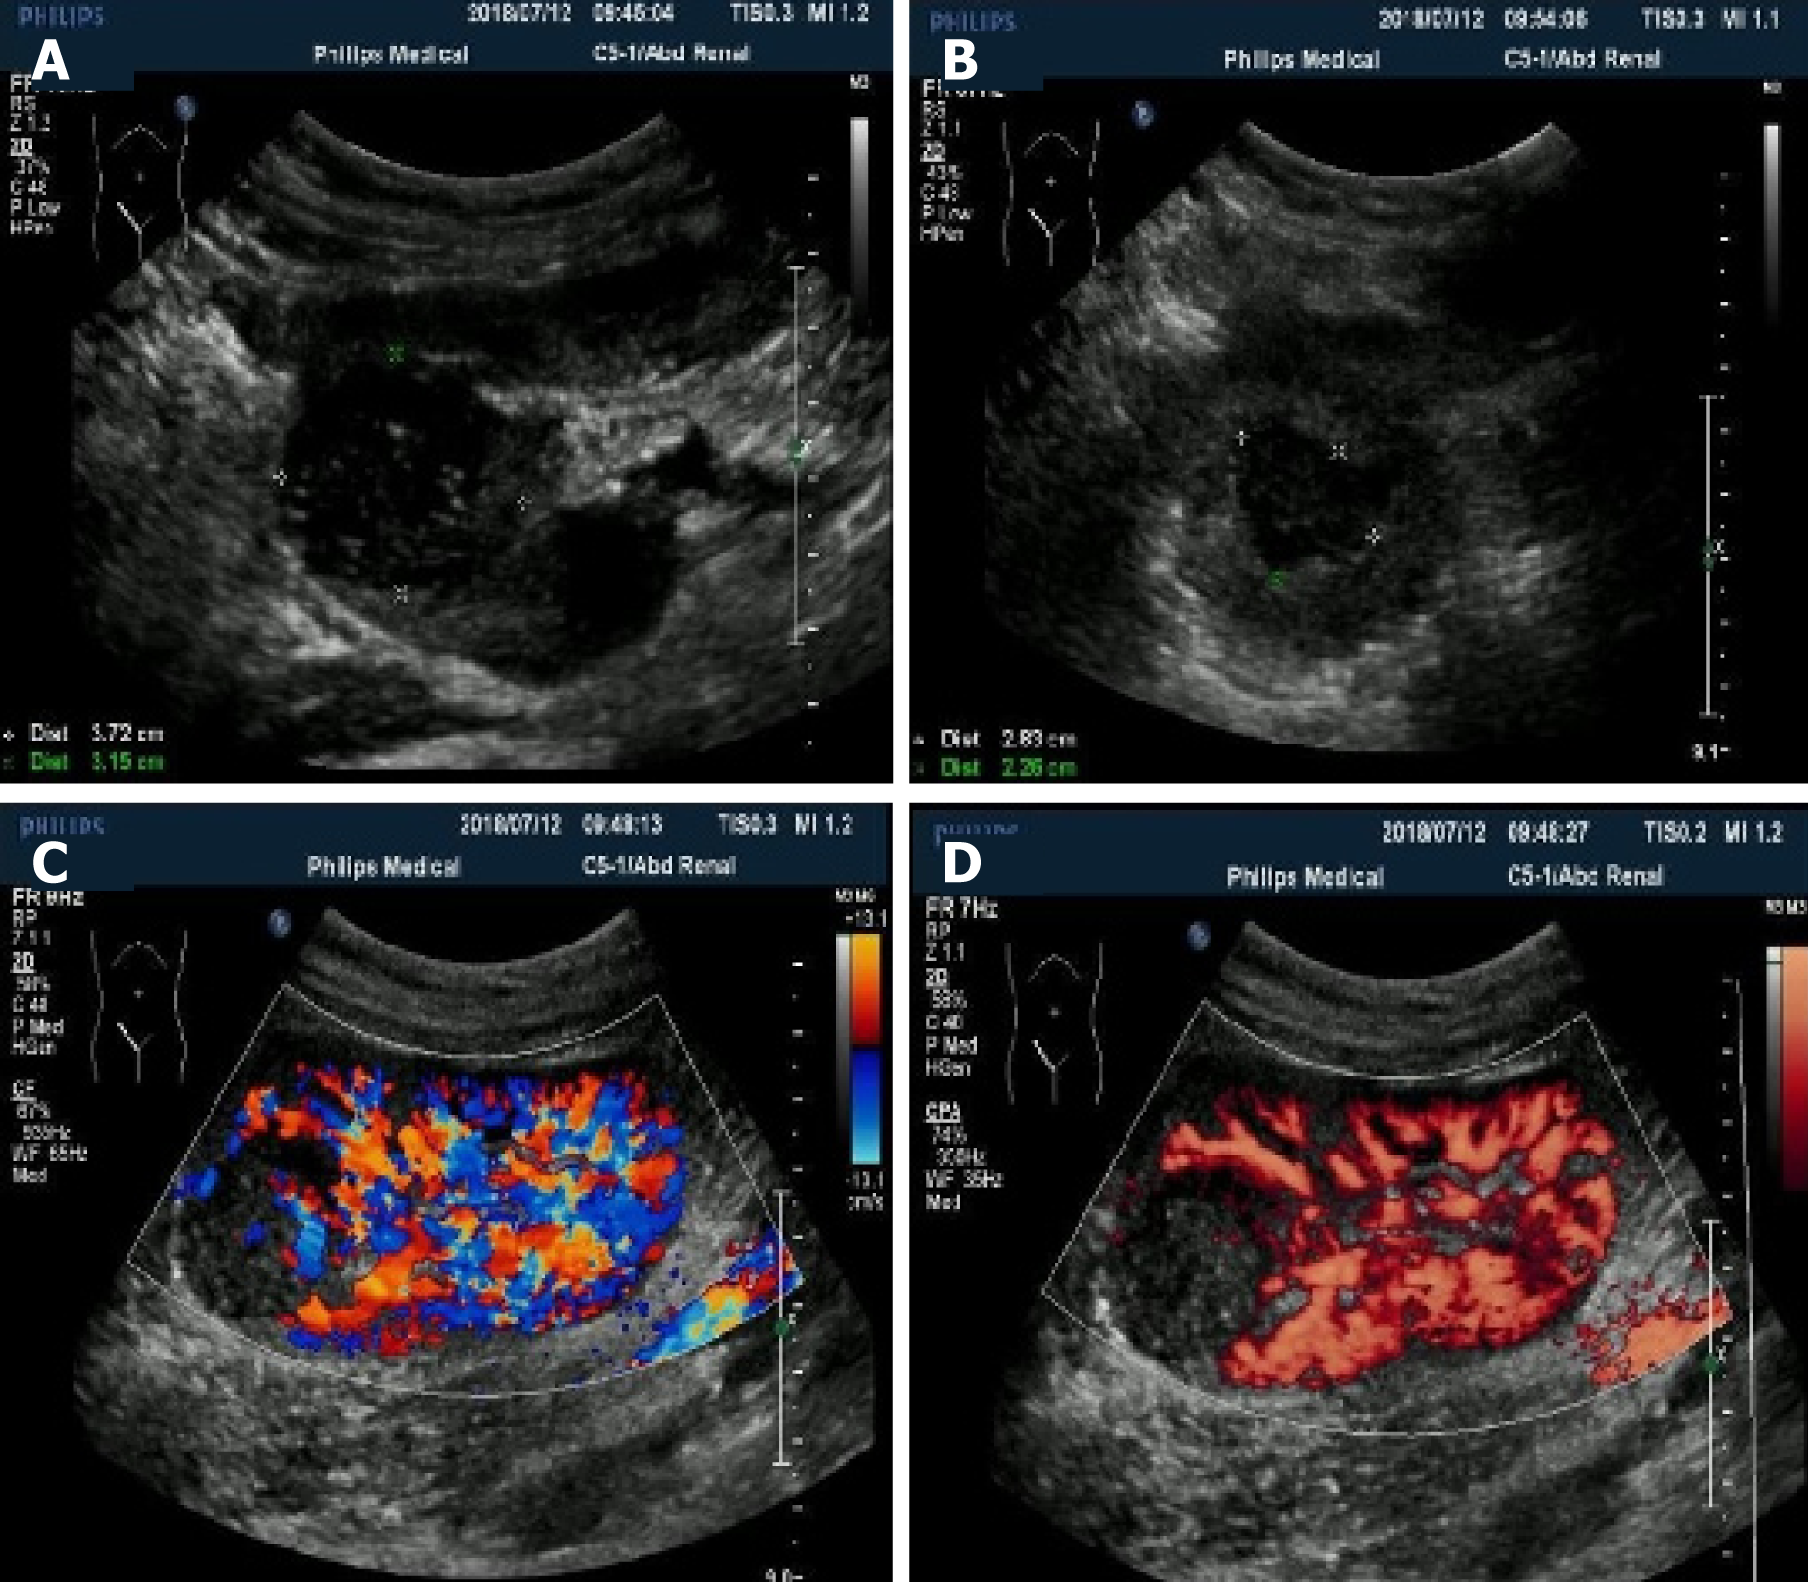
Figure 1 Ultrasonography manifestation of the neoplasms.
A and B: Conventional ultrasound showed well-defined solid hypo-echo neoplasms in the renal allograft; C and D: Color Doppler flow imaging and power Doppler imaging revealed punctiform blood flow signals inside the neoplasms.
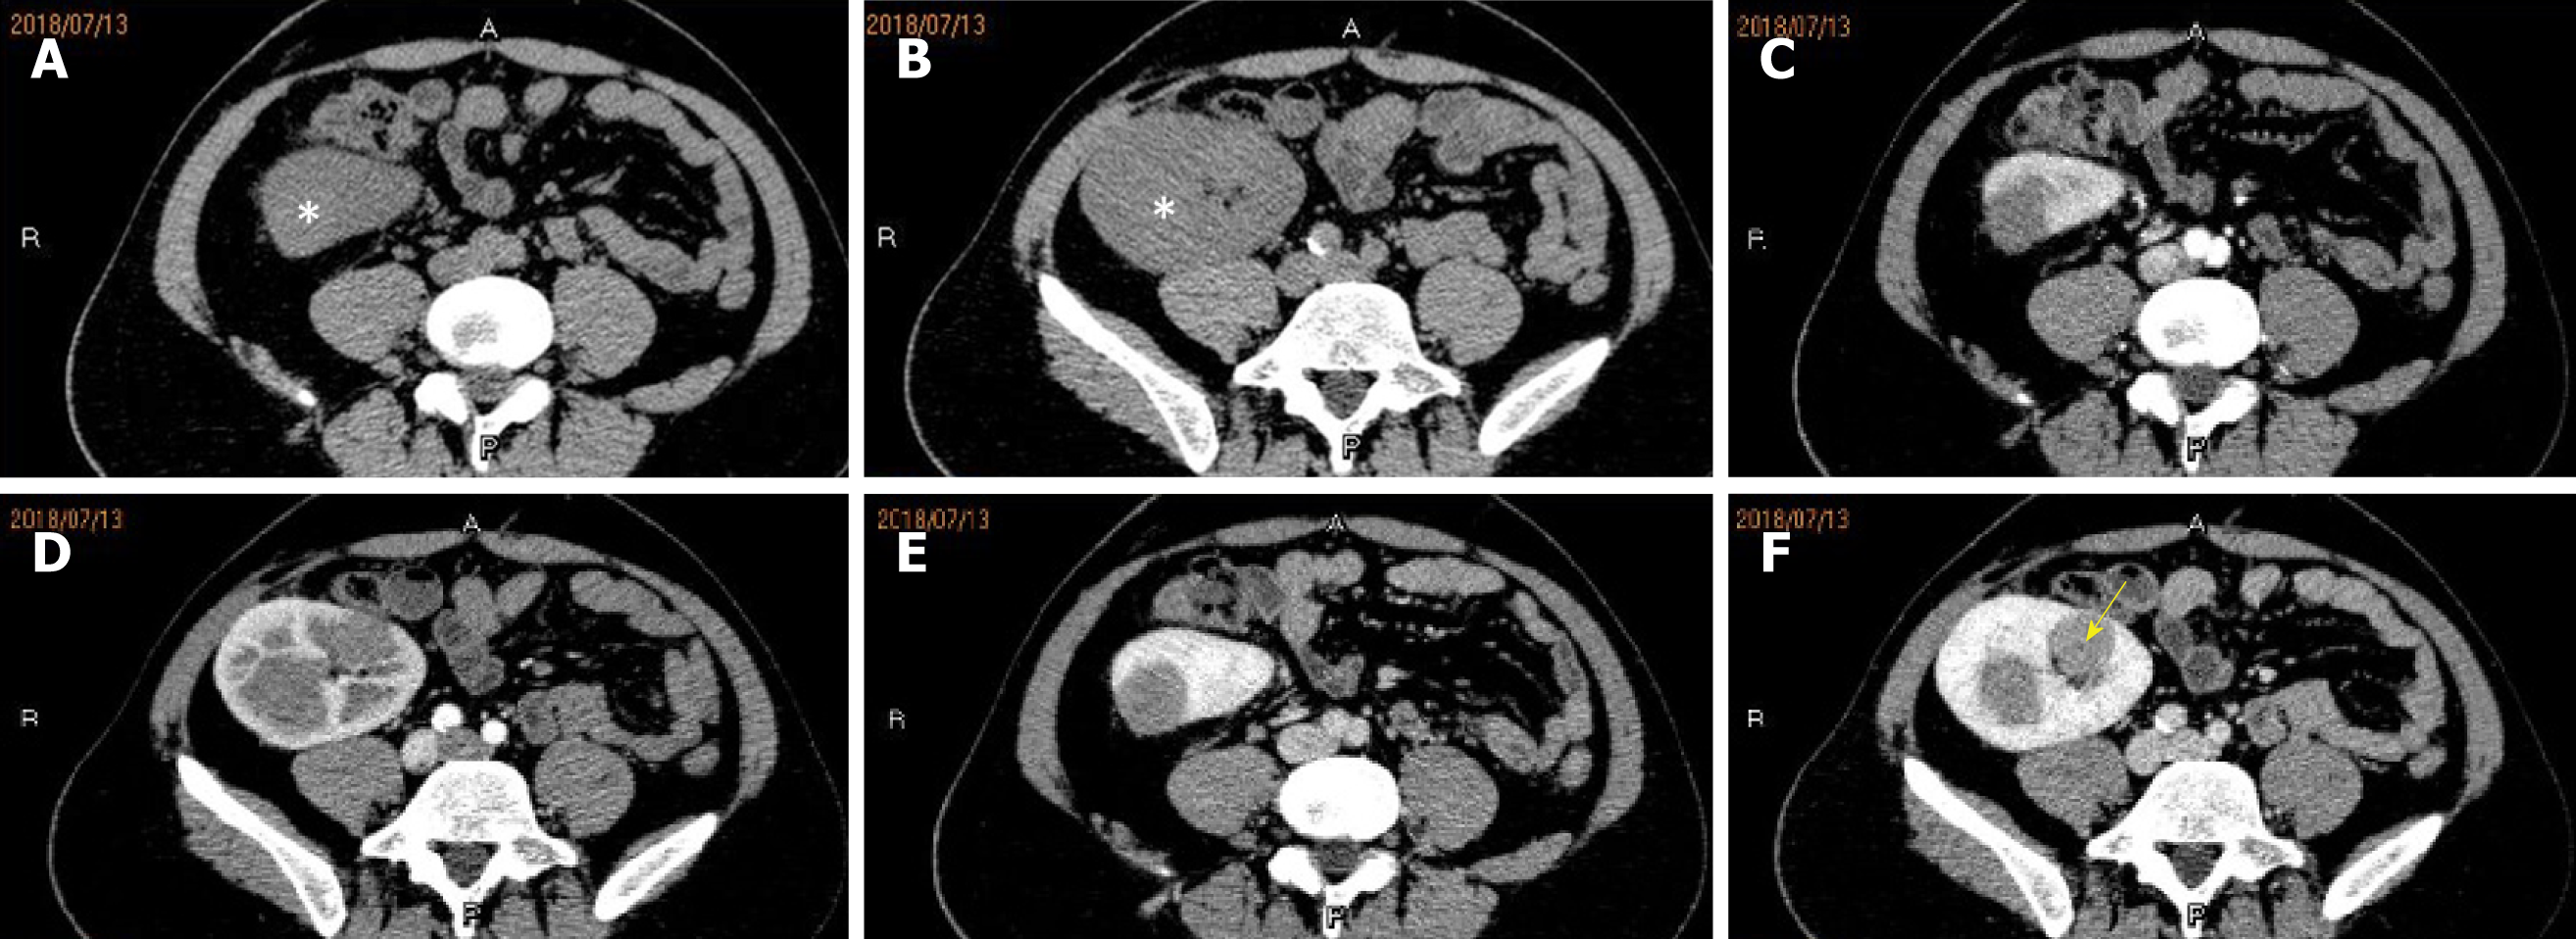
Figure 2 Contrast-enhanced computed tomography showed multiple neoplasms inside the renal allograft.
A and B: Non-enhancing images showing slightly hyper-density neoplasms without distinct margins; C-F: Enhanced multiphase computed tomography (CT) images revealing slow, relatively homogeneous enhancement inside the neoplasms. Enhanced CT venous-phase image showing a small spotty non-enhanced focus (yellow arrow).
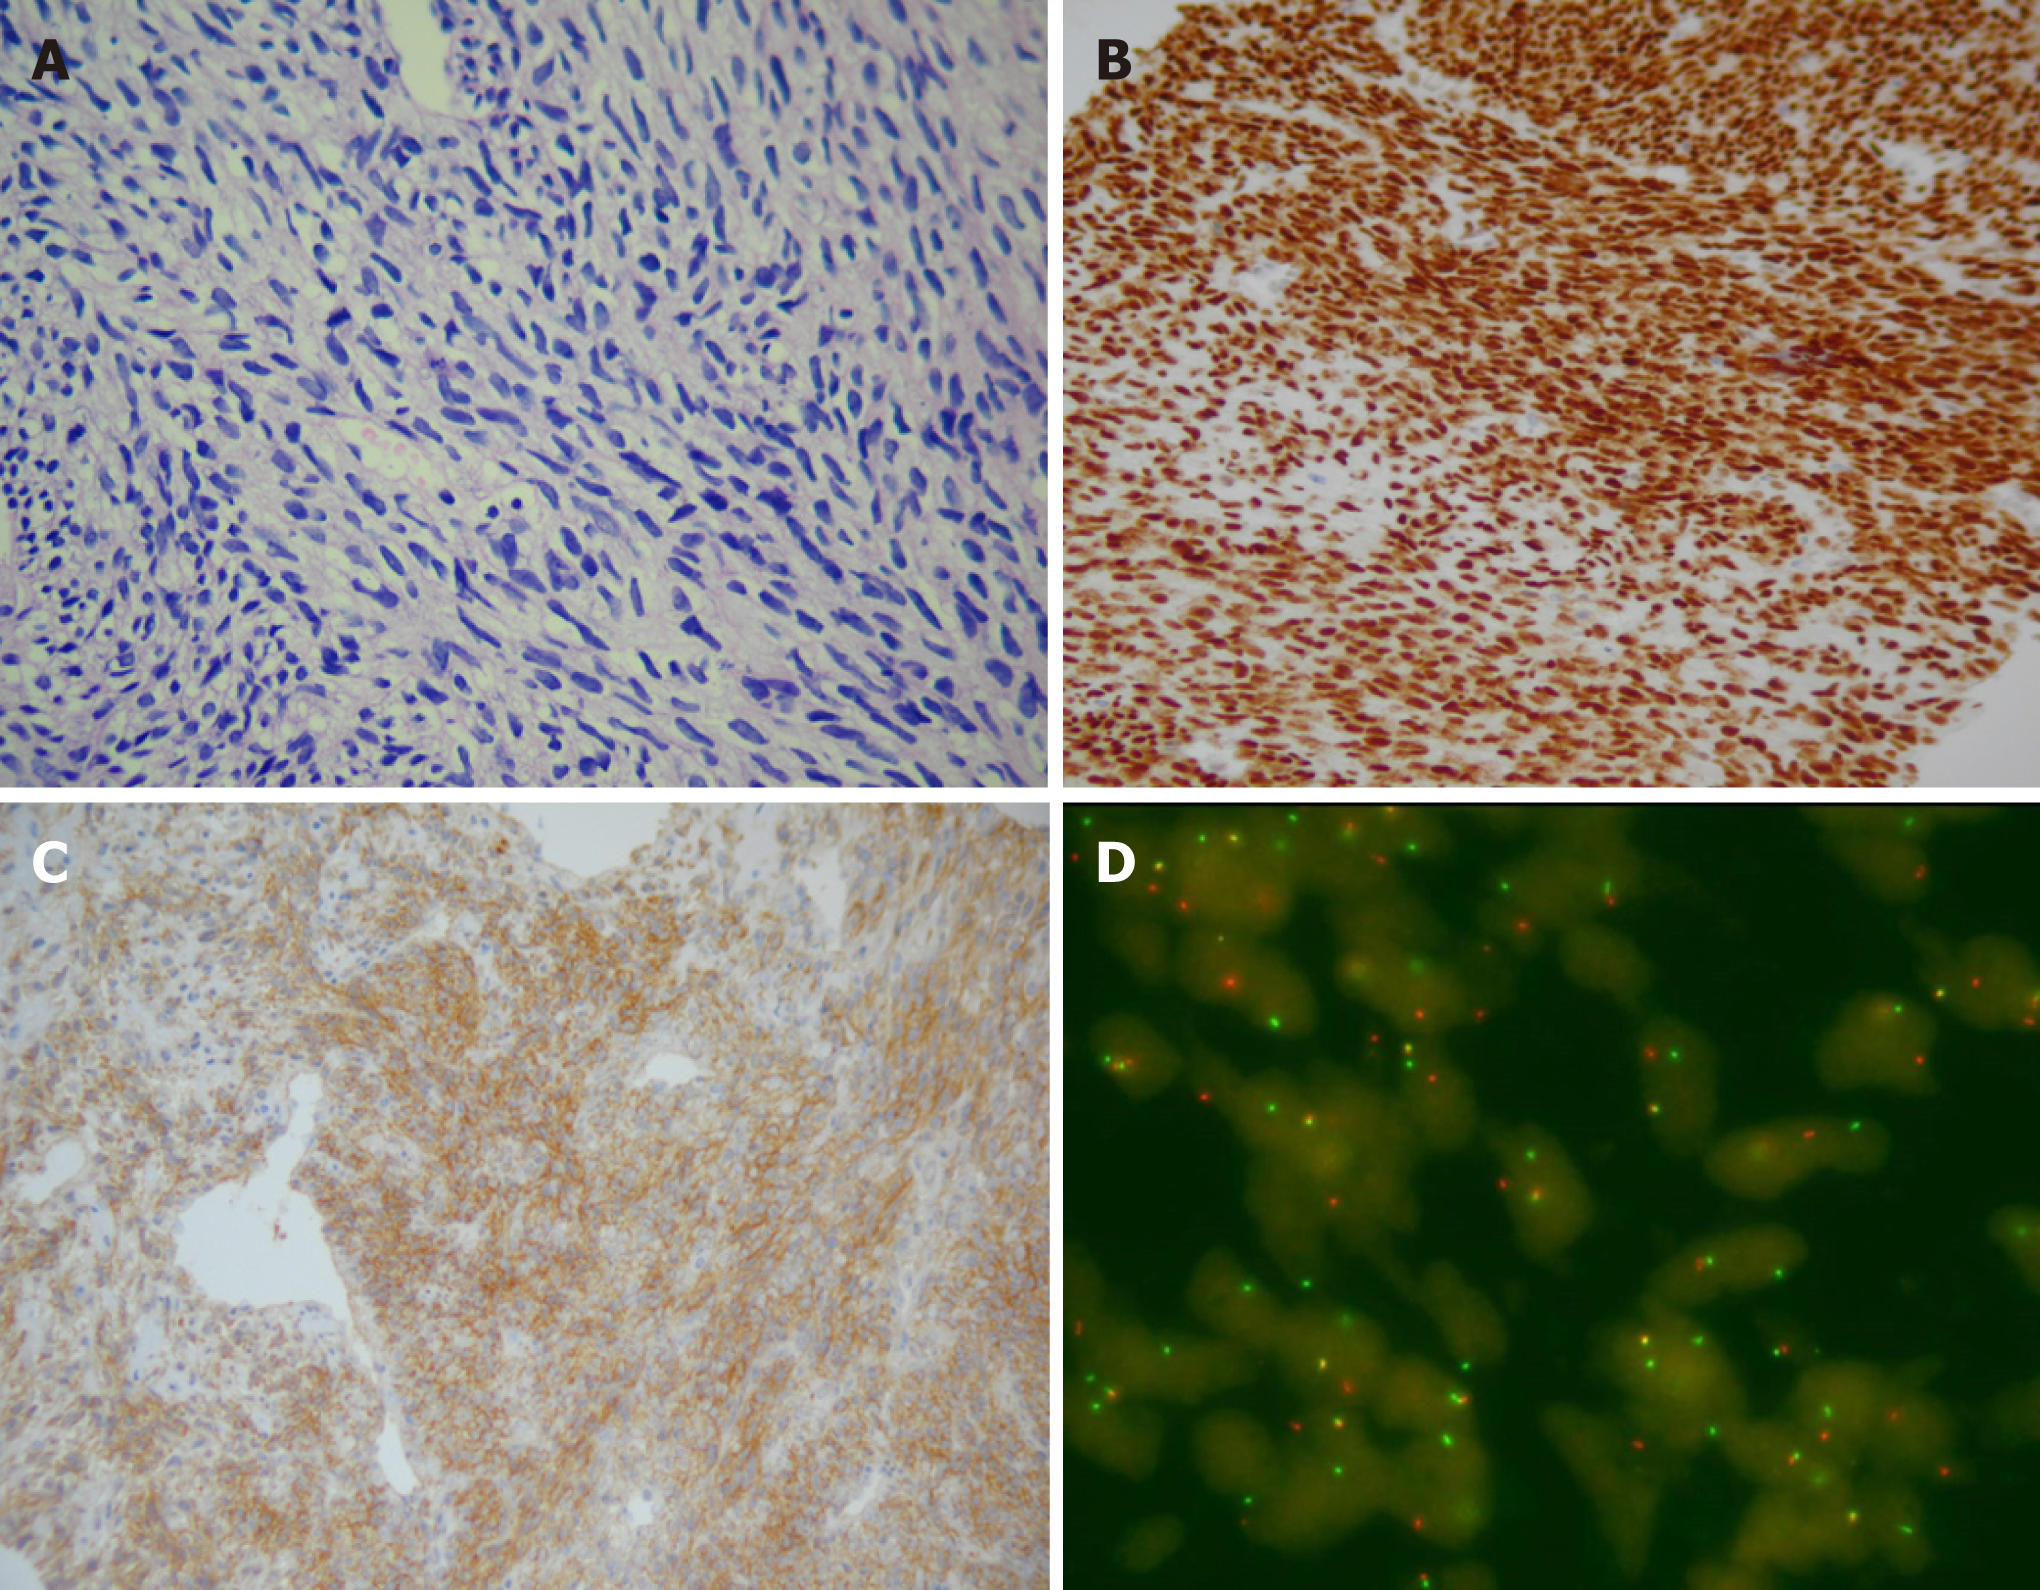
Figure 3 Pathological results of the neoplasms.
A: HE-stained image (200×) showing monotonous neoplasms formed by spindle-shaped cells; B and C: Immunohistochemical analysis demonstrated that the neoplasms expressed TLE (B, 100×) and vimentin CD99 (C, 200×); D: Genetic analysis confirmed the presence of SYT-SSX translocation using a SYT dual color break apart probe-based FISH test. About 50% of the tumor cells had abnormal yellow, red, and green break signals.
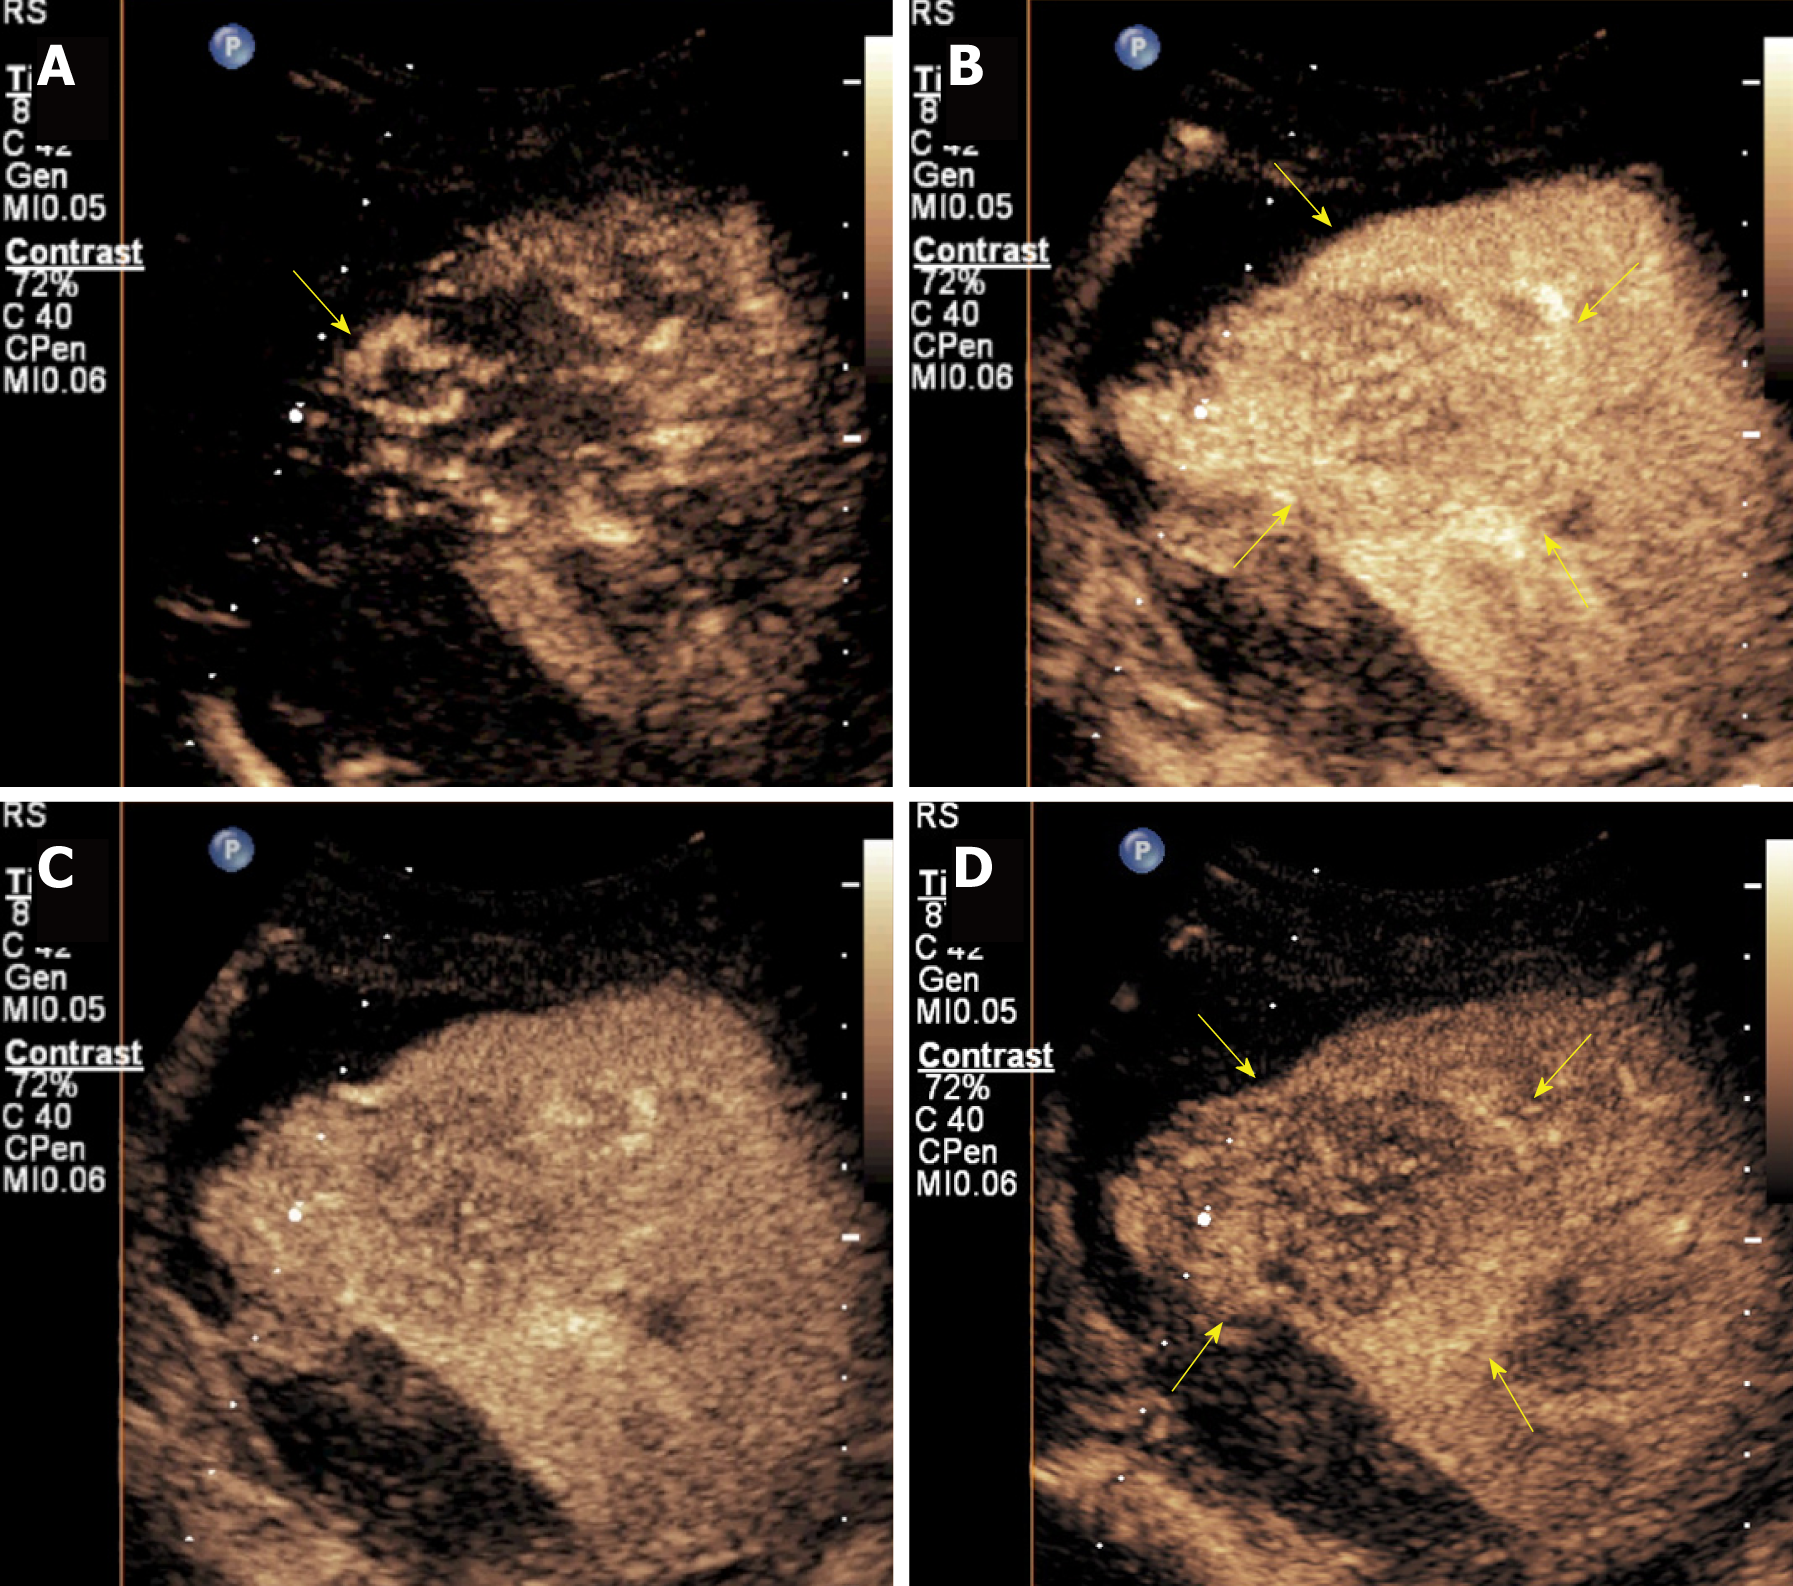
Figure 4 Contrast-enhanced ultrasound wash-in and wash-out characteristics of the neoplasms.
A: The cortical-phase contrast-enhanced ultrasound image showing twisted, branchlike, and tortuous vessel perfusion (yellow arrow); B-D: The neoplasms manifested as heterogeneous, slight hyper-enhancement consistently, and no clear earlier wash-out than the peripheral parenchyma could be seen. Pseudo-capsule surrounding the neoplasm could be seen as a slightly higher enhancement ring around the mass compared with normal peripheral parenchyma (yellow arrows).
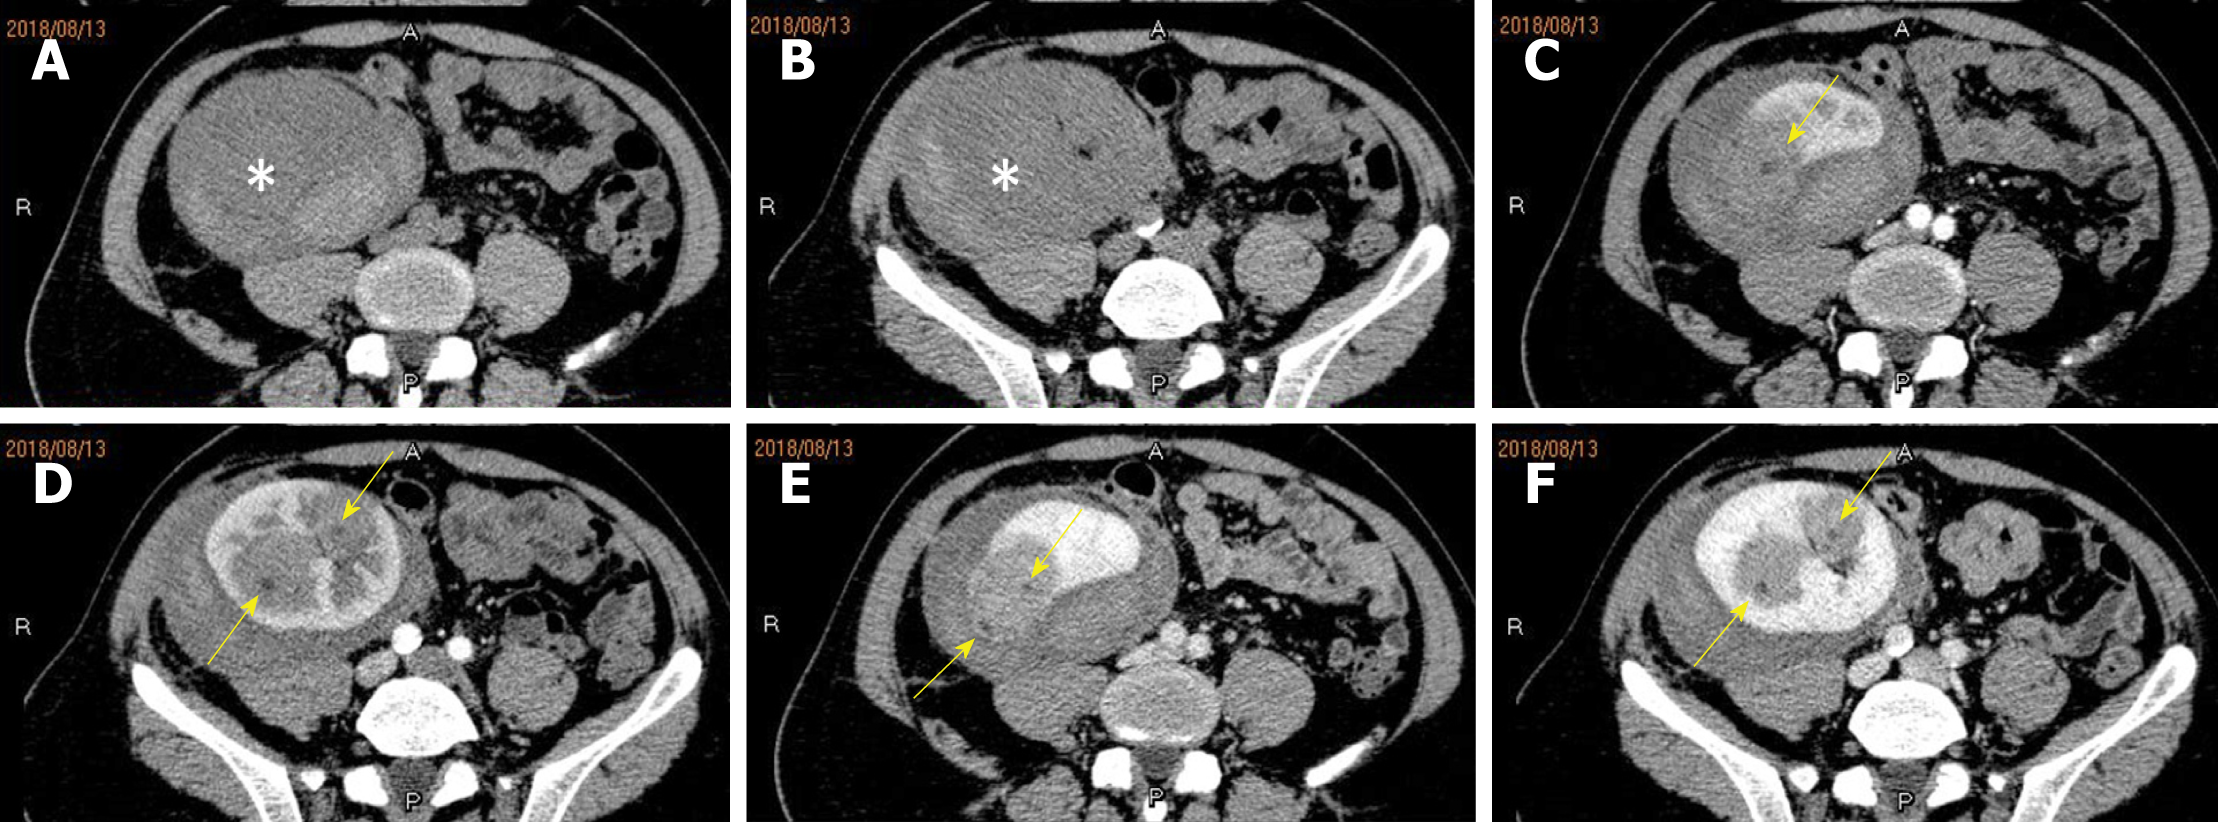
Figure 5 Contrast-enhanced computed tomography showed that the neoplasms became bigger one month later.
A and B: Non-enhancing images showing slightly hyper-density neoplasms (white stars) without distinct margins; C-F: Enhanced multiphase computed tomography image revealing slow, heterogeneous enhancement inside the neoplasms, with few spotty and patchy non-enhanced foci (yellow arrows); E and F: The venous phase images showing more clear margins than other phases.
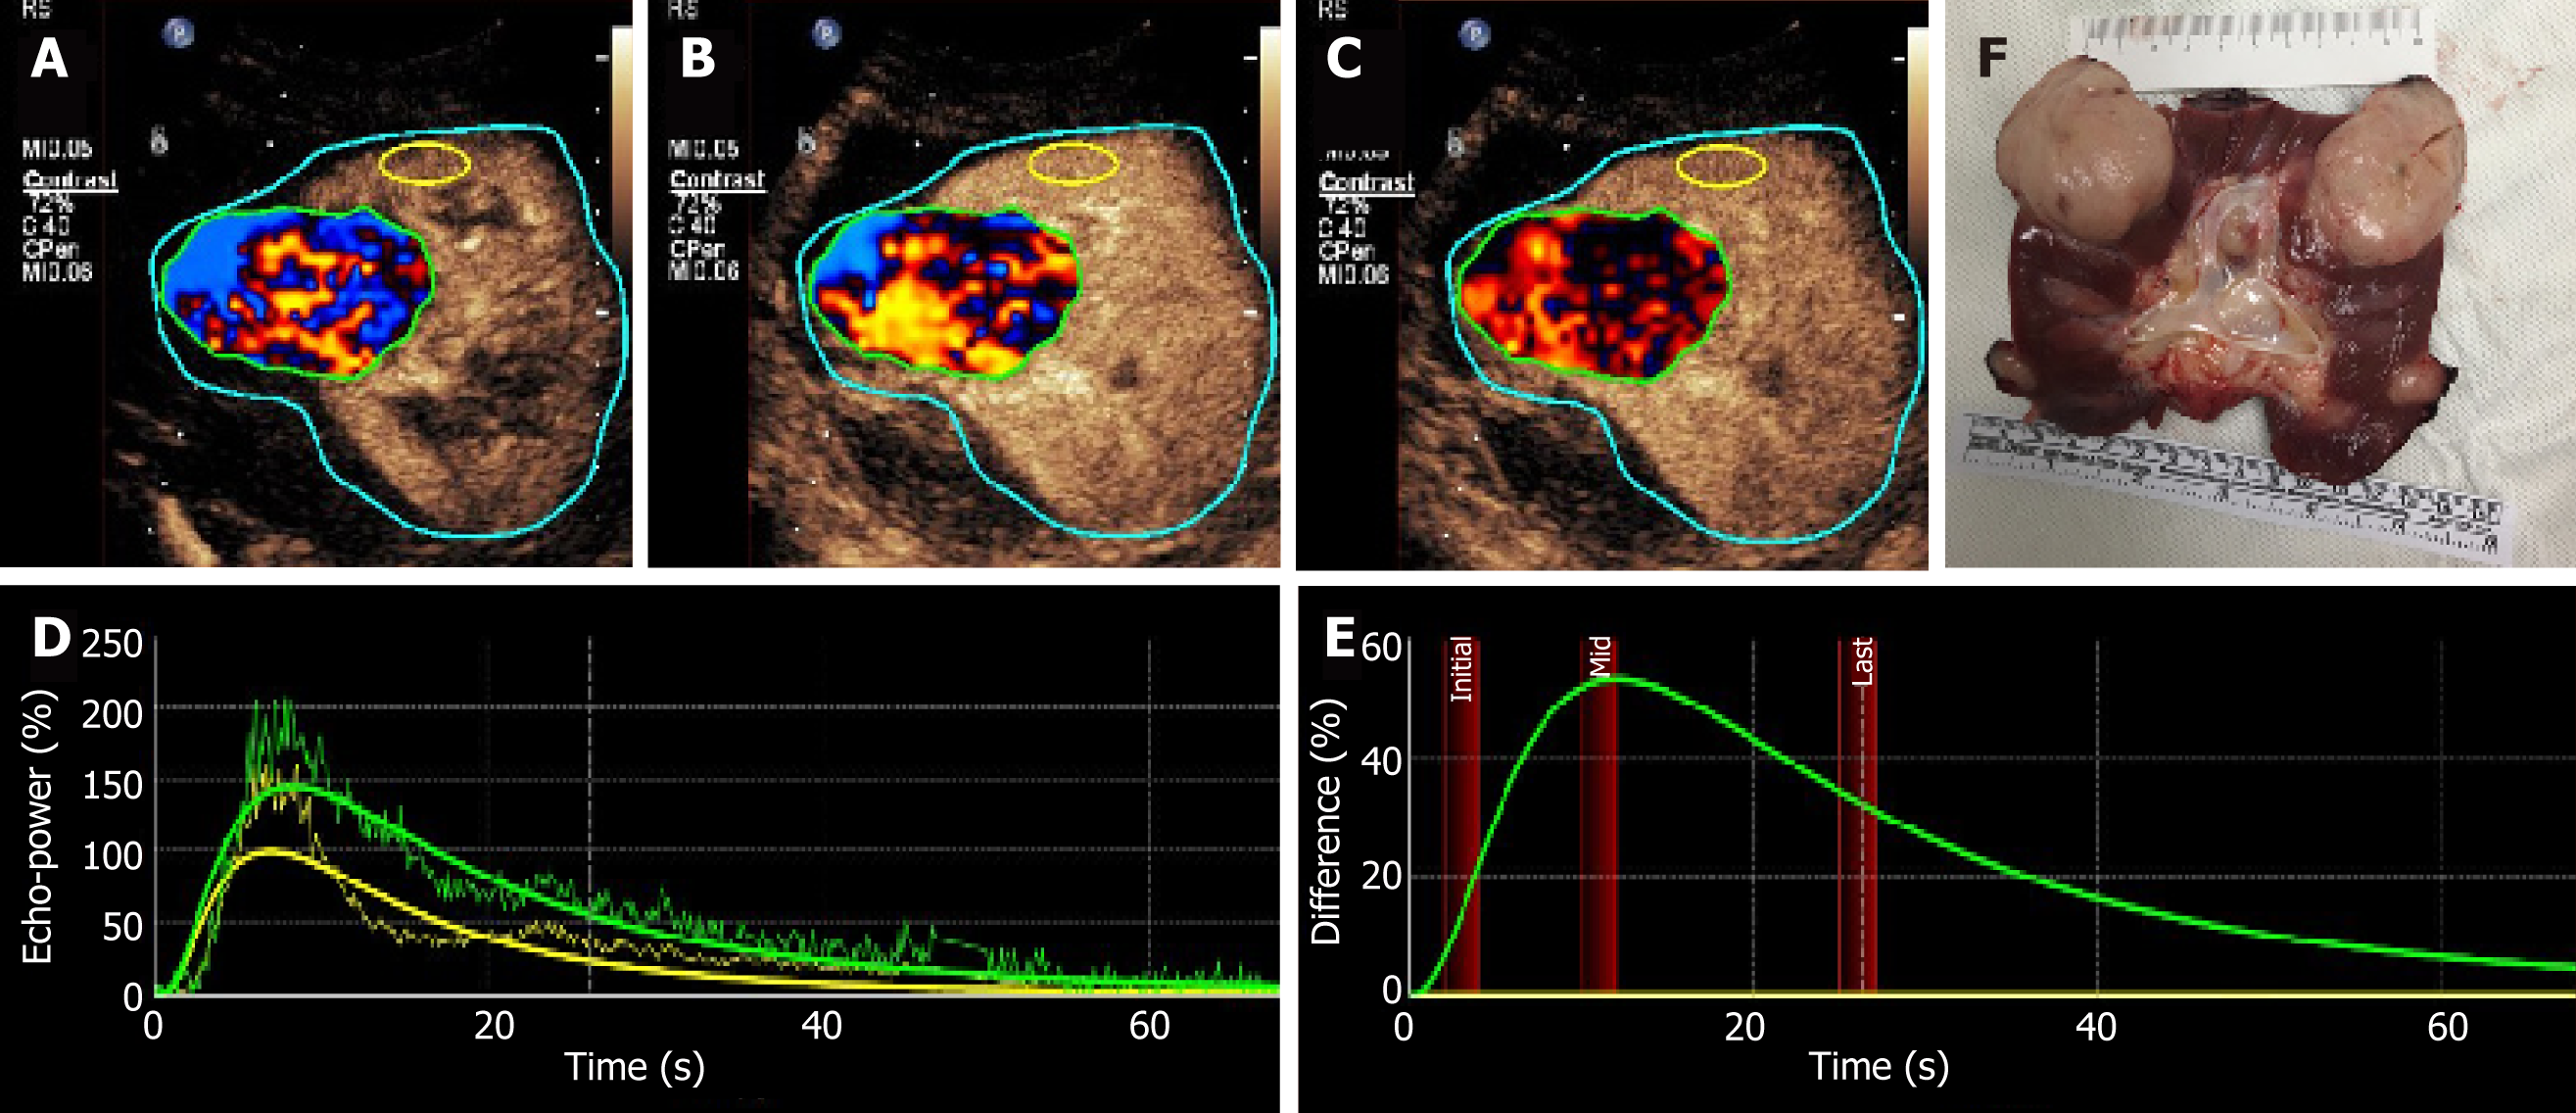
Figure 6 Gross specimen and parametric imaging of the neoplasms.
A-C: The neoplasm manifested as heterogeneous hyper-vascular enhancement compared with normal peripheral parenchyma, with irregular wash-in (red and blue) and wash-out (red and black) of the analyzing ROI; D: The time-intensity-curve showing that the enhancement of the neoplasm was persistently higher than that of the normal tissue; E: DVP curve showing that the pattern of this neoplasm was non-washout type; F: The gross specimen of the allograft after section.
- Citation: Xu RF, He EH, Yi ZX, Lin J, Zhang YN, Qian LX. Multimodality-imaging manifestations of primary renal-allograft synovial sarcoma: First case report and literature review. World J Clin Cases 2019; 7(13): 1677-1685
- URL: https://www.wjgnet.com/2307-8960/full/v7/i13/1677.htm
- DOI: https://dx.doi.org/10.12998/wjcc.v7.i13.1677


