Copyright
©The Author(s) 2019.
World J Clin Cases. Jul 6, 2019; 7(13): 1535-1553
Published online Jul 6, 2019. doi: 10.12998/wjcc.v7.i13.1535
Published online Jul 6, 2019. doi: 10.12998/wjcc.v7.i13.1535
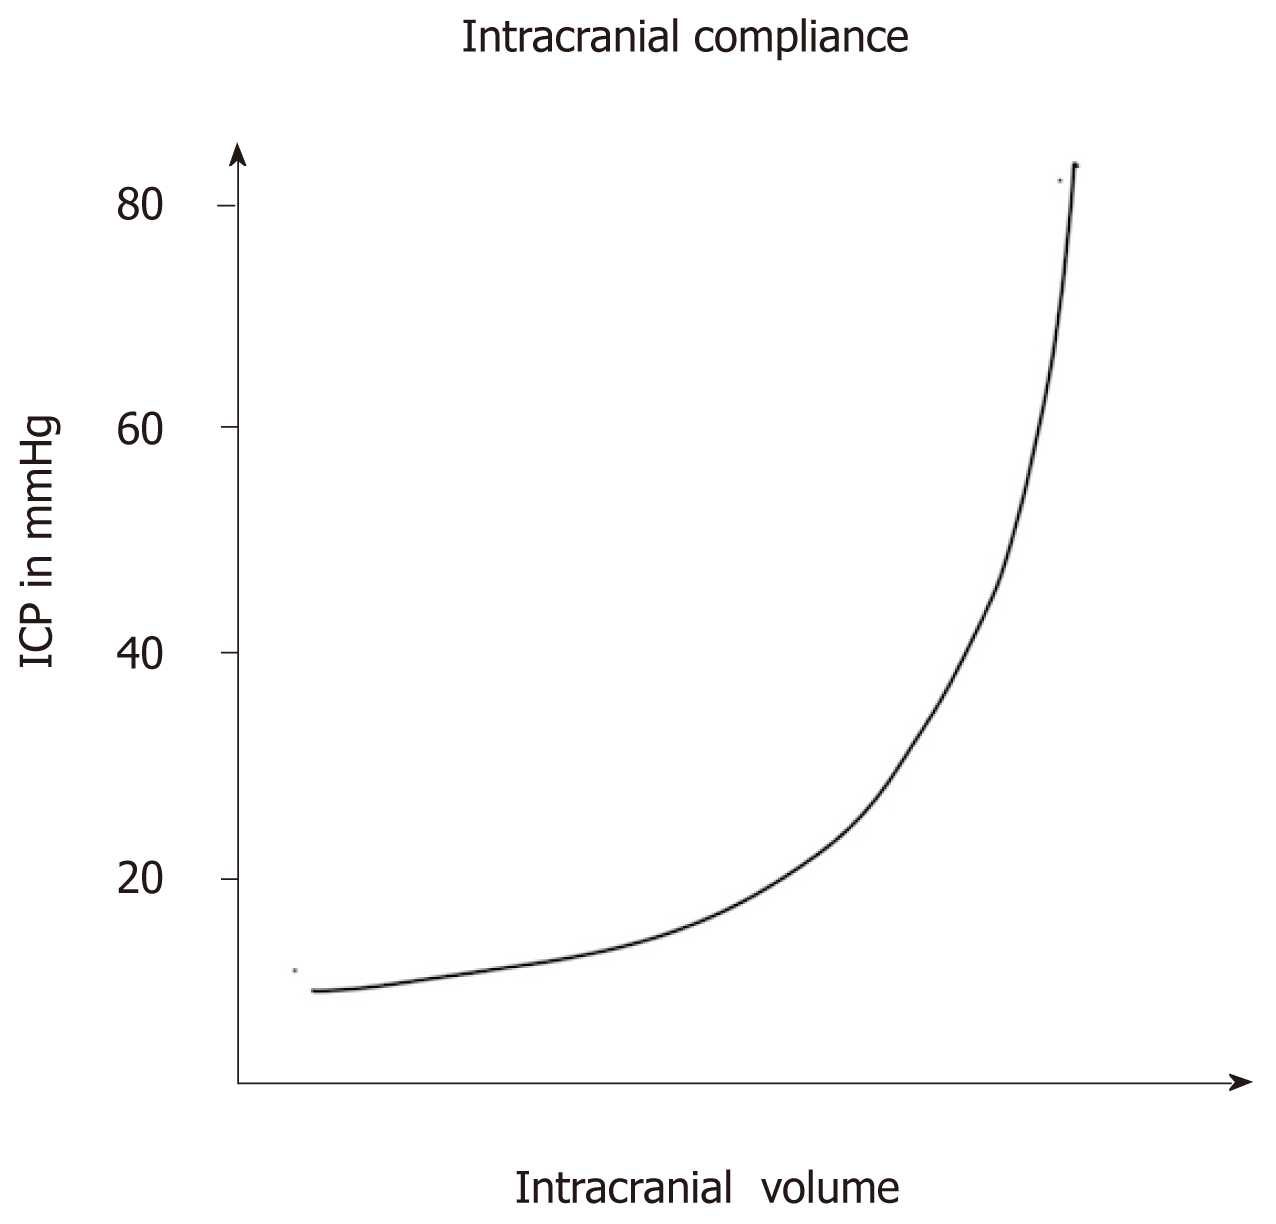
Figure 1 The relationship between intracranial pressure and volume.
ICP: Intracranial pressure.
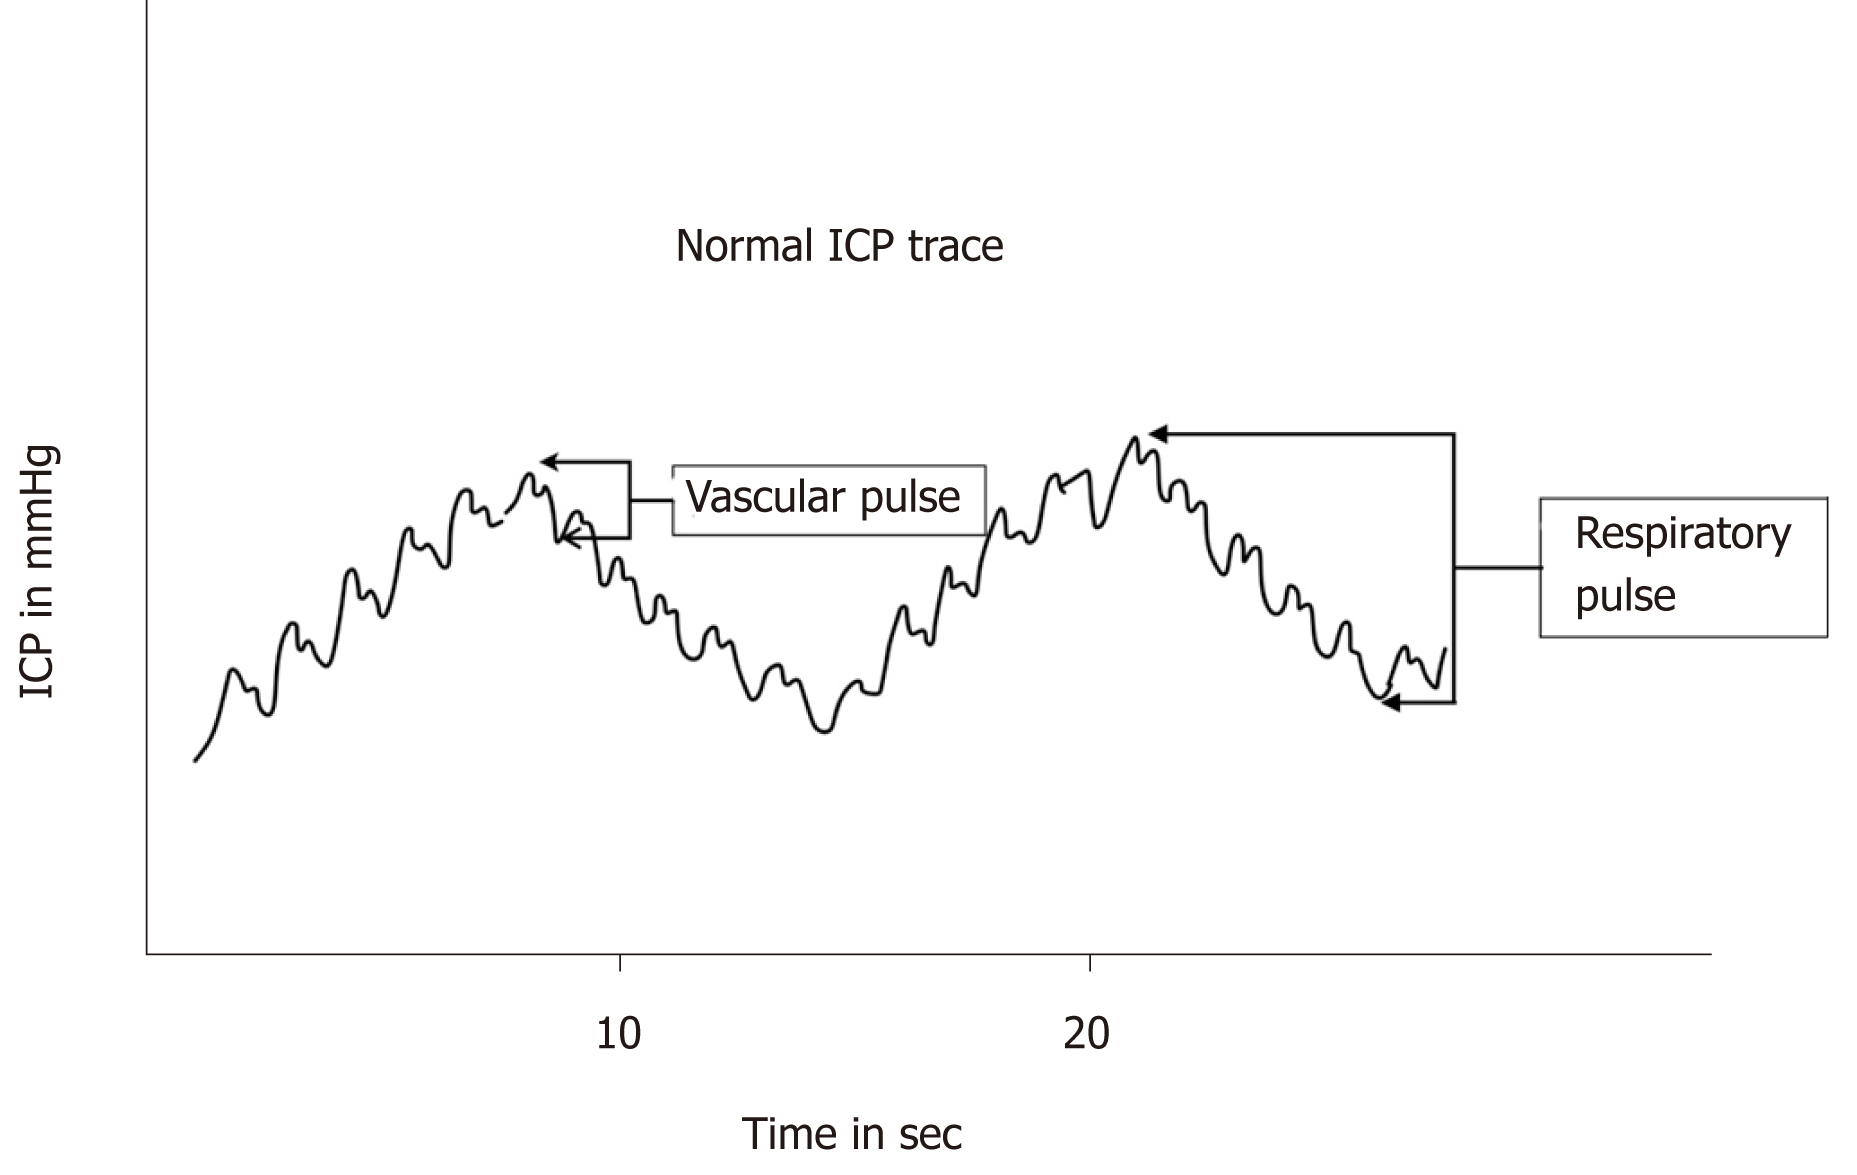
Figure 2 Normal intracranial pressure trace showing the vascular and respiratory pulse.
ICP: Intracranial pressure.
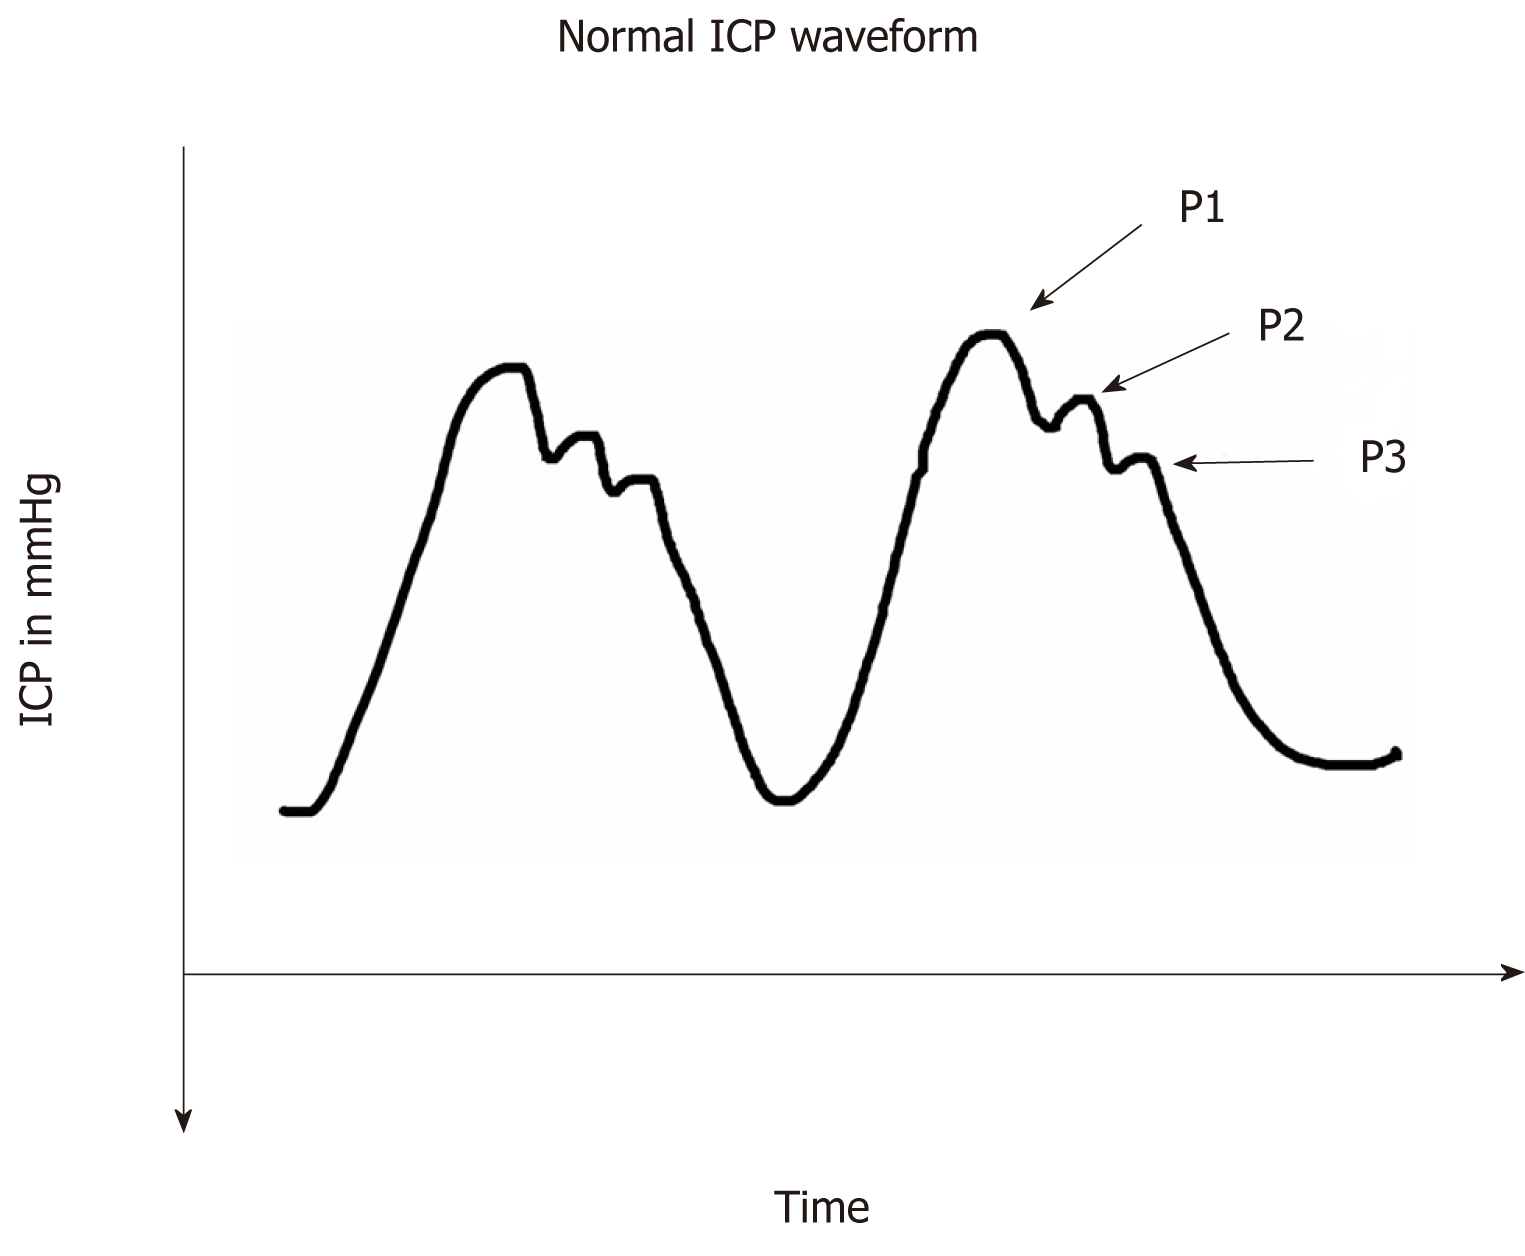
Figure 3 Normal intracranial pressure waveform showing the P1 (Percussion wave), P2 (Tidal wave) and P3 (Dicrotic notch).
ICP: Intracranial pressure.
Figure 4 Schematic diagram of the changes in intracranial pressure waveform in intracranial hypertension.
ICP: Intracranial pressure.
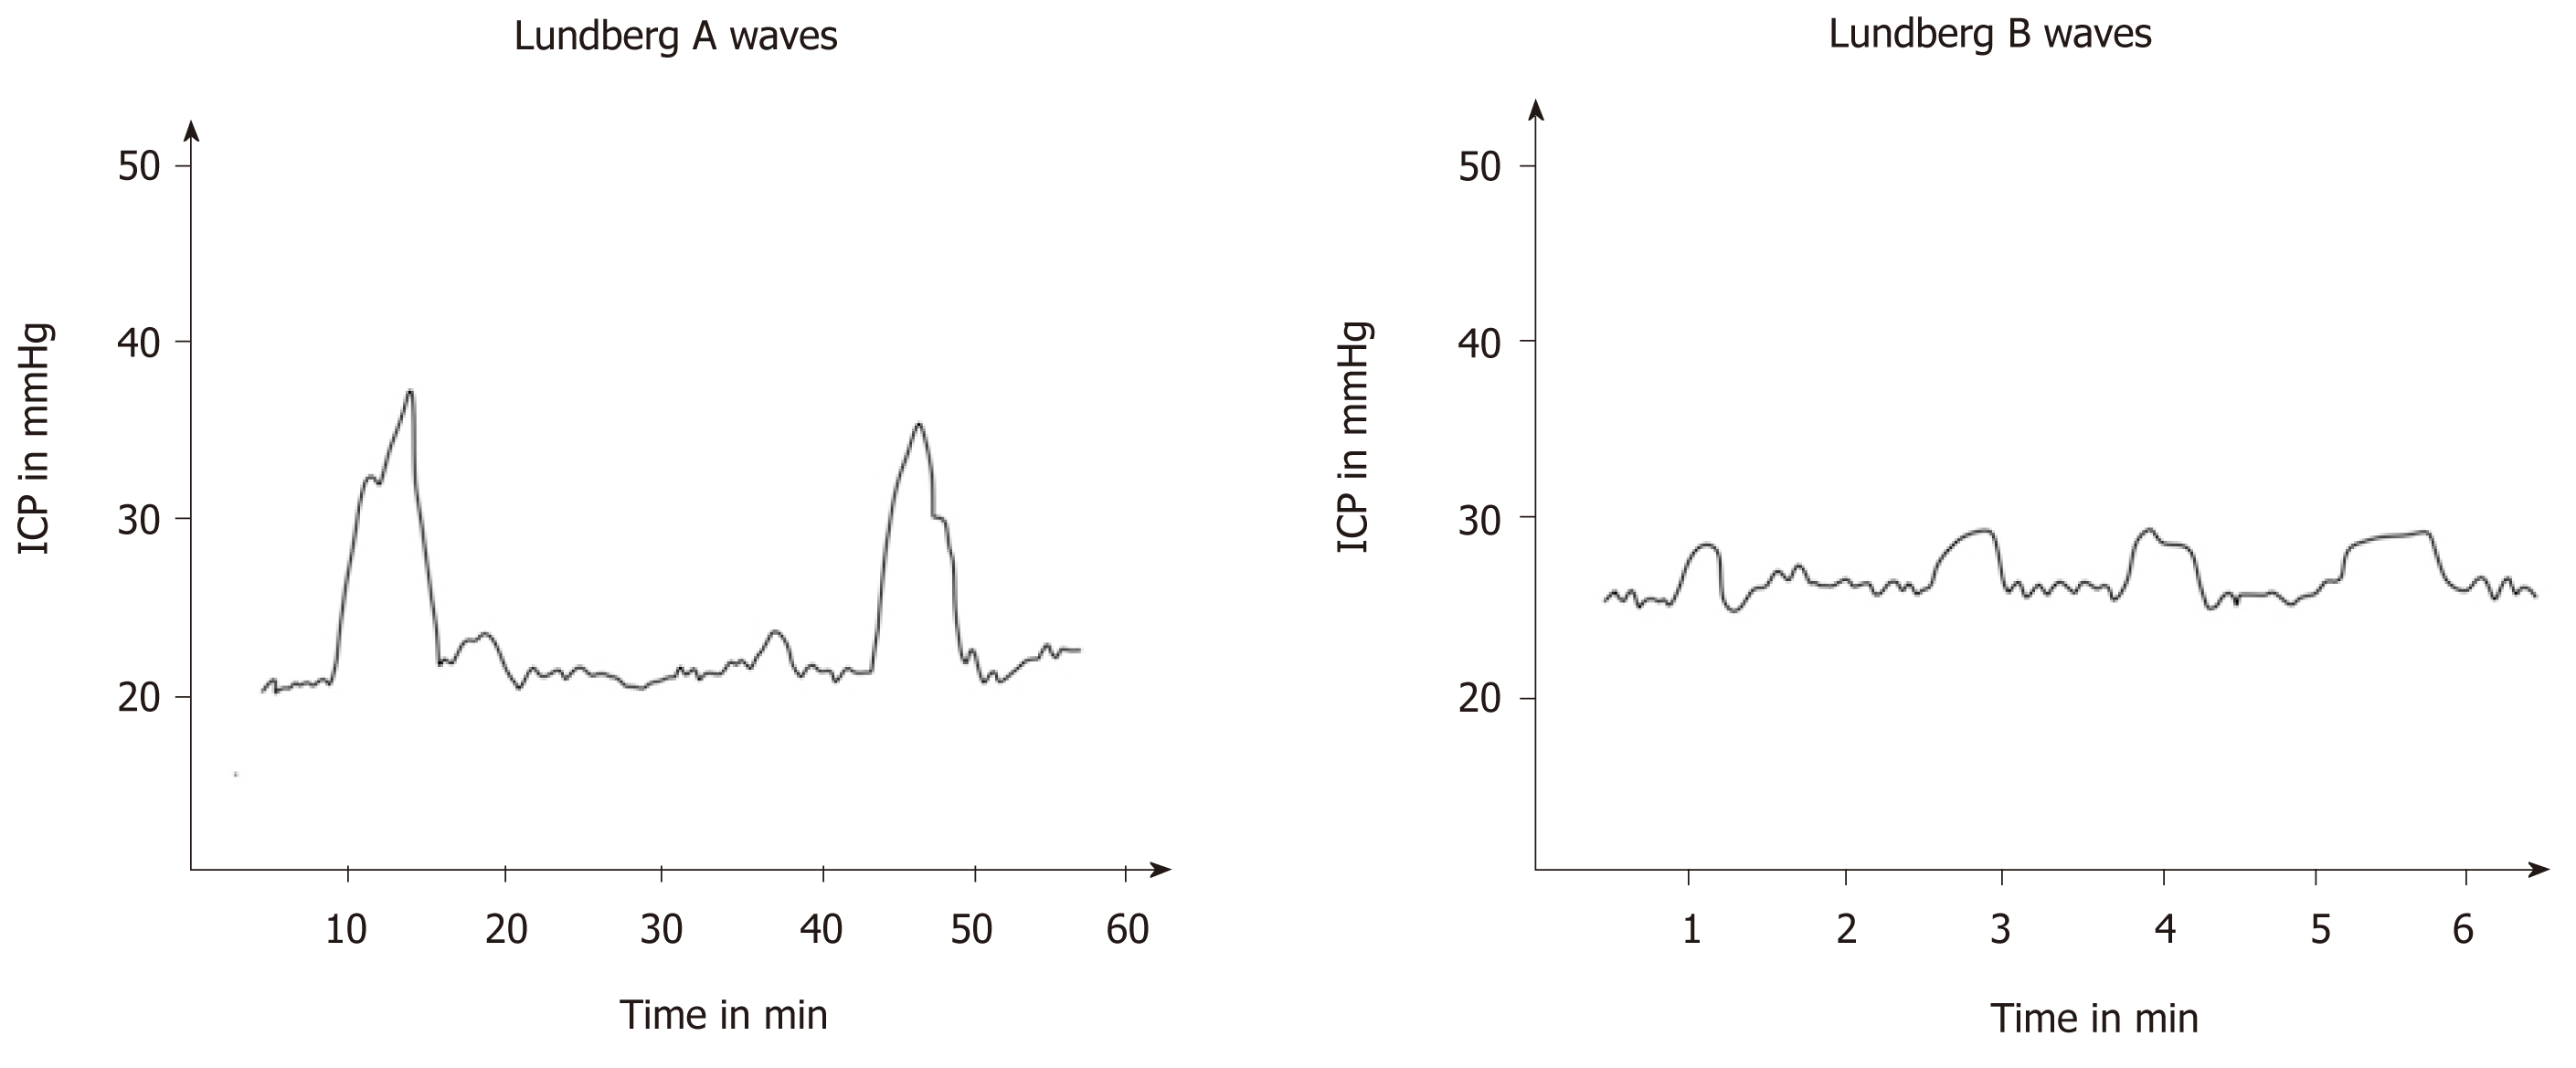
Figure 5 Schematic presentation of Lundberg A waves and Lundberg B waves.
ICP: Intracranial pressure.
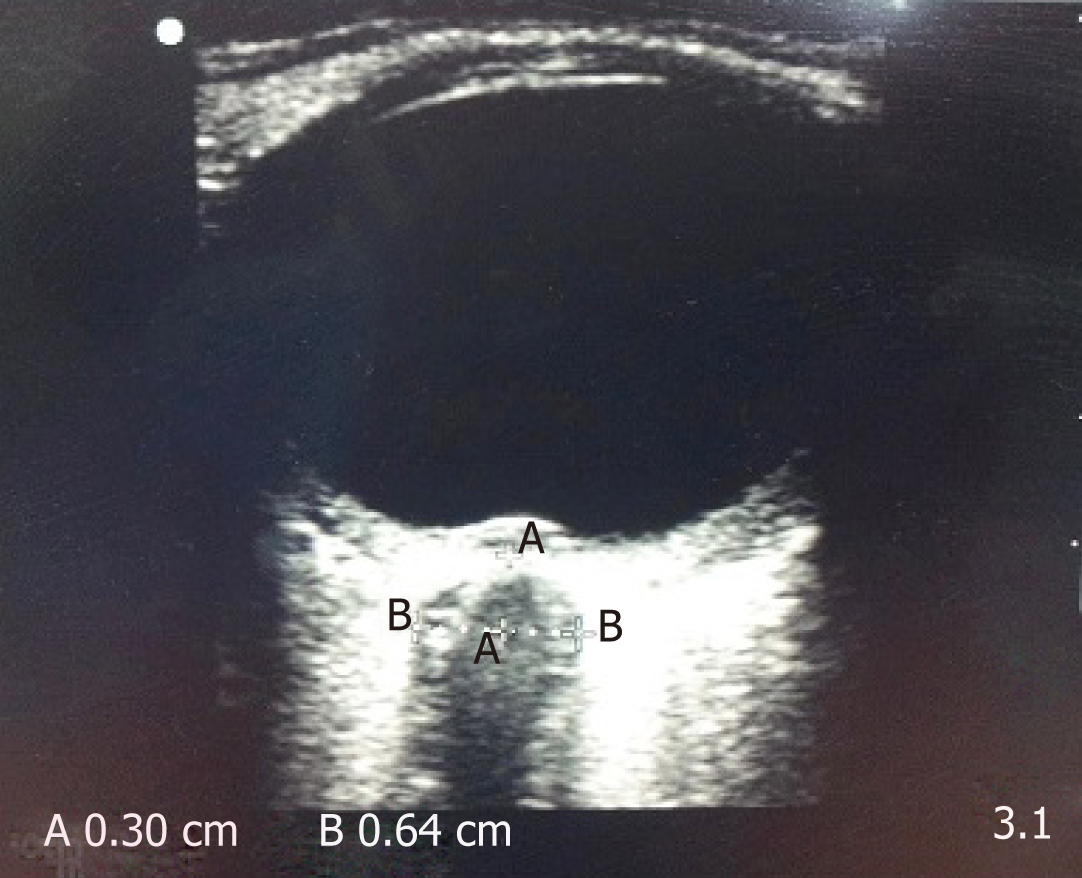
Figure 6 Ultrasound image of optic nerve sheath diameter.
The distance “A” is depth from posterior pole of eye (3 mm) and the distance “B” is the optic nerve sheath diameter.
- Citation: Nag DS, Sahu S, Swain A, Kant S. Intracranial pressure monitoring: Gold standard and recent innovations. World J Clin Cases 2019; 7(13): 1535-1553
- URL: https://www.wjgnet.com/2307-8960/full/v7/i13/1535.htm
- DOI: https://dx.doi.org/10.12998/wjcc.v7.i13.1535


