Copyright
©The Author(s) 2019.
World J Clin Cases. Jun 26, 2019; 7(12): 1393-1402
Published online Jun 26, 2019. doi: 10.12998/wjcc.v7.i12.1393
Published online Jun 26, 2019. doi: 10.12998/wjcc.v7.i12.1393
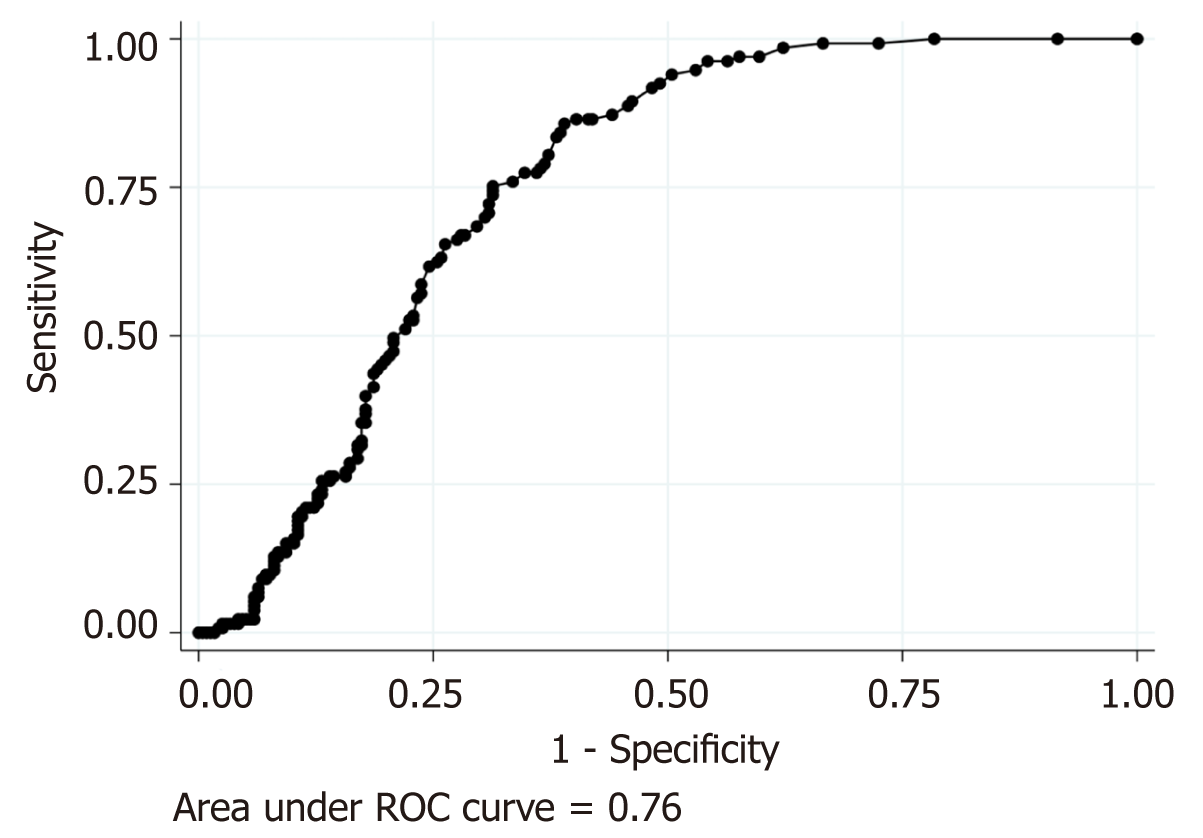
Figure 1 Receiver operating characteristic curve of C-reactive protein for predicting acute right colonic diverticulitis.
C-reactive protein (CRP) was categorized as low: ≤ 3.0 mg/dL or high: > 3.0 mg/dL because receiver operating characteristic analysis of CRP for predicting acute right colonic diverticulitis shows that a CRP level of 3.0 mg/dL has the best corrective classification as much as 71.0% (area under curve, 0.76; sensitivity, 75.2%; specificity, 68.6%). ROC: Receiver operating characteristic.
Figure 2 Forest plot of the logistic regression model for differentiating acute appendicitis from acute right colonic diverticulitis.
aLonger onset-to-visit interval, right lower quadrant pain, history of diverticulitis, and high serum C-reactive protein level (>3.0 mg/dL) at the time of visit have significantly low odds ratios (ORs), which suggests that acute right colonic diverticulitis (ARCD) is more likely rather than acute appendicitis (AA) (left side of the figure). bNausea/vomiting and anorexia have significantly high ORs, which suggests that AA is more likely rather than ARCD (right side of the figure). AA: Acute appendicitis; ARCD: Acute right colonic diverticulitis; CRP: C-reactive protein; OR: Odds ratio; RLQ: Right lower quadrant.
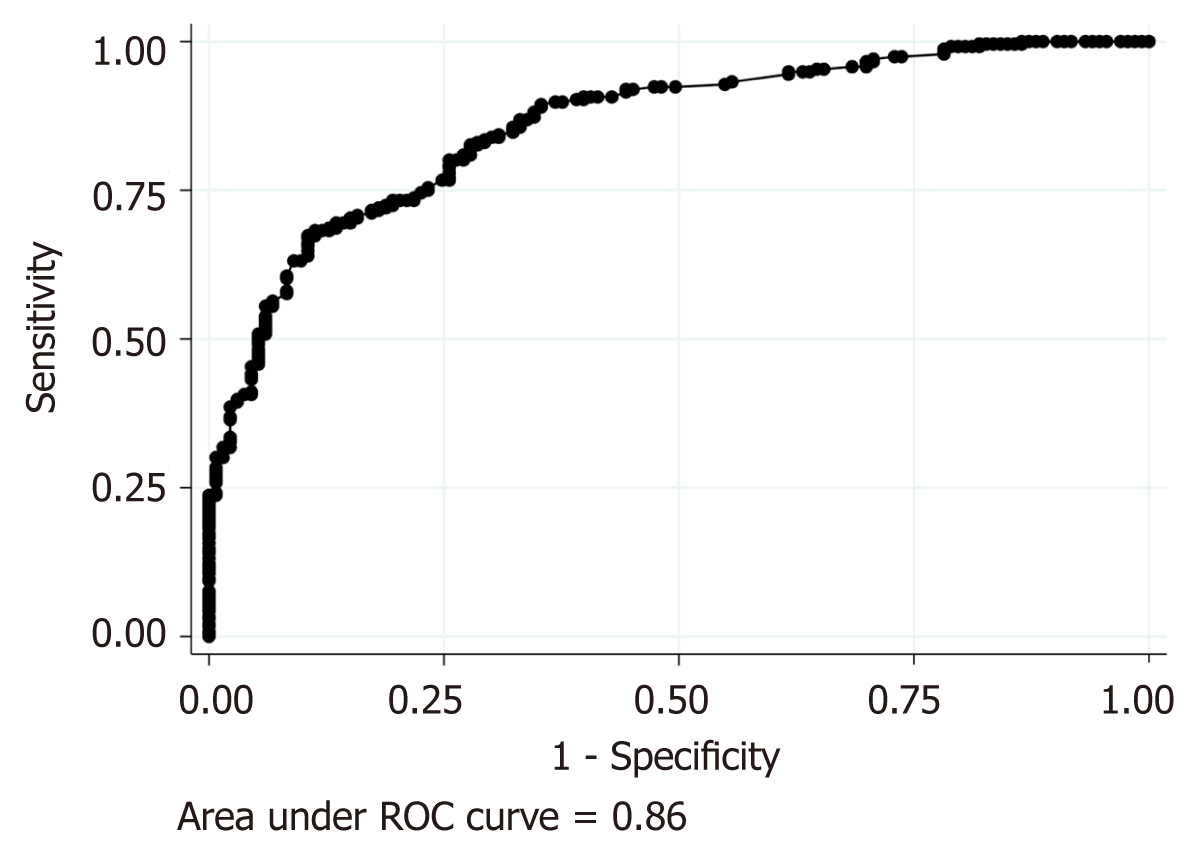
Figure 3 Receiver operating characteristic curve of the logistic regression model for differentiating acute appendicitis from acute right colonic diverticulitis.
Receiver operating characteristic curve of the regression model for differentiating acute appendicitis from acute right colonic diverticulitis shows good discrimination, with an area under the curve as high as 0.86, as shown above. ROC: Receiver operating characteristic.
- Citation: Sasaki Y, Komatsu F, Kashima N, Sato T, Takemoto I, Kijima S, Maeda T, Ishii T, Miyazaki T, Honda Y, Shimada N, Urita Y. Clinical differentiation of acute appendicitis and right colonic diverticulitis: A case-control study. World J Clin Cases 2019; 7(12): 1393-1402
- URL: https://www.wjgnet.com/2307-8960/full/v7/i12/1393.htm
- DOI: https://dx.doi.org/10.12998/wjcc.v7.i12.1393


