Copyright
©The Author(s) 2018.
World J Clin Cases. Oct 6, 2018; 6(11): 426-440
Published online Oct 6, 2018. doi: 10.12998/wjcc.v6.i11.426
Published online Oct 6, 2018. doi: 10.12998/wjcc.v6.i11.426
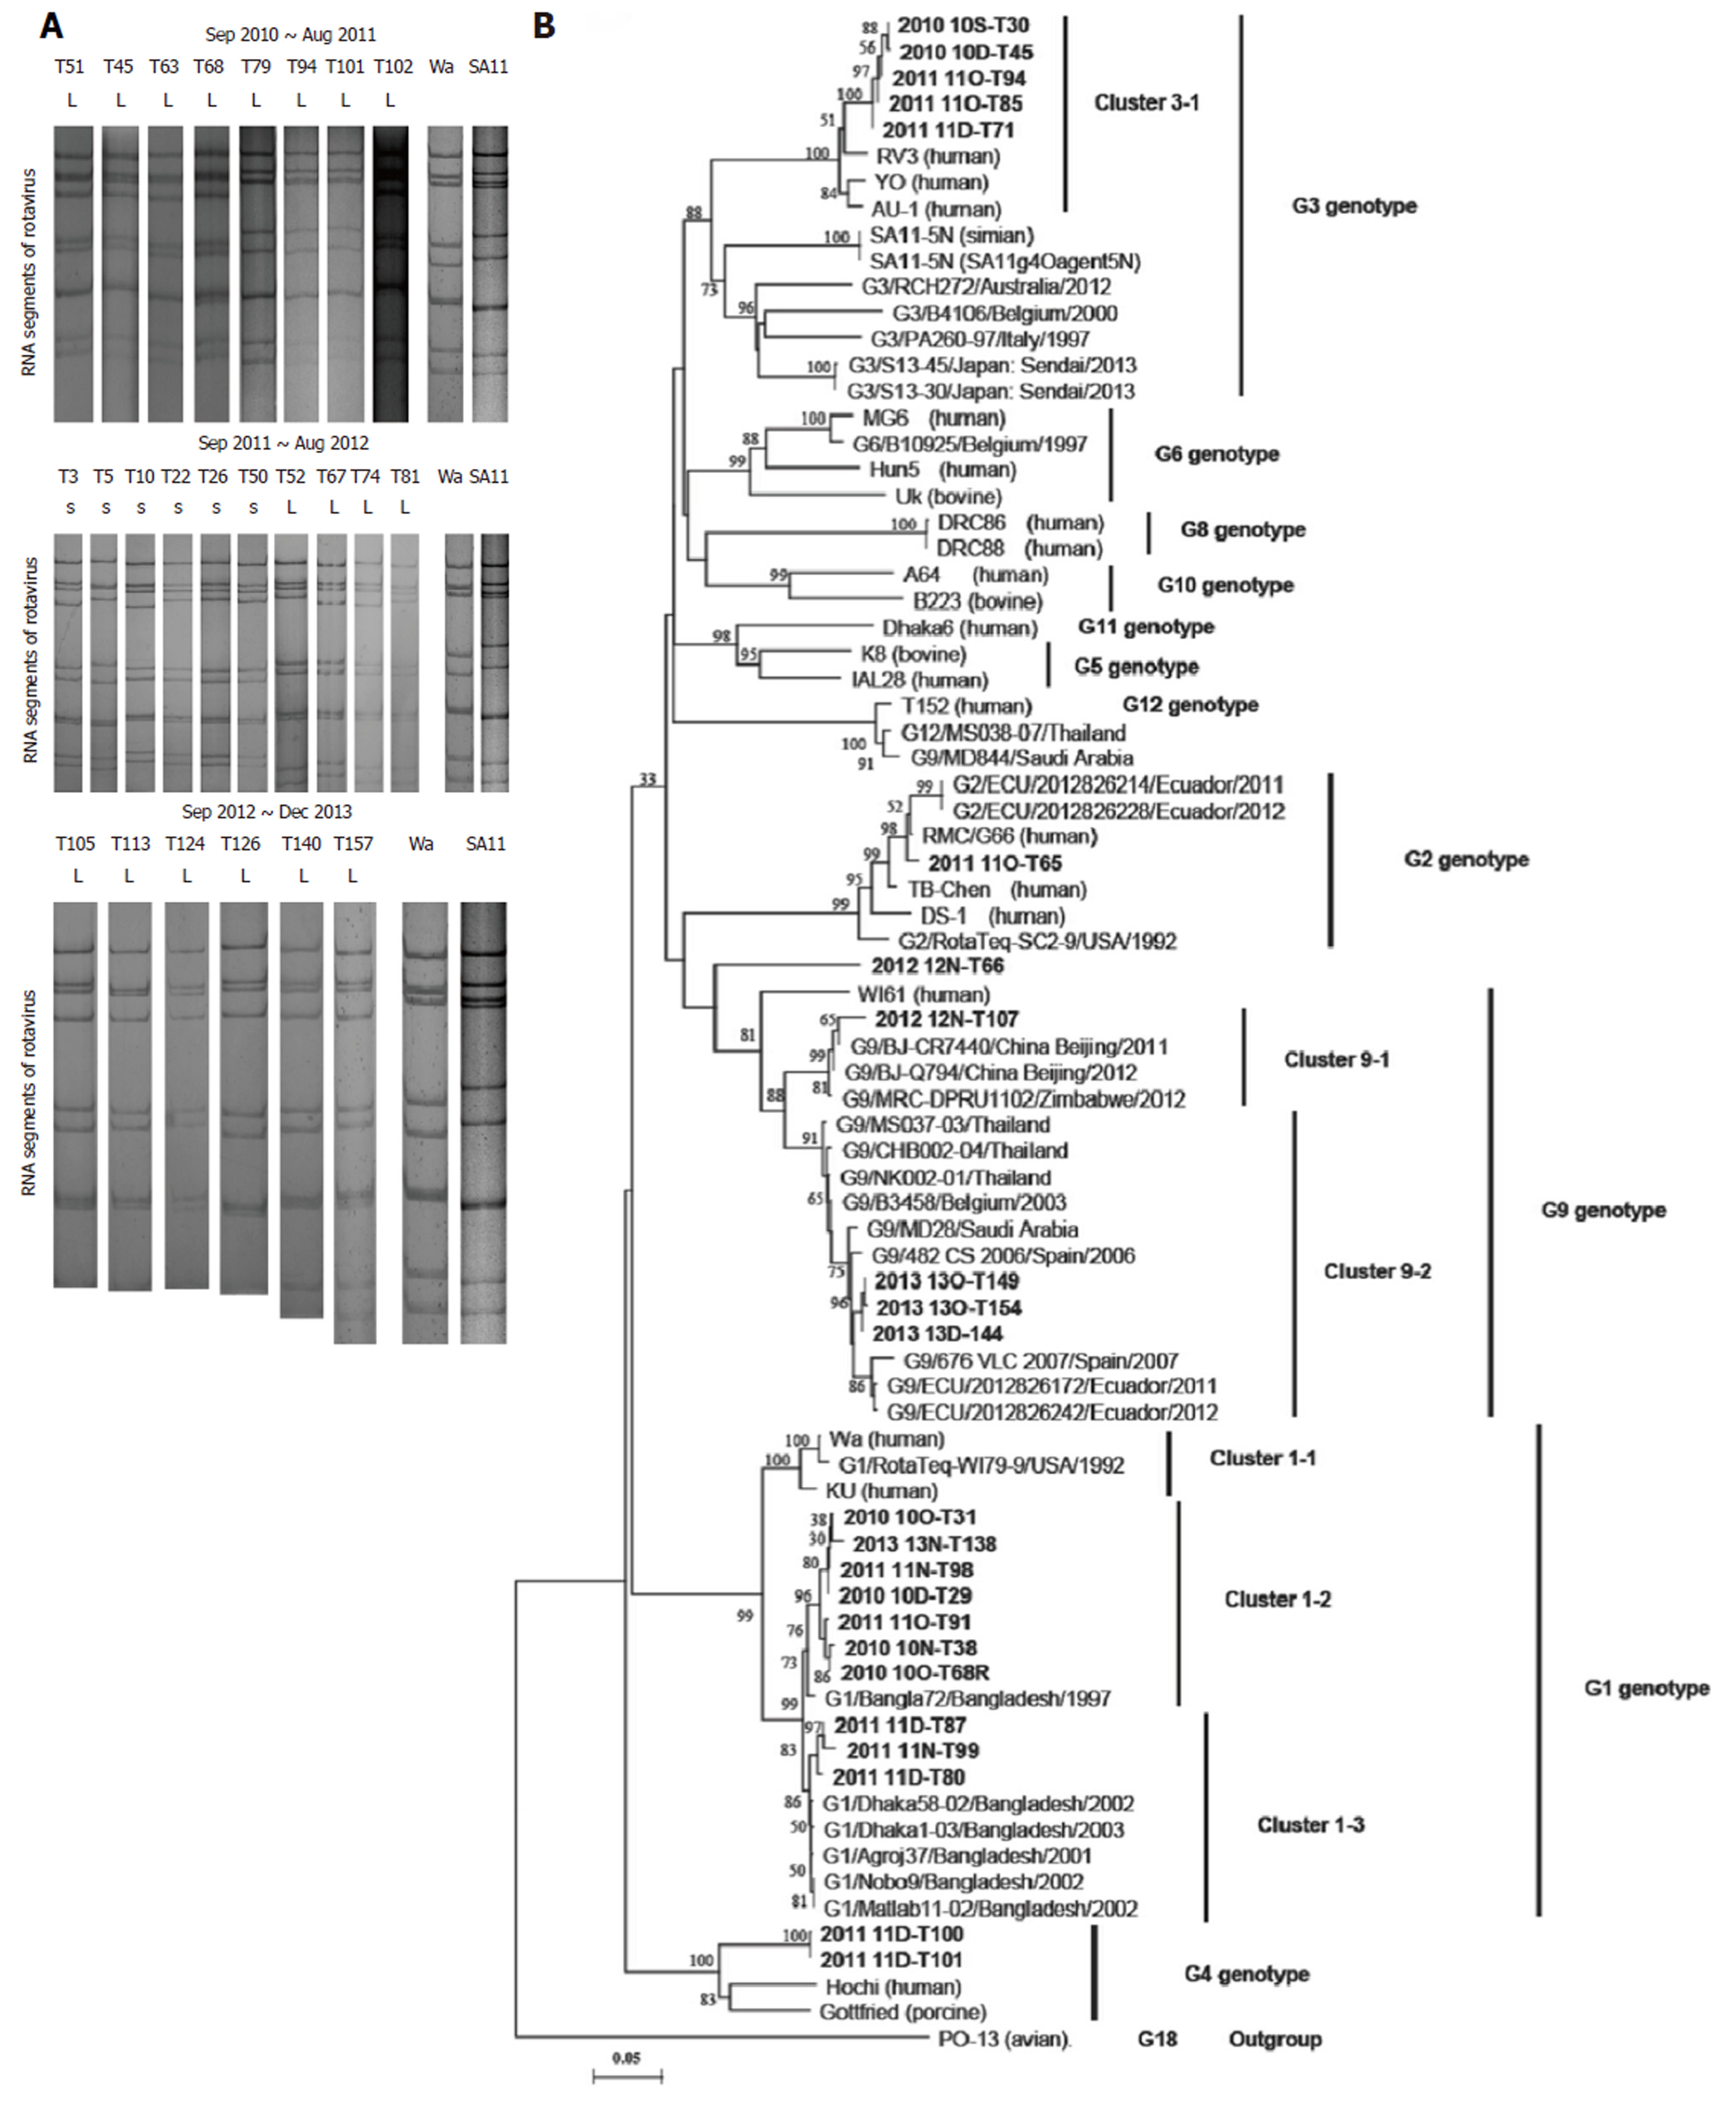
Figure 1 Polyacrylamide gel electrophoresis profiles and VP7 gene sequences of rotavirus strains isolated from diarrhea stools collected in Yunnan, China.
A: Electrophoretic migration pattern of RNA from 24 rotavirus-positive stool samples during September 2010 through December 2013. Rotavirus strains Wa and SA11 were used as the markers. The viral RNAs were analyzed by electrophoresis in a 10% polyacrylamide gel and visualized by staining with silver nitrate. L: long electropherotype; S: short electropherotype. Genes 10 and 11 of rotavirus RNA of some samples from September 2012 to December 2013 were not clear in this pattern; B: The partial sequences determined in this study are in bold. The most closely related sequences found in the GenBank database are also included. References for the sequences used in VP7 gene comparisons marked with “G genotype/isolate/country/collected year”. The scale bar represents 5% nucleotide sequence difference. Bootstrap values of > 50% (for 1000 iterations) are shown.
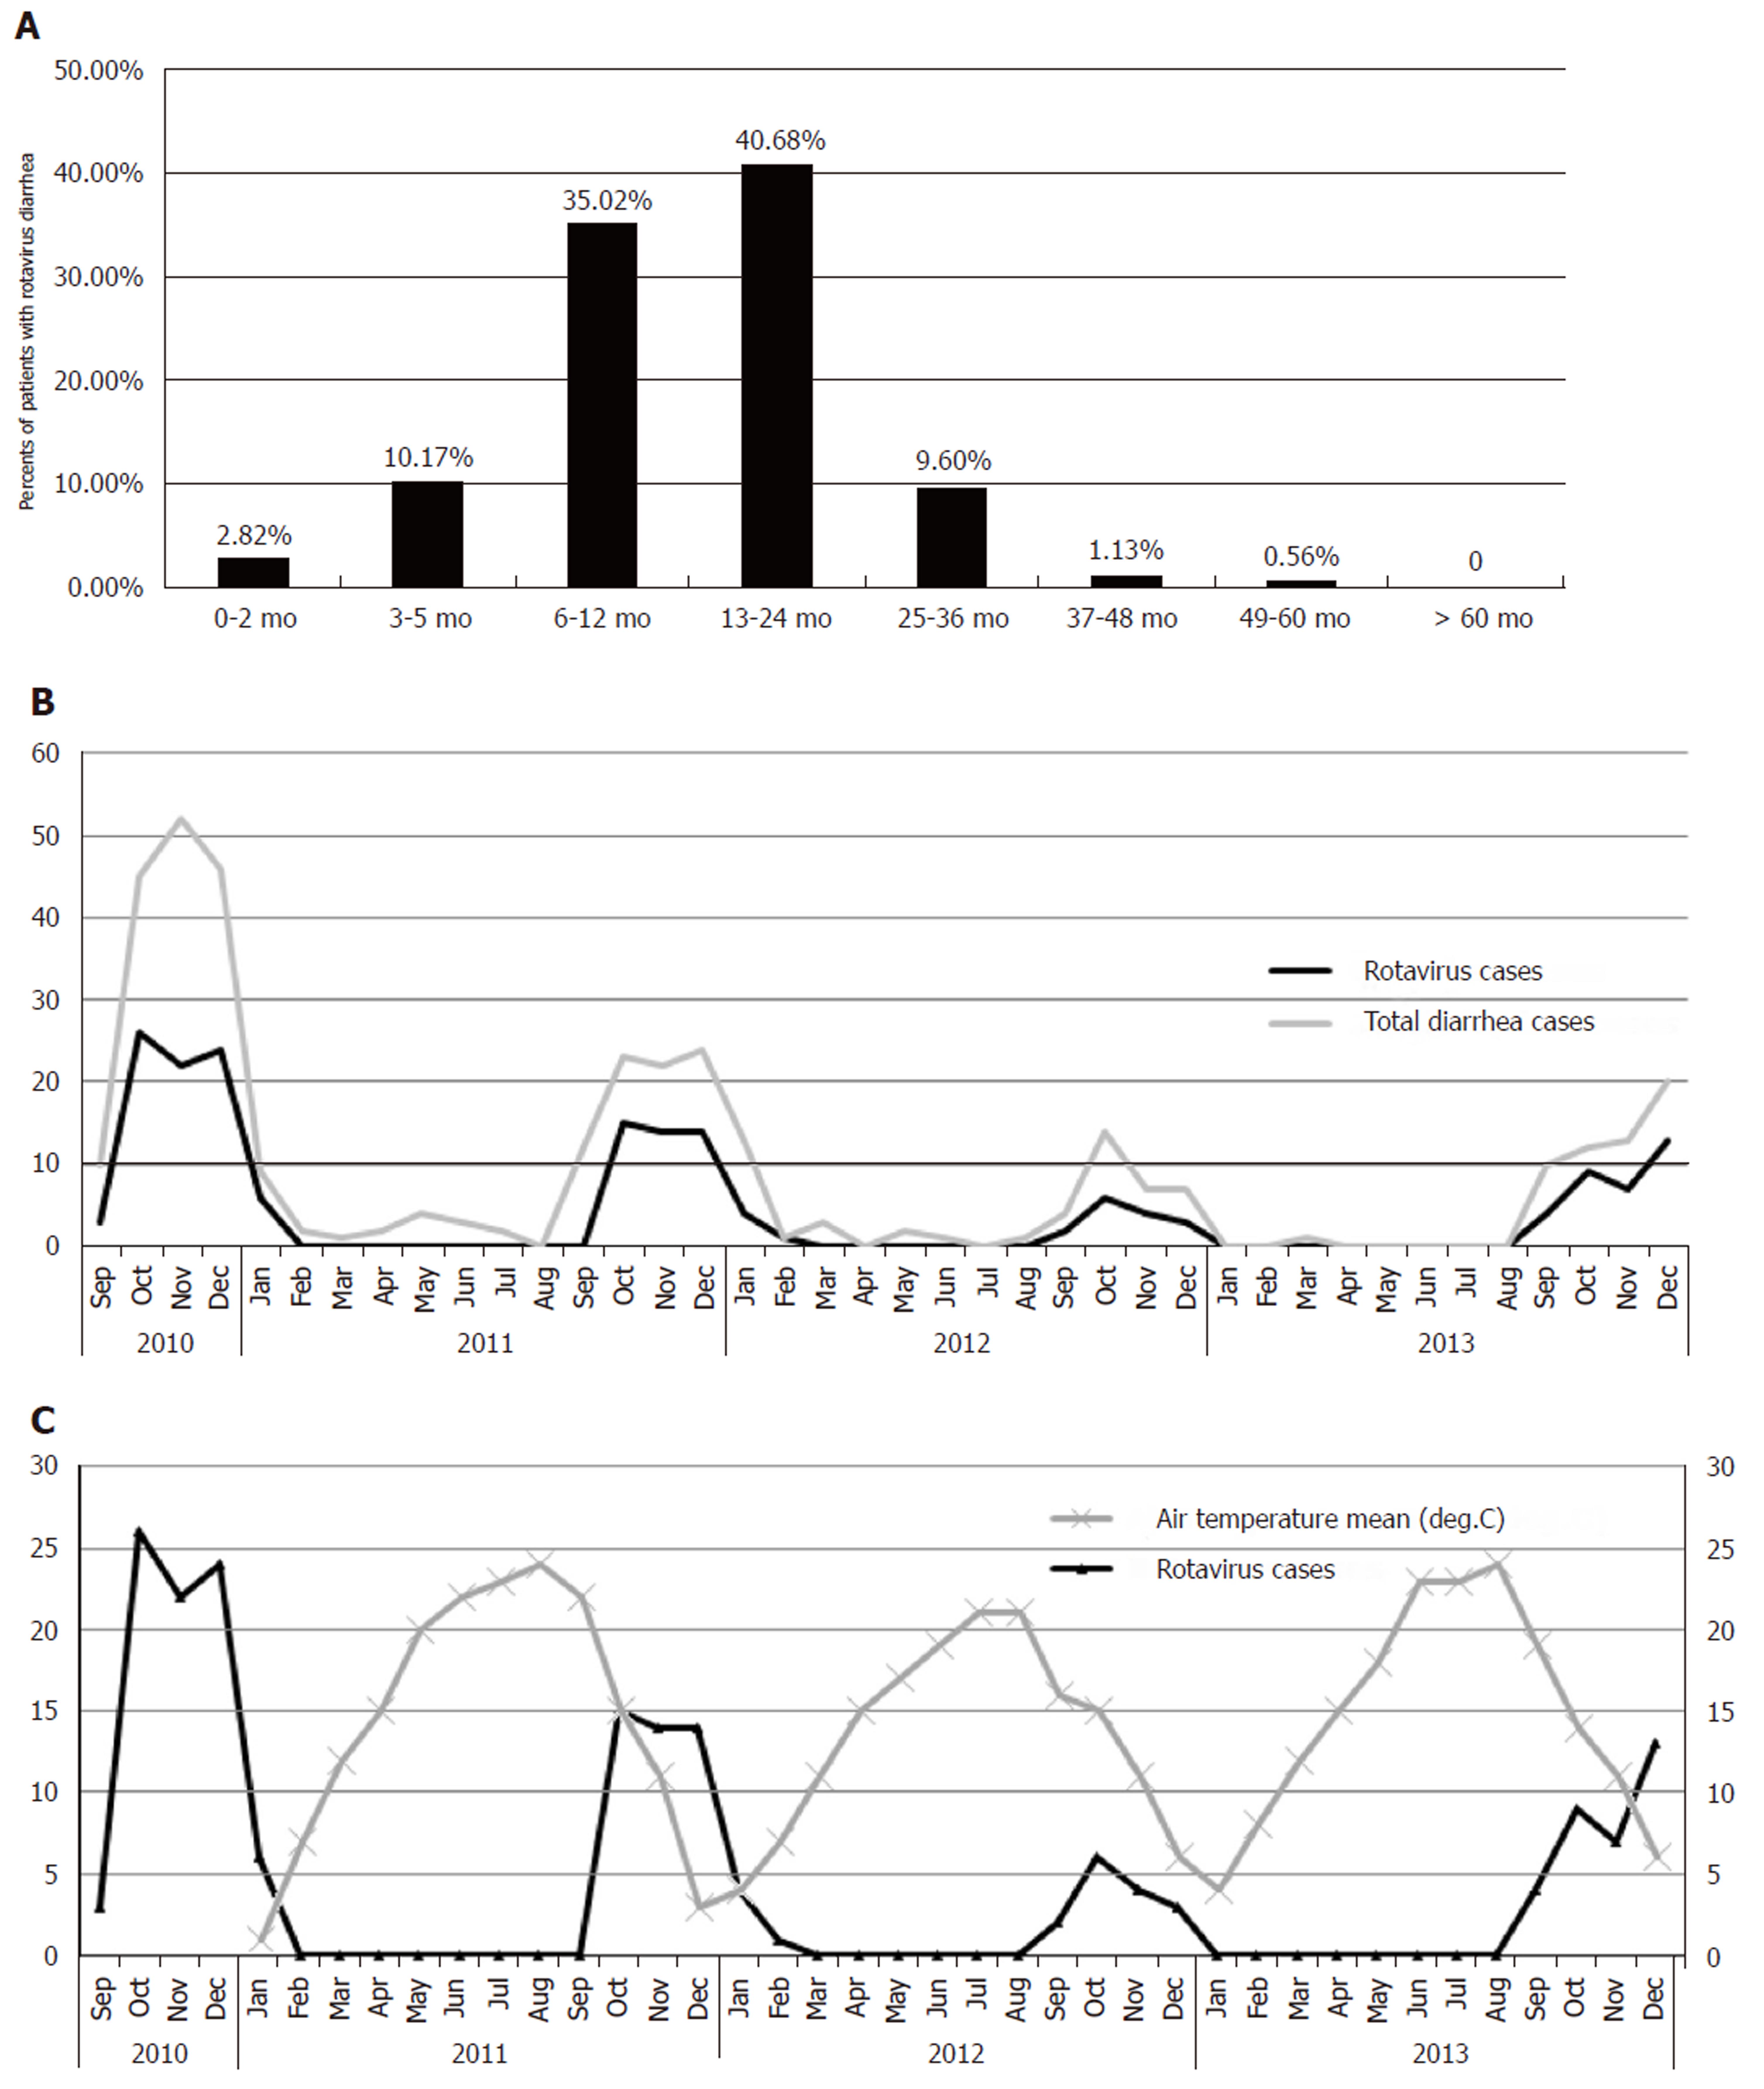
Figure 2 Age distribution and trends in number and proportion of gastroenteritis of rotavirus diarrhea cases from 2010 to 2013 in Yunnan, China.
A: Age distribution of rotavirus diarrhea cases from 2010 to 2013; B: Trends in number and proportion of gastroenteritis by rotavirus antigen over the study period. The scale bar on the left represents the number of rotavirus cases and total diarrhea cases; C The mean daily temperature of Yunnan from January 2011 to December 2013 compared to the number of rotavirus cases.
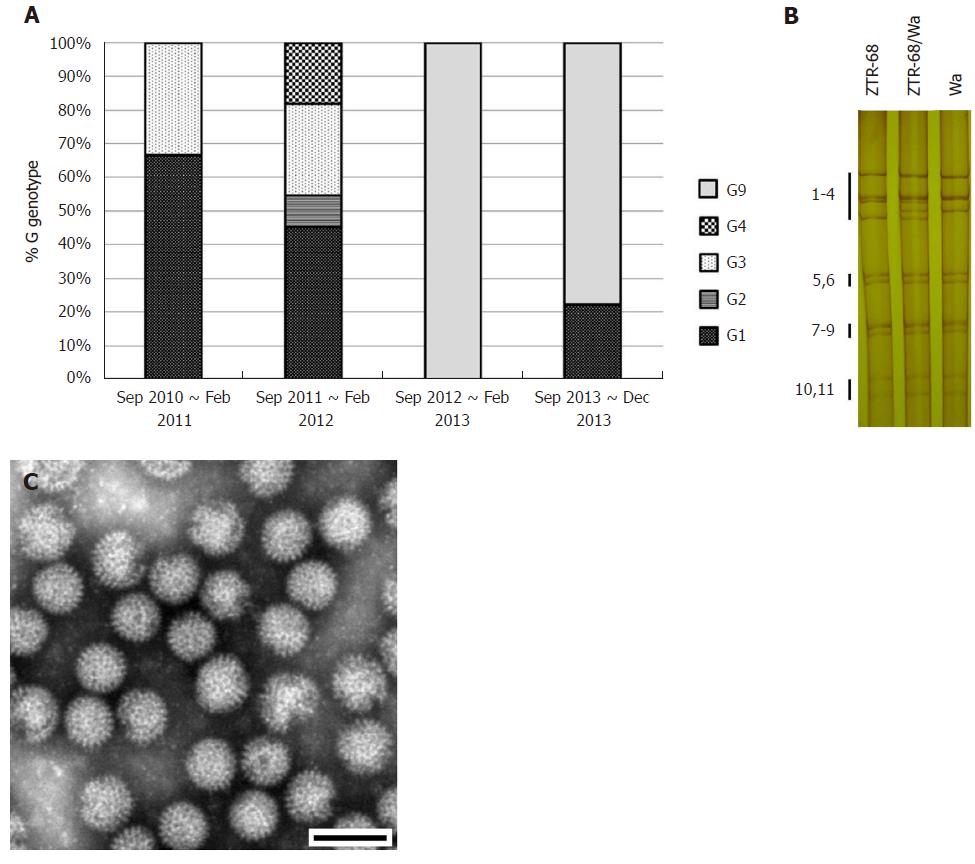
Figure 3 Rotavirus G genotype distribution and characterization of strain ZTR-68.
A: Rotavirus G genotype distribution during rotavirus peak season (September to February) from 2010 to 2013, on the basis of rotavirus VP7 genes sequences analysis; B: Electrophoretic pattern of ZTR-68/Wa. Electrophoretic migration pattern of RNA from rotavirus. Viral genomic dsRNAs extracted were separated in 10% polyacrylamide gels and visualized by silver staining. Numbers indicate the order of the ZTR-68 and Wa gene segments; C: Rotavirus strain ZTR-68, Bar = 100 nm.
Figure 4 Phylogenetic trees of the all rotavirus 11 gene segments for ZTR-68.
Phylogenetic trees of the genes coding for virus structural proteins and non-structural proteins. The scale bar represents 2%-10% nucleotide sequence difference. Bootstrap values of > 50% (for 1000 iterations) are shown.
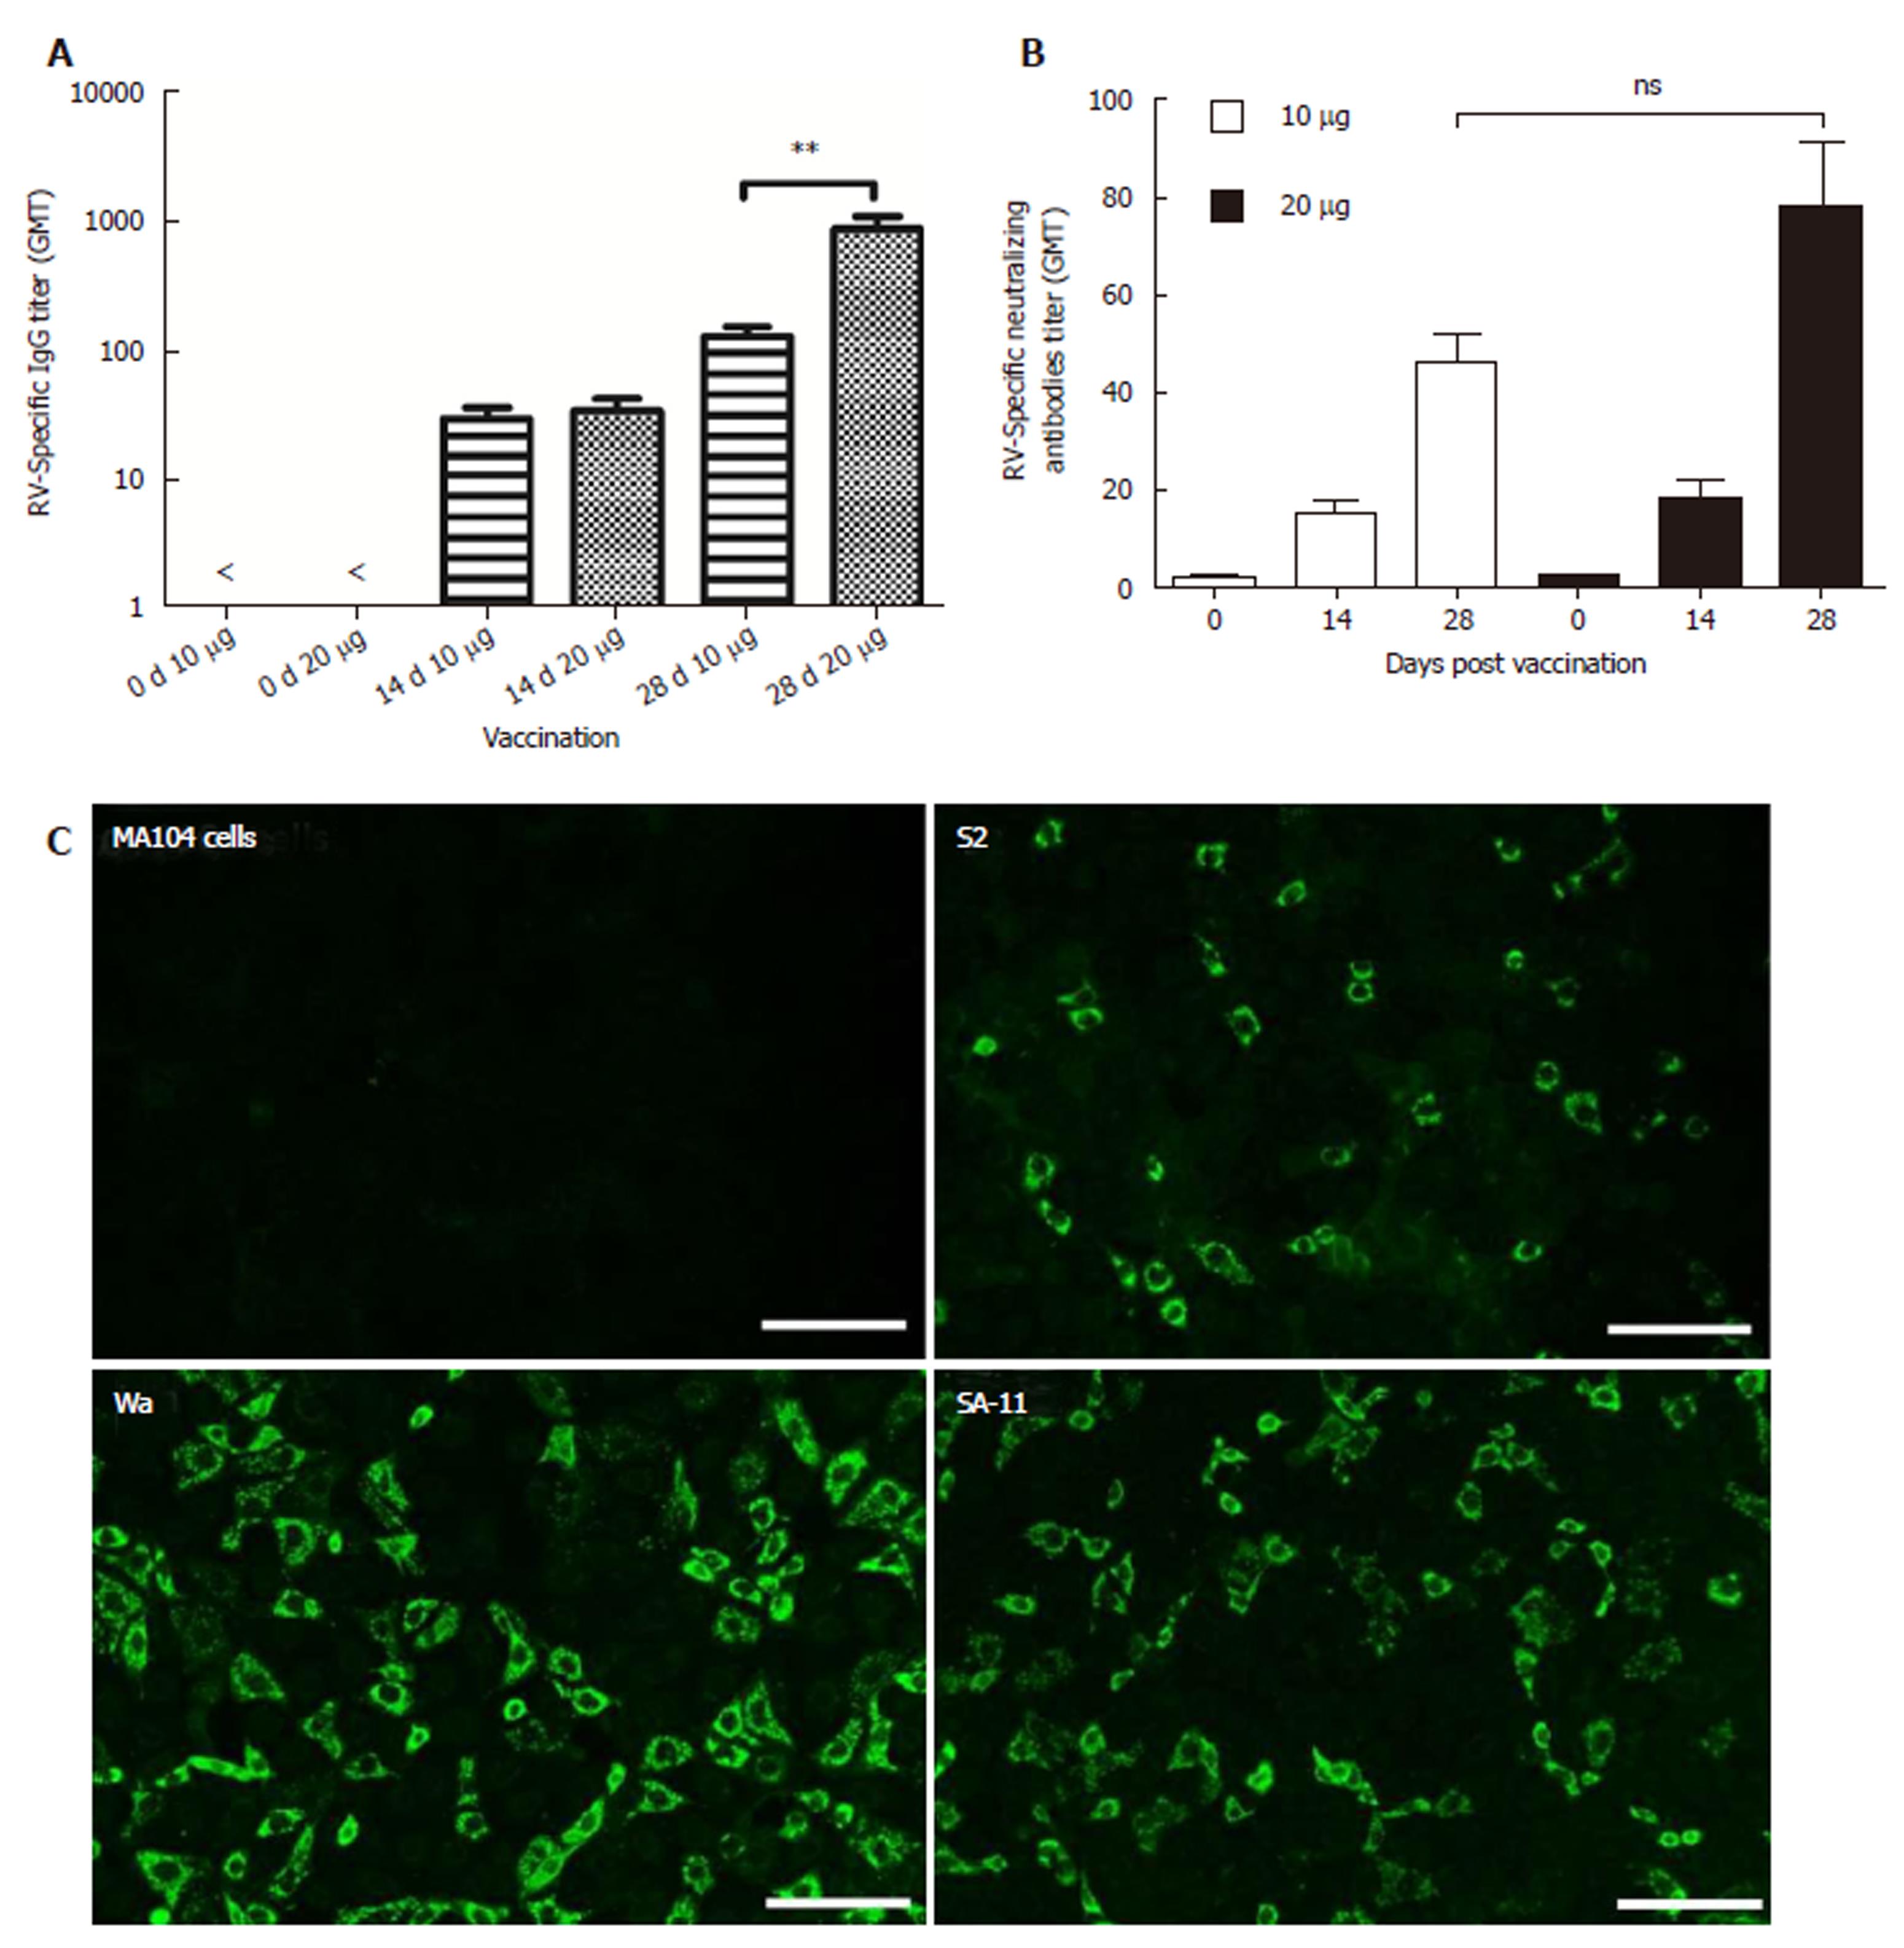
Figure 5 Increased IgG levels and neutralizing antibody levels in inactivated rotavirus ZTR-68.
RV-specific IgG and neutralizing antibodies were detected in sera on days 0, 14, and 28. A: RV-specific IgG titer; B: Neutralizing antibodies titer. Both showed in GMT; C: Rotavirus vaccine (RV) specific antibodies detected by fluorescent cross-type rotavirus antibody test using rotavirus strain Wa(G1P[8]), S2(G2P[4]), and SA11(G3P[2]) for IRV ZTR-68. ns: not significant; bP ≤ 0.01.
- Citation: Wu JY, Zhou Y, Zhang GM, Mu GF, Yi S, Yin N, Xie YP, Lin XC, Li HJ, Sun MS. Isolation and characterization of a new candidate human inactivated rotavirus vaccine strain from hospitalized children in Yunnan, China: 2010-2013. World J Clin Cases 2018; 6(11): 426-440
- URL: https://www.wjgnet.com/2307-8960/full/v6/i11/426.htm
- DOI: https://dx.doi.org/10.12998/wjcc.v6.i11.426


