Copyright
©The Author(s) 2017.
World J Clin Cases. Jul 16, 2017; 5(7): 286-291
Published online Jul 16, 2017. doi: 10.12998/wjcc.v5.i7.286
Published online Jul 16, 2017. doi: 10.12998/wjcc.v5.i7.286
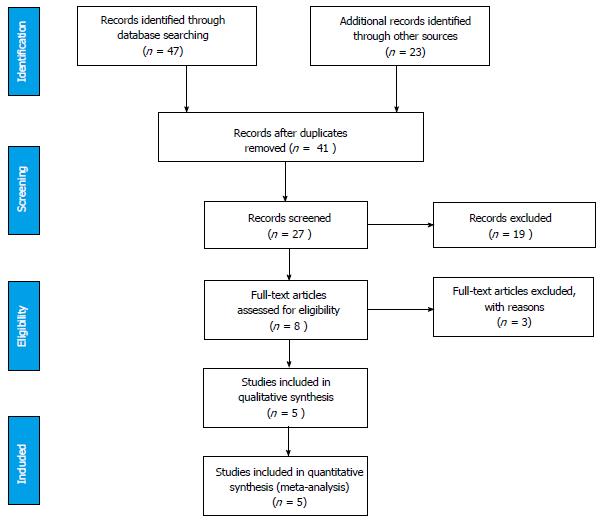
Figure 1 PRISMA flow diagram.
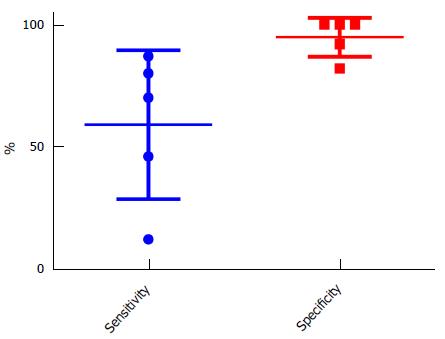
Figure 2 Box and Whisper Plot highlighting range of sensitivity and specificity.
- Citation: Kanzara T, Virk JS. Diagnostic performance of high resolution computed tomography in otosclerosis. World J Clin Cases 2017; 5(7): 286-291
- URL: https://www.wjgnet.com/2307-8960/full/v5/i7/286.htm
- DOI: https://dx.doi.org/10.12998/wjcc.v5.i7.286


