Copyright
©The Author(s) 2017.
World J Clin Cases. Oct 16, 2017; 5(10): 373-377
Published online Oct 16, 2017. doi: 10.12998/wjcc.v5.i10.373
Published online Oct 16, 2017. doi: 10.12998/wjcc.v5.i10.373
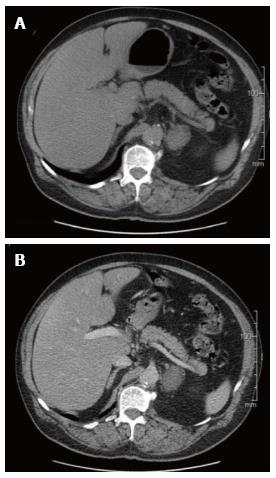
Figure 1 Axial computed tomography of left adrenal ganglioneuroma: Well-defined, solid, encapsulated mass (in intravenous contrast).
A: Non-enhanced image; B: Enhanced image (venous phase).
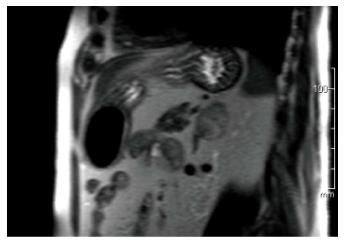
Figure 2 Coronal magnetic resonance imaging of left adrenal ganglioneuroma: A coronal T1-weighted out-of-phase image shows intracellular lipid and no signal loss within the lesion.
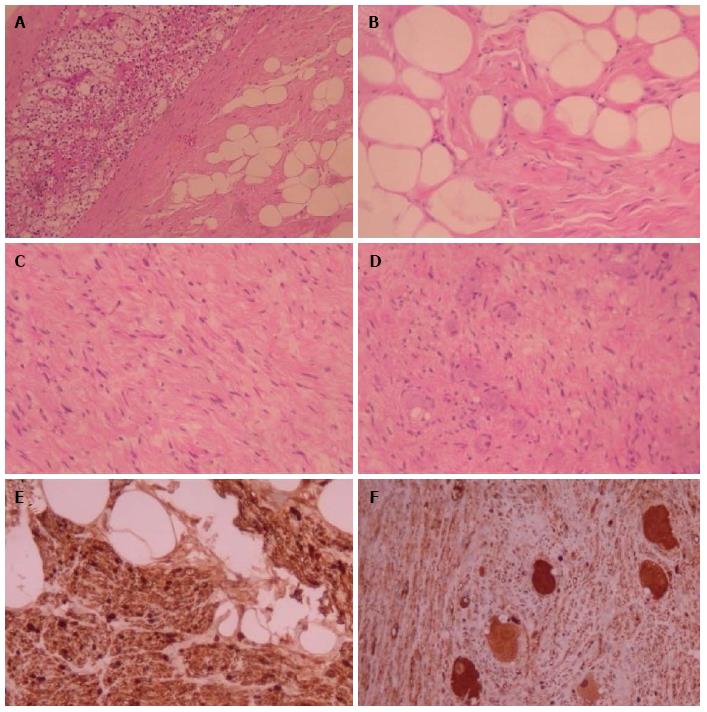
Figure 3 Histopathologic features of adrenal ganglioneuromas.
A: Margin between adrenocortical parenchyma and adrenal ganglioneuroma with Schwann cells in adipose stroma (H and E × 100); B: Schwann cells in adipose stroma (H and E × 400); C: Schwann and ganglion cells in non-adipose stroma (H and E × 200); D: Schwann cells and multiple ganglion cells (H and E × 200); E: Protein S100 (+) Schwann cells (immunostaining × 400); F: Neuron-specific enolase (+) ganglion cells (immunostaining × 200). H and E: Hematoxylin and eosin.
- Citation: Mylonas KS, Schizas D, Economopoulos KP. Adrenal ganglioneuroma: What you need to know. World J Clin Cases 2017; 5(10): 373-377
- URL: https://www.wjgnet.com/2307-8960/full/v5/i10/373.htm
- DOI: https://dx.doi.org/10.12998/wjcc.v5.i10.373


