Copyright
©The Author(s) 2016.
World J Clinical Cases. Sep 16, 2016; 4(9): 296-301
Published online Sep 16, 2016. doi: 10.12998/wjcc.v4.i9.296
Published online Sep 16, 2016. doi: 10.12998/wjcc.v4.i9.296
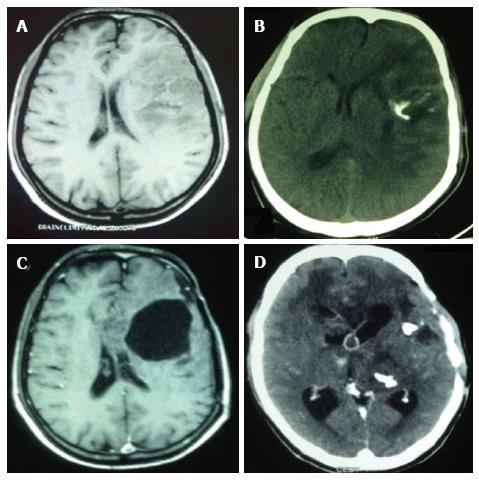
Figure 1 Radiological scans and findings before each surgical resection.
A: MRI scans at initial diagnosis suggestive of glioma; B: CT scans at first recurrence showing calcification indicative of oligo-component presence; C: MRI scans just before third surgical intervention; D: CT scans before last resection confirming increased calcification. MRI: Magnetic resonance imaging; CT: Computed tomography.
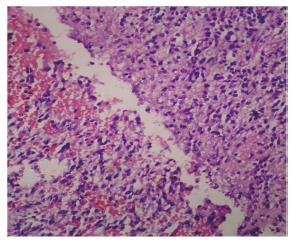
Figure 2 Perinuclear halo and honeycomb appearance in oligodendroglial component.
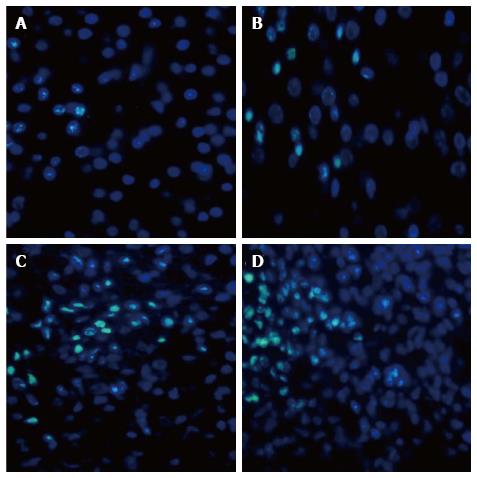
Figure 3 Florescence based immunohistochemistry for analysis and interpretation of human telomerase reverse transcriptase expression.
A: Expression of marker in the first resected sample (grade II); B: Signal intensity of the marker at first recurrence (grade II); C: Increased hTERT expression at second recurrence (grade II); D: Intense immune-reactivity at confined foci in last surgical sample resected classified as histopathological grade III. hTERT: Human telomerase reverse transcriptase.
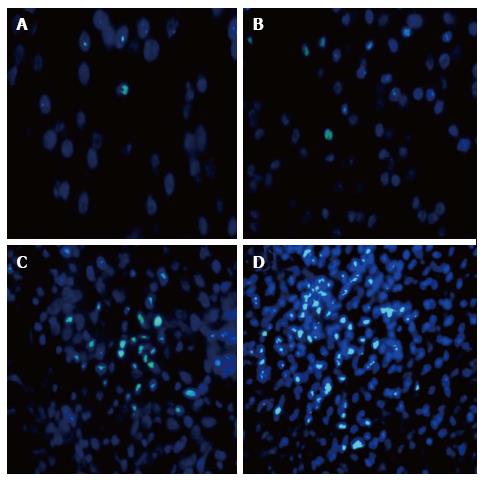
Figure 4 The figure depicts differential high mobility group-A1 immunostaining.
A: Minimal immune-expression in initial sample (grade II); B: At first recurrence (grade II); C: Increased signal intensity of the marker in sample from second recurrence (grade II); D: HMGA1 expression highly up-regulated with progression to histopathological grade III. HMGA1: High mobility group-A1.
- Citation: Gandhi P, Khare R, Niraj K, Garg N, Sorte SK, Gulwani H. Unique case of oligoastrocytoma with recurrence and grade progression: Exhibiting differential expression of high mobility group-A1 and human telomerase reverse transcriptase. World J Clinical Cases 2016; 4(9): 296-301
- URL: https://www.wjgnet.com/2307-8960/full/v4/i9/296.htm
- DOI: https://dx.doi.org/10.12998/wjcc.v4.i9.296


