Copyright
©The Author(s) 2016.
World J Clin Cases. Aug 16, 2016; 4(8): 243-247
Published online Aug 16, 2016. doi: 10.12998/wjcc.v4.i8.243
Published online Aug 16, 2016. doi: 10.12998/wjcc.v4.i8.243
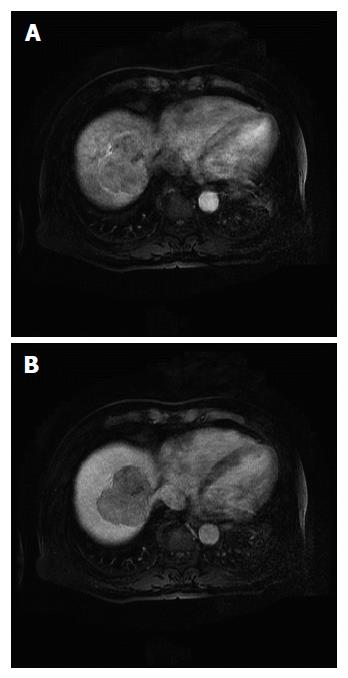
Figure 1 Dynamic liver magnetic resonance image showing a 6.
8-cm solid mass in segments 8 and 7. A: Image obtained in the arterial phase, showing a lobulated enhancing mass; B: Image obtained in the portal phase, showing the mass evolving into a low-density mass.
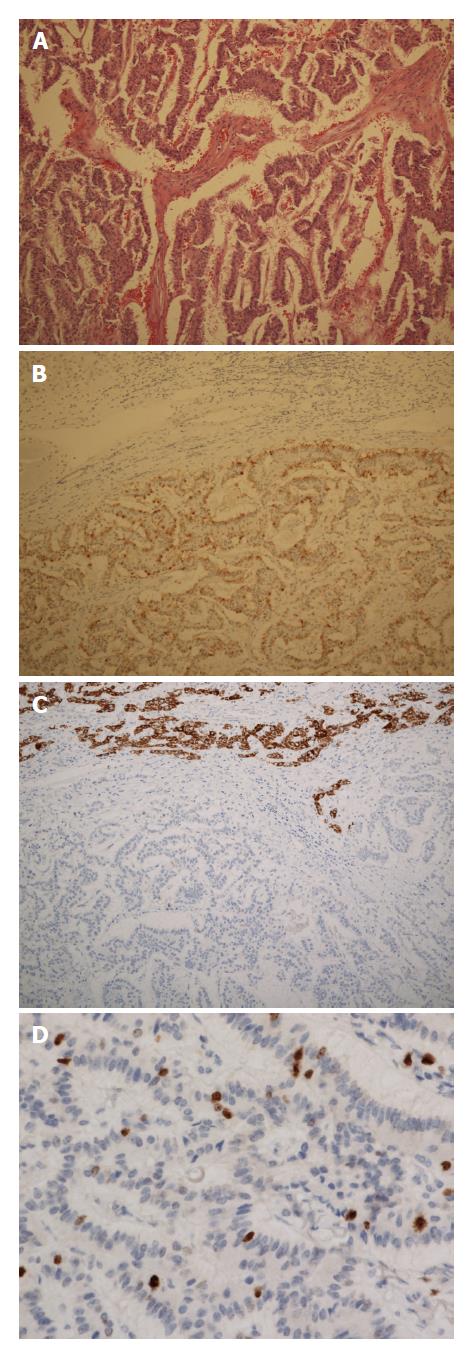
Figure 2 Pathological findings.
A: Microscopic appearance of the tumoral lesion in the resected liver specimen. The architectural pattern is trabecular and glandular. Hematoxylin-eosin staining × 100; B: Diffuse, moderate immunoreactivity for chromogranin in the tumor cells. Immunohistochemical (IHC) staining, × 100; C: Negative immunoreactivity for Heppar-1 in tumor cells, and positive immunoreactivity occurs in normal hepatic cells. IHC staining, original magnification × 100; D: The Ki67 proliferation index is 10% in tumor cells. IHC staining, original magnification × 400.
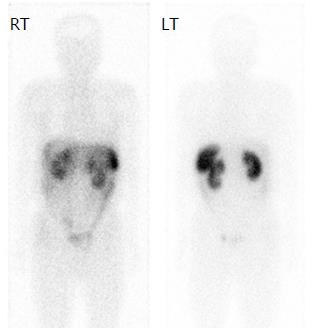
Figure 3 Single-photon emission computed tomographic images obtained 24 h after the administration of indium-111 octreotide.
Both the anterior and posterior whole body images show, no abnormal lesions with increased uptake. RT: Right; LT: Left.
- Citation: Song JE, Kim BS, Lee CH. Primary hepatic neuroendocrine tumor: A case report and literature review. World J Clin Cases 2016; 4(8): 243-247
- URL: https://www.wjgnet.com/2307-8960/full/v4/i8/243.htm
- DOI: https://dx.doi.org/10.12998/wjcc.v4.i8.243


