Copyright
©The Author(s) 2015.
World J Clin Cases. Feb 16, 2015; 3(2): 186-190
Published online Feb 16, 2015. doi: 10.12998/wjcc.v3.i2.186
Published online Feb 16, 2015. doi: 10.12998/wjcc.v3.i2.186
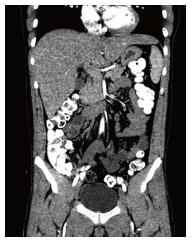
Figure 1 Computed tomography abdomen and pelvis prior to chemotherapy showing multiple small low attenuation nodules throughout the entire liver parenchyma.
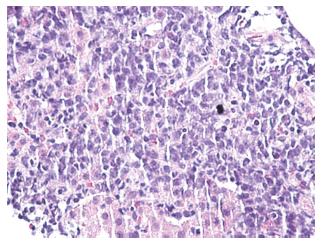
Figure 2 Liver biopsy showing diffuse large B-cell lymphomatous infiltrate.
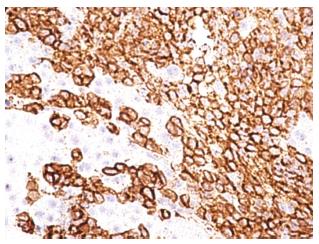
Figure 3 Immunohistochemical stain of liver specimen showing the lymphoma cells are strongly immunoreactive to CD 20.
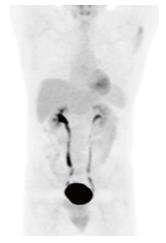
Figure 4 Maximum intensity projection of positron emission tomography/ computed tomography scan at 11 mo after the last cycle of chemotherapy showing no hypermetabolic lesions in the liver.
- Citation: Widjaja D, AlShelleh M, Daniel M, Skaradinskiy Y. Complete remission of primary hepatic lymphoma in a patient with human immunodeficiency virus. World J Clin Cases 2015; 3(2): 186-190
- URL: https://www.wjgnet.com/2307-8960/full/v3/i2/186.htm
- DOI: https://dx.doi.org/10.12998/wjcc.v3.i2.186


