Copyright
©The Author(s) 2015.
World J Clin Cases. Dec 16, 2015; 3(12): 1000-1004
Published online Dec 16, 2015. doi: 10.12998/wjcc.v3.i12.1000
Published online Dec 16, 2015. doi: 10.12998/wjcc.v3.i12.1000
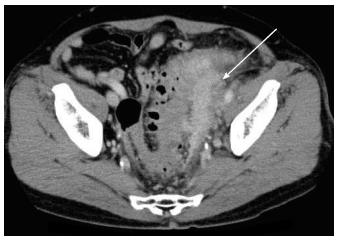
Figure 1 Follow-up computed tomography.
Computed tomography shows an ill-demarcated intrapelvic mass lesion extending to the left lower ureter, left margin of the bladder, and sigmoid colon, as denoted by arrow.
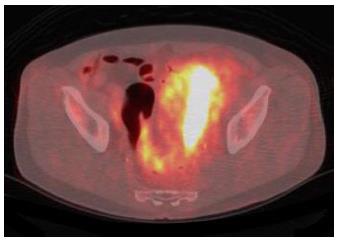
Figure 2 18F-fluorodeoxyglucose positron emission tomography for screening.
18F-fluorodeoxyglucose positron emission tomography shows strong uptake around the left lower ureter.
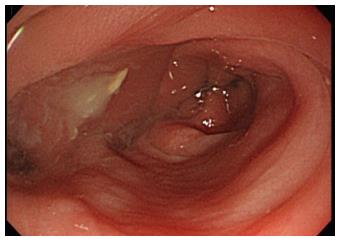
Figure 3 Colonoscopy for screening.
Colonoscopy shows a severe extrinsic compression.
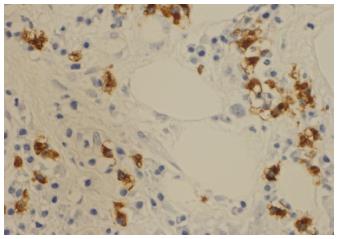
Figure 4 Immunohistochemical analysis of resected specimen.
More than 10 IgG4 positive cells are distributed per high-power field.
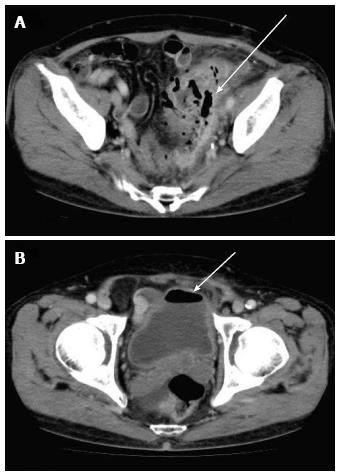
Figure 5 Computed tomography one month after the initiation of glucocorticoid therapy.
Computed tomography shows shrinkage of the mass and extraluminal air in the mass (A) and in the bladder (B), as denoted by arrow.
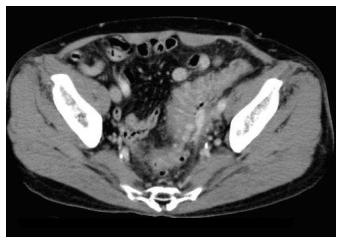
Figure 6 Computed tomography 6 mo after the initiation of glucocorticoid therapy.
Computed tomography shows that the mass remains minimized.
- Citation: Yabuuchi Y, Matsubayashi H, Matsuzaki M, Shiomi A, Moriguchi M, Kawamura I, Ito I, Ono H. Colovesical fistula caused by glucocorticoid therapy for IgG4-related intrapelvic mass. World J Clin Cases 2015; 3(12): 1000-1004
- URL: https://www.wjgnet.com/2307-8960/full/v3/i12/1000.htm
- DOI: https://dx.doi.org/10.12998/wjcc.v3.i12.1000


