Copyright
©2014 Baishideng Publishing Group Inc.
World J Clin Cases. Sep 16, 2014; 2(9): 439-447
Published online Sep 16, 2014. doi: 10.12998/wjcc.v2.i9.439
Published online Sep 16, 2014. doi: 10.12998/wjcc.v2.i9.439
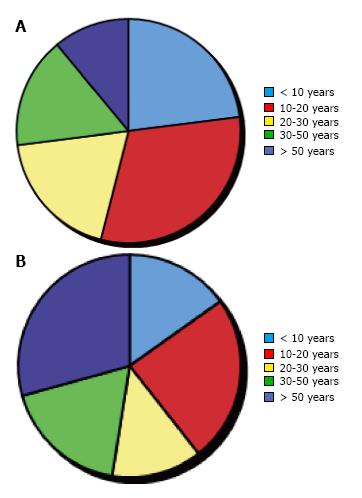
Figure 1 Percentage distribution by age.
A: Percentage distribution by age of people visiting the dentist; B: Percentage distribution by age of people needing dental treatment according to urgency of need.
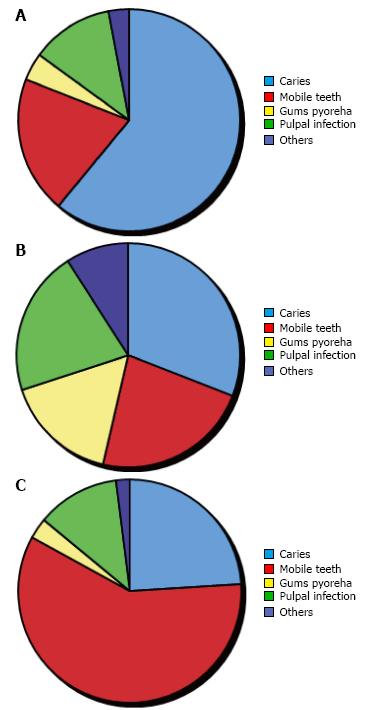
Figure 2 Percentage distribution.
A: Percentage distribution of children < 20 year of age with the following diseases or dental ailments; B: Percentage distribution of people between 20-50 years of age with the following diseases or dental ailments; C: Percentage distribution of people over 50 years of age with the following diseases or dental ailments.
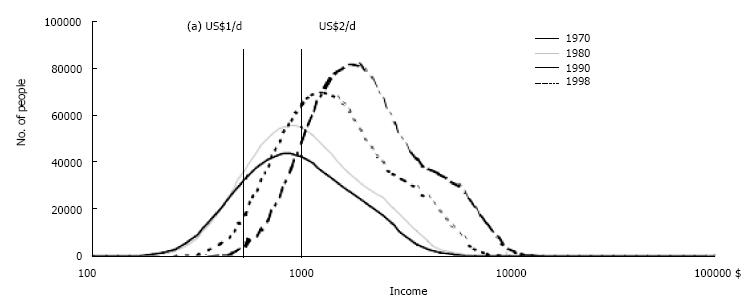
Figure 3 Income distribution in India
- Citation: Sugandhi A, Mangal B, Mishra AK, Sethia B. To explore and develop a model to maintain and build upon a dental clinic open for all in developing regions, with a primary focus on India. World J Clin Cases 2014; 2(9): 439-447
- URL: https://www.wjgnet.com/2307-8960/full/v2/i9/439.htm
- DOI: https://dx.doi.org/10.12998/wjcc.v2.i9.439


