Copyright
©2014 Baishideng Publishing Group Inc.
World J Clin Cases. Jul 16, 2014; 2(7): 272-278
Published online Jul 16, 2014. doi: 10.12998/wjcc.v2.i7.272
Published online Jul 16, 2014. doi: 10.12998/wjcc.v2.i7.272
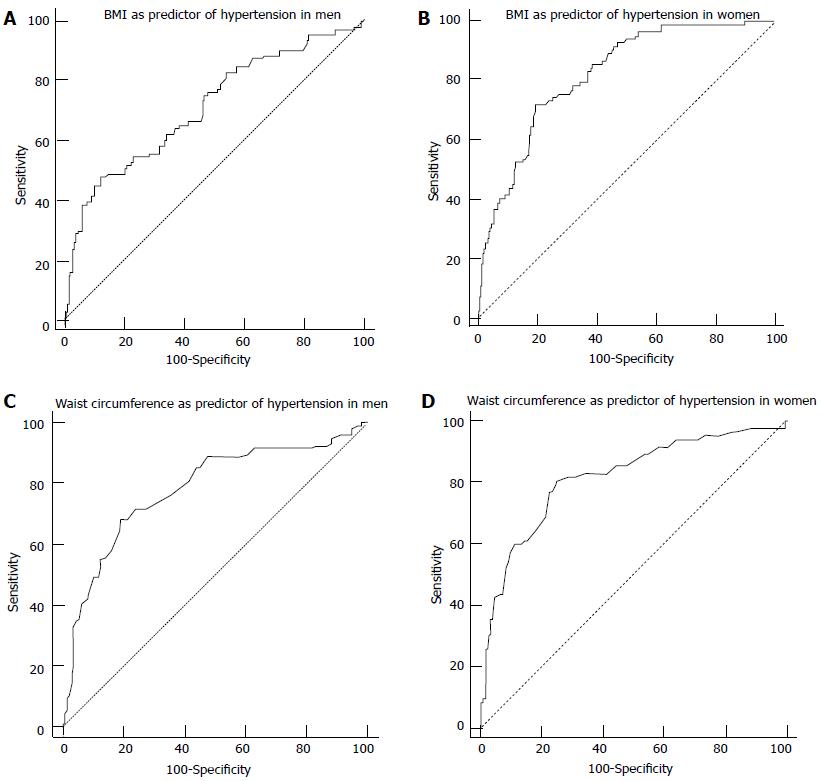
Figure 1 Criterion values and coordinates of the receiver operating characteristic curve.
A: Receiver operating characteristic (ROC) analysis for body mass index (BMI) as a predictor of hypertension among men revealed area under the curve = 0.714. The optimal cut-off for maximum sensitivity and specificity was 24.5; B: ROC analysis for BMI as a predictor of hypertension among women revealed area under the curve = 0.821. The optimal cut-off for maximum sensitivity and specificity was 24.9; C: ROC analysis for waist circumference as a predictor of hypertension among men revealed area under the curve = 0.784. The optimal cut-off for maximum sensitivity and specificity was 83; D: ROC analysis for waist circumference as a predictor of hypertension among women revealed area under the curve = 0.815. The optimal cut-off for maximum sensitivity and specificity was 78.
- Citation: Midha T, Krishna V, Nath B, Kumari R, Rao YK, Pandey U, Kaur S. Cut-off of body mass index and waist circumference to predict hypertension in Indian adults. World J Clin Cases 2014; 2(7): 272-278
- URL: https://www.wjgnet.com/2307-8960/full/v2/i7/272.htm
- DOI: https://dx.doi.org/10.12998/wjcc.v2.i7.272


