Copyright
©2014 Baishideng Publishing Group Inc.
World J Clin Cases. Oct 16, 2014; 2(10): 552-564
Published online Oct 16, 2014. doi: 10.12998/wjcc.v2.i10.552
Published online Oct 16, 2014. doi: 10.12998/wjcc.v2.i10.552
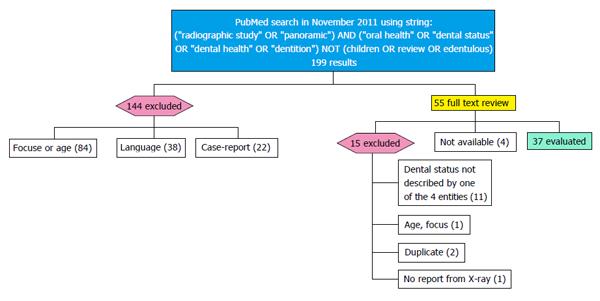
Figure 1 Flow chart of review strategy and finally evaluated articles: The flow chart shows the systematic exclusion of search results towards the finally evaluated studies.
The primary reasons for exclusion are mentioned including the number of concerned articles.
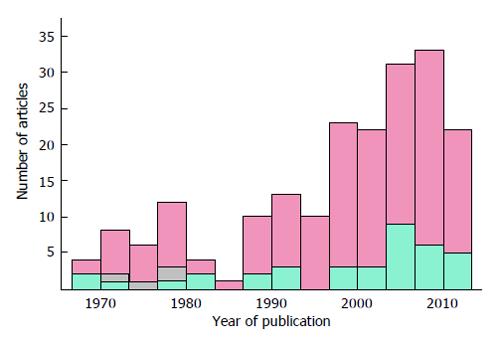
Figure 2 Distribution of included and excluded articles: Distribution of the 37 evaluated (green) and 159 excluded (red) studies of the search results ordered by their date of publication.
Shaded fractions represent the 4 articles which were not available as full text version.
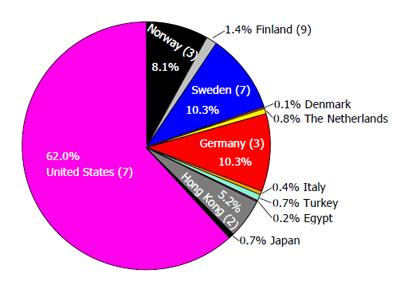
Figure 3 Shares of patients in the 37 evaluated studies with respect to the country of origin: The number of contributing studies is noted in brackets behind the country.
Preponderance of United States is due to two reports of “mass X-ray evaluation” in the years 1977 and 1982. If these two are left out of consideration the median value of studied subjects in a paper is 212 (mean = 485).
- Citation: Huettig F, Axmann D. Reporting of dental status from full-arch radiographs: Descriptive analysis and methodological aspects. World J Clin Cases 2014; 2(10): 552-564
- URL: https://www.wjgnet.com/2307-8960/full/v2/i10/552.htm
- DOI: https://dx.doi.org/10.12998/wjcc.v2.i10.552


