Copyright
©The Author(s) 2025.
World J Clin Cases. Feb 26, 2025; 13(6): 95513
Published online Feb 26, 2025. doi: 10.12998/wjcc.v13.i6.95513
Published online Feb 26, 2025. doi: 10.12998/wjcc.v13.i6.95513
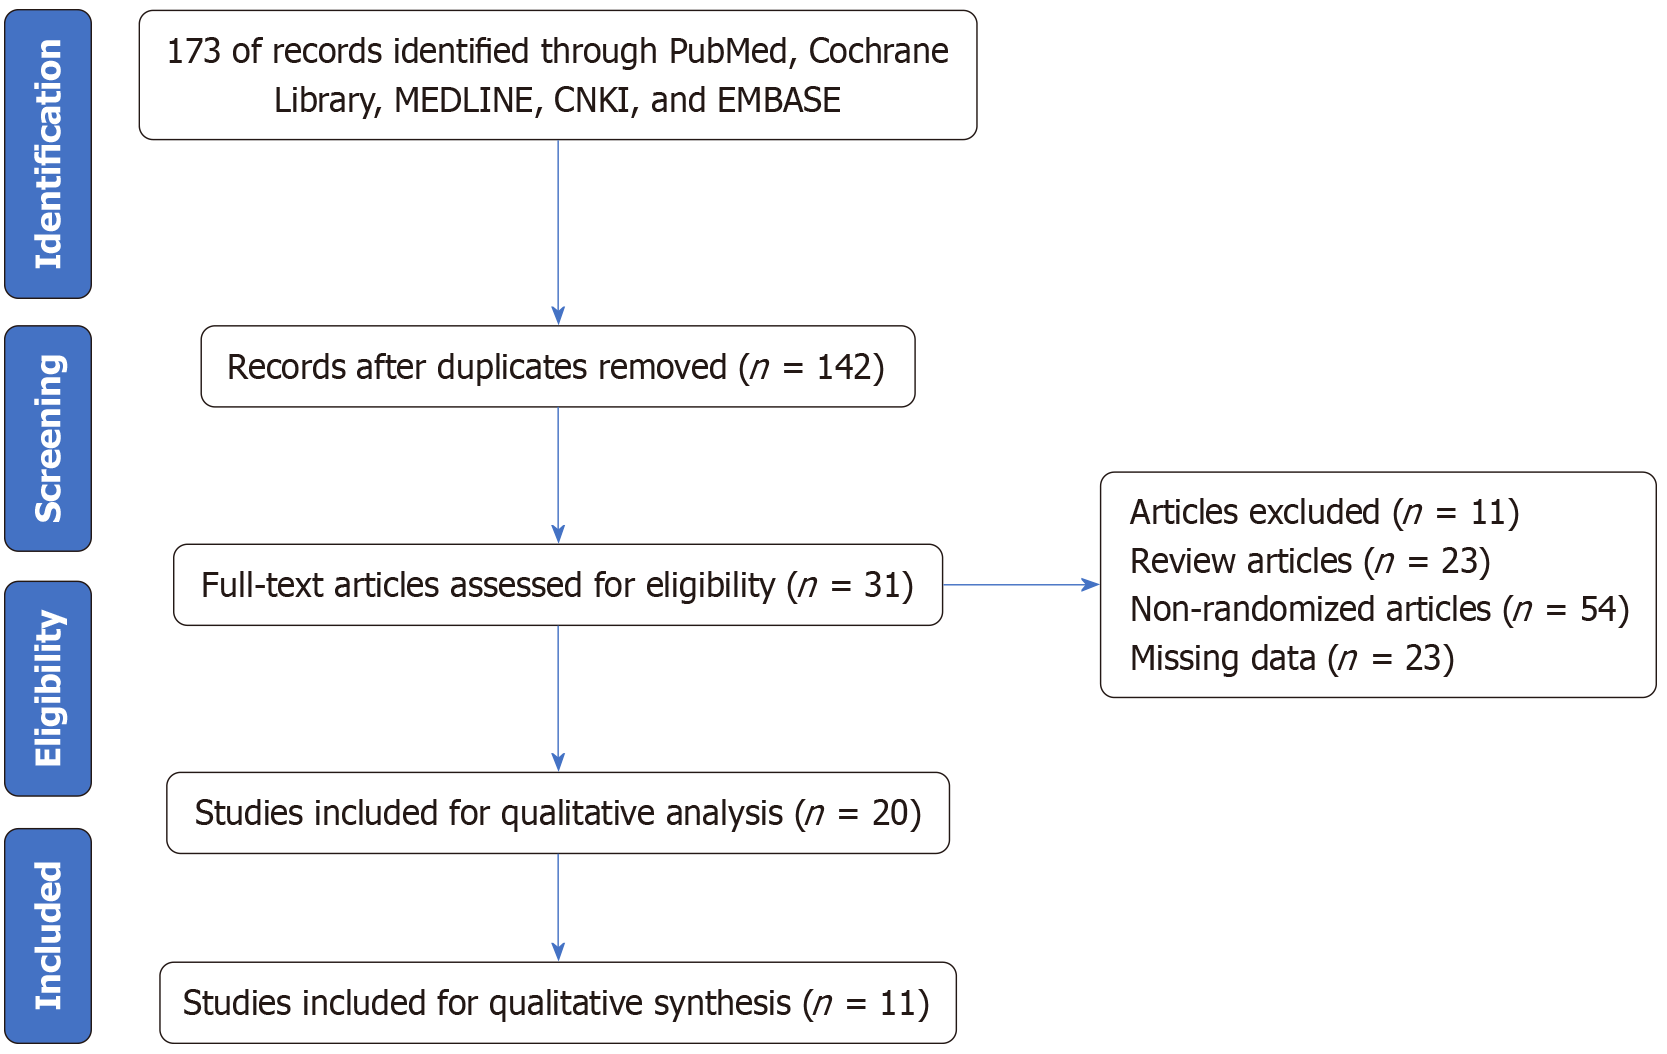
Figure 1 Flow diagram of study inclusion process.
CNKI: China National Knowledge Infrastructure.
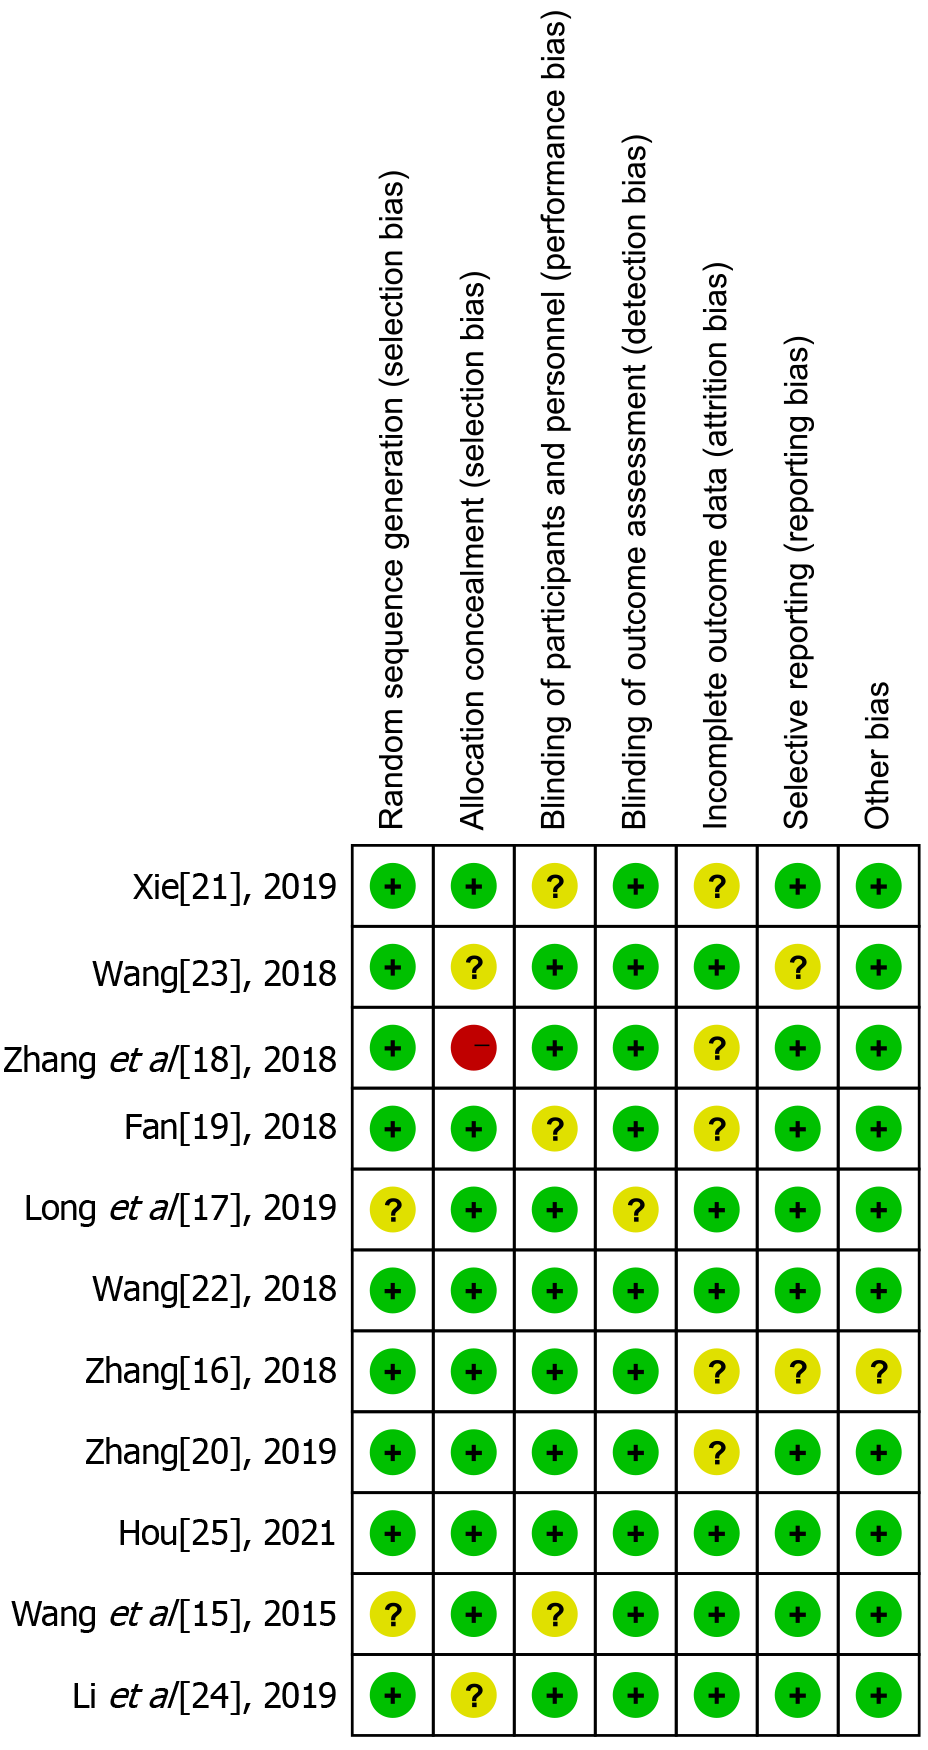
Figure 2 Risk of bias graph.
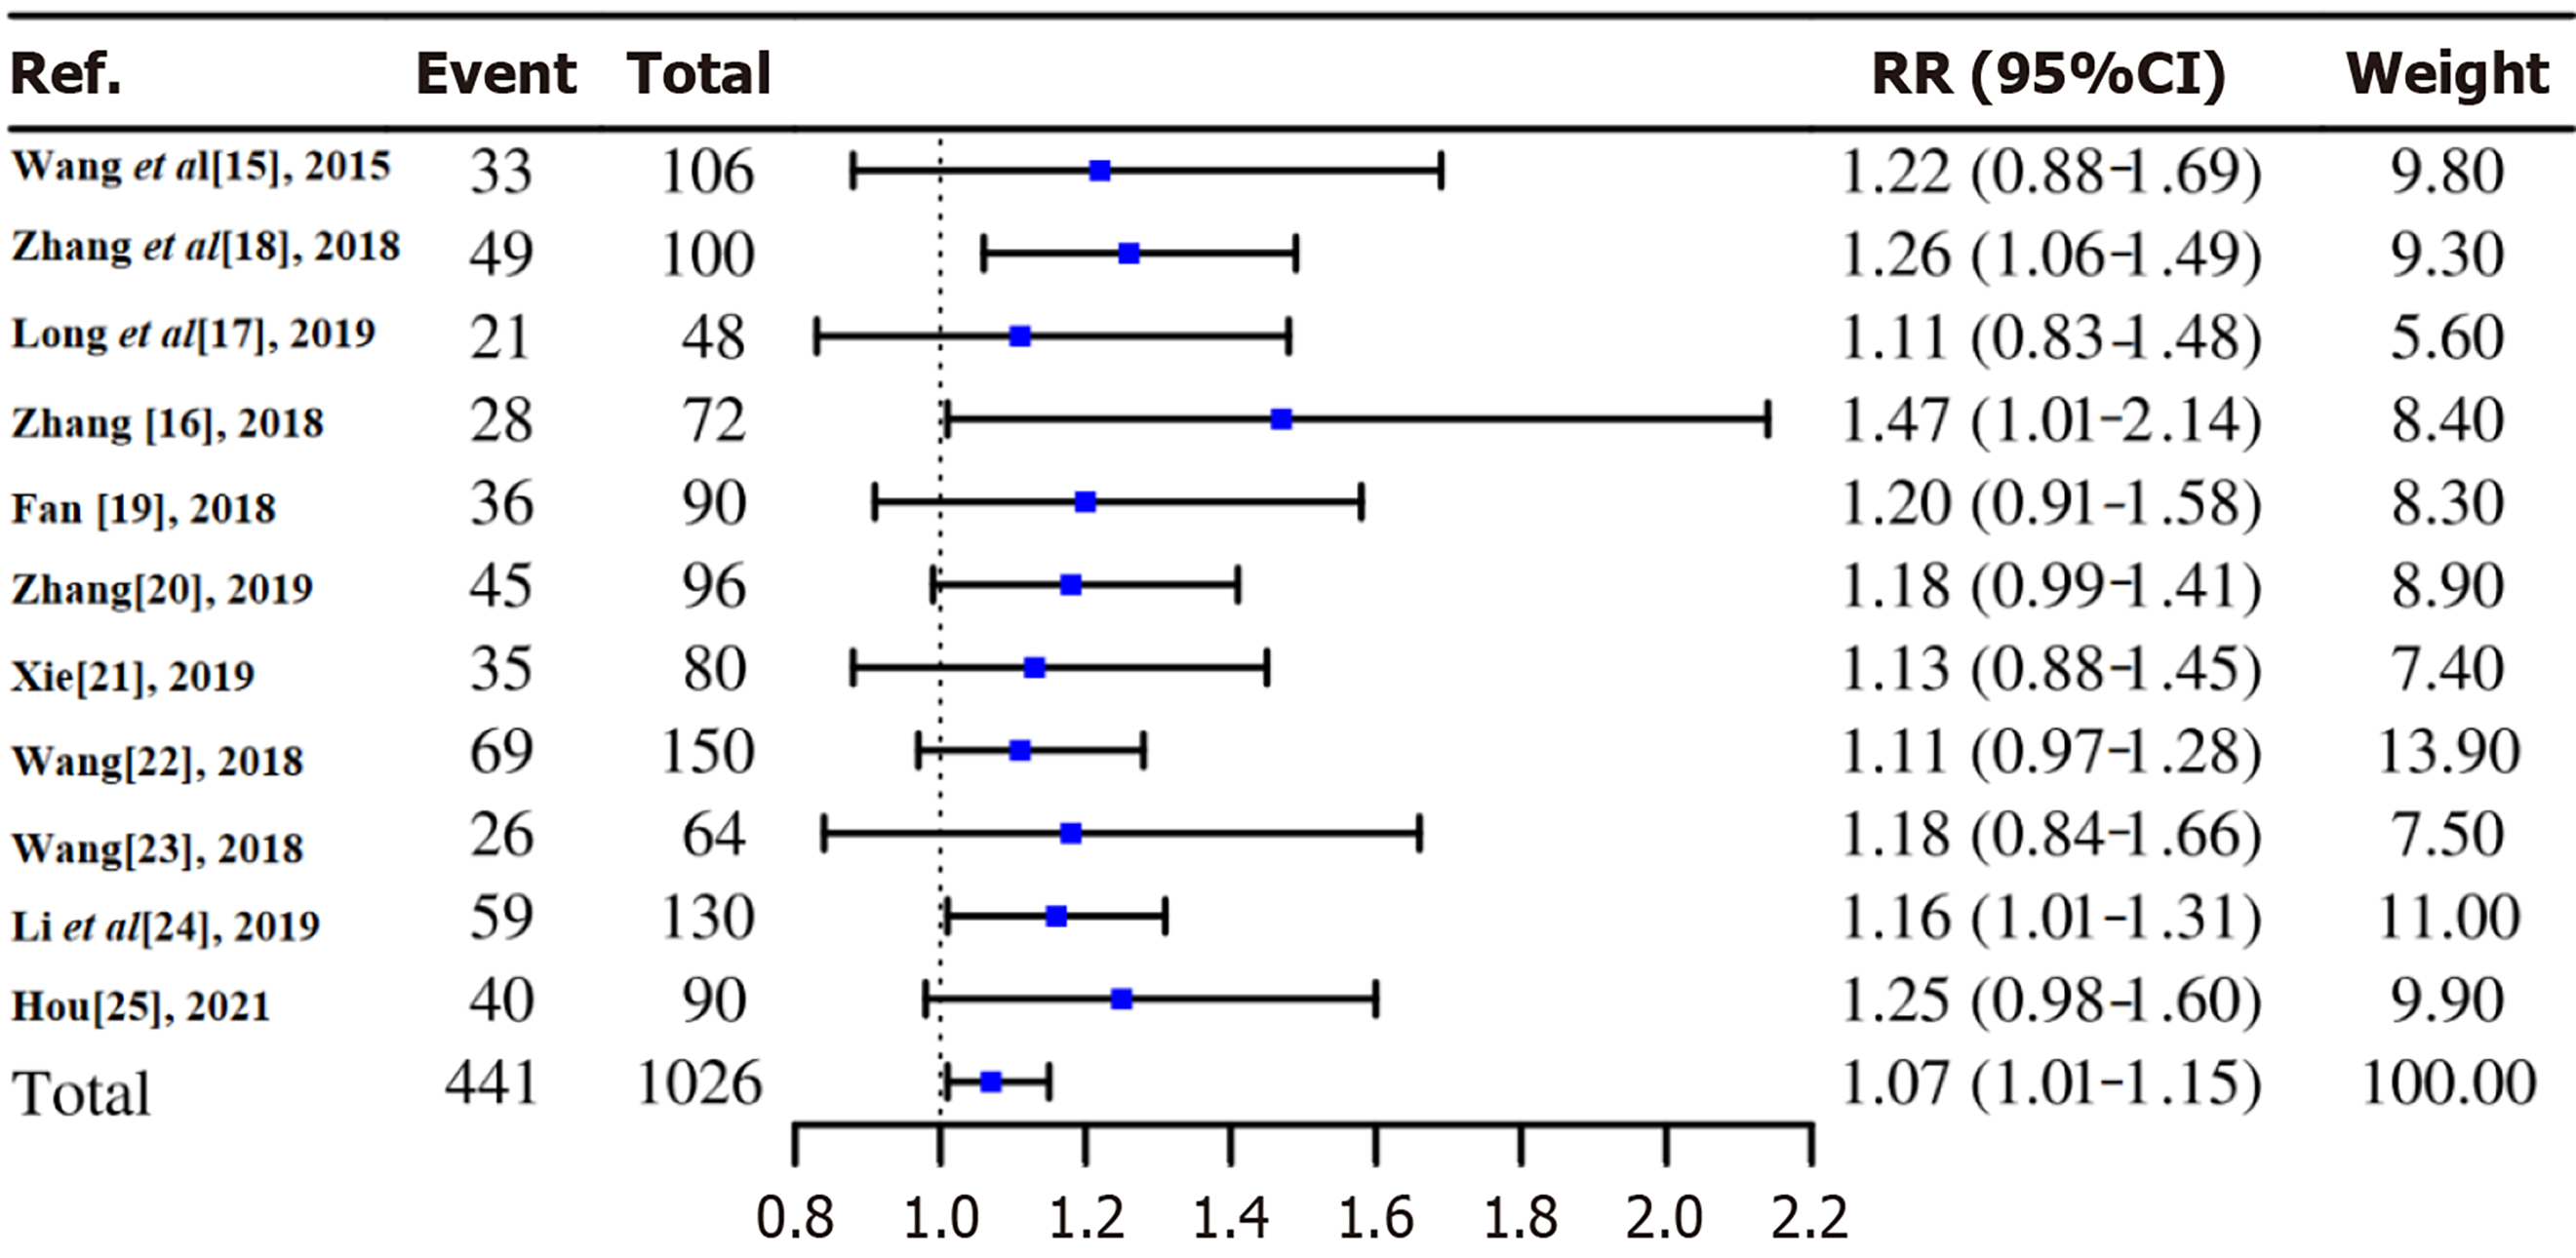
Figure 3 Forest plot of total efficacy.
RR: Relative risk.
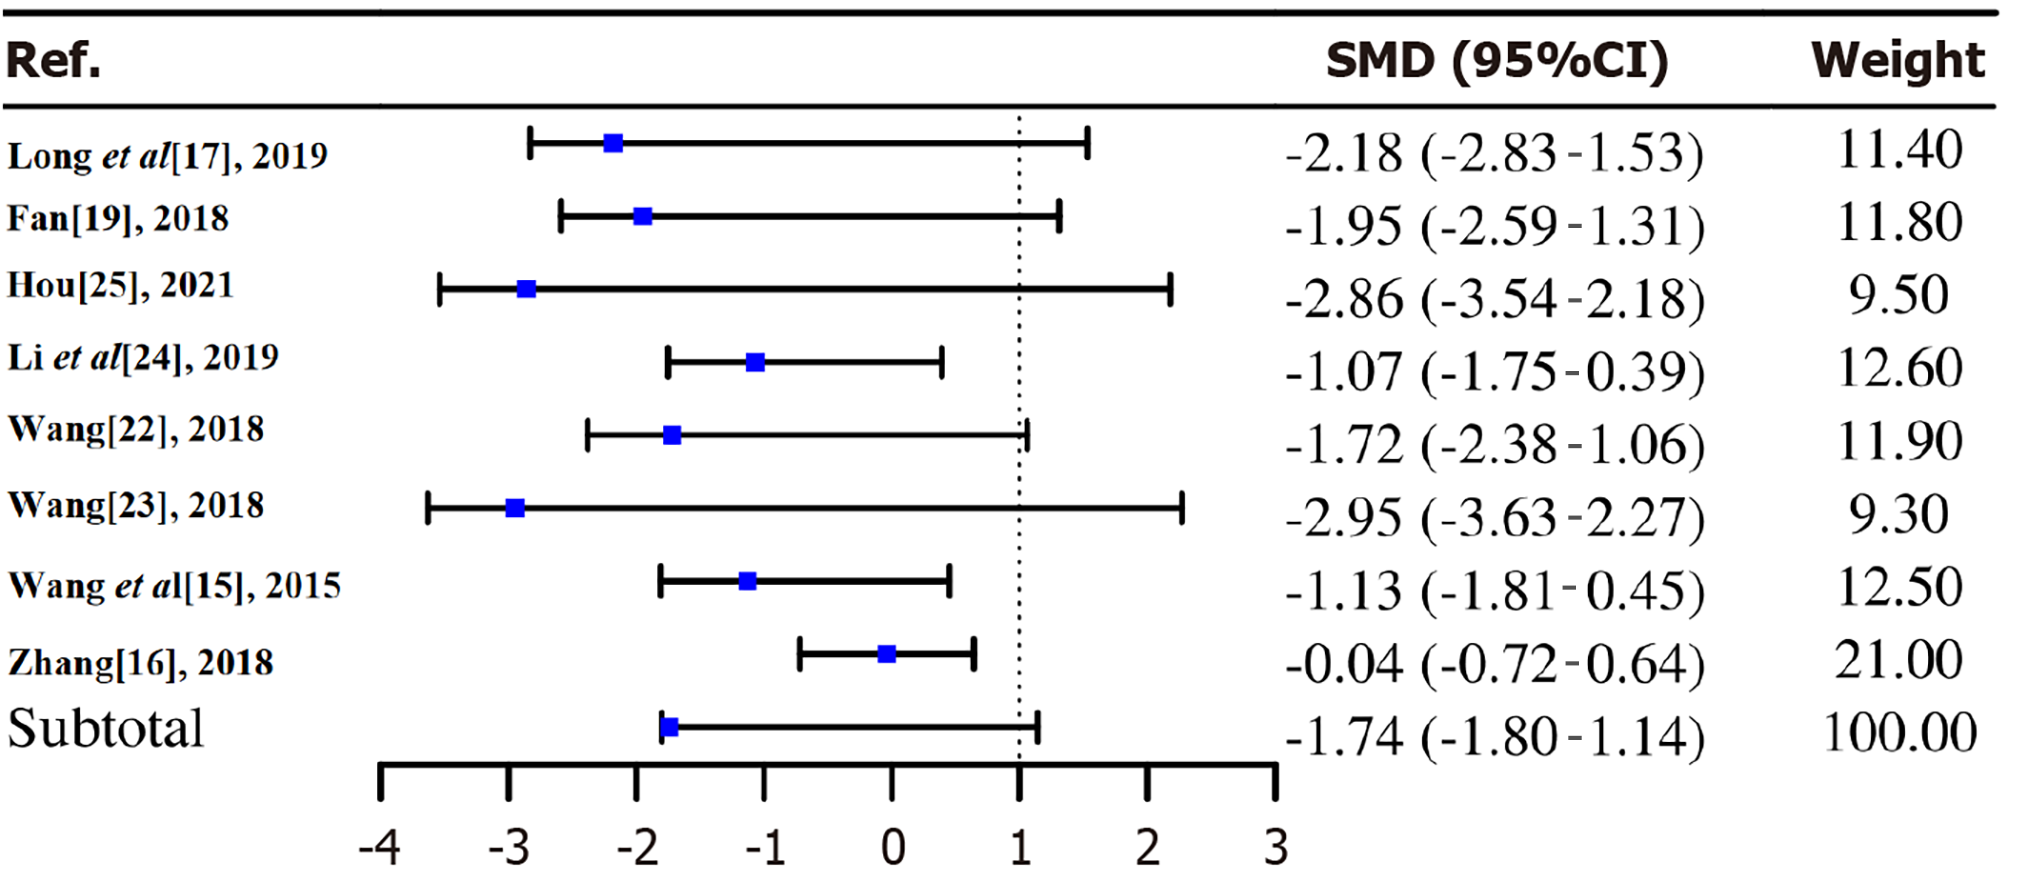
Figure 4 Forest plot of visual analog scale score.
- Citation: Shu H, Chen XY, Zhao J, Li P, Sun Z. Efficacy and safety of Tripterygium wilfordii glycosides tablets combined with Western medicine for patients with rheumatic immune diseases. World J Clin Cases 2025; 13(6): 95513
- URL: https://www.wjgnet.com/2307-8960/full/v13/i6/95513.htm
- DOI: https://dx.doi.org/10.12998/wjcc.v13.i6.95513


