Copyright
©The Author(s) 2025.
World J Clin Cases. Jan 26, 2025; 13(3): 99558
Published online Jan 26, 2025. doi: 10.12998/wjcc.v13.i3.99558
Published online Jan 26, 2025. doi: 10.12998/wjcc.v13.i3.99558
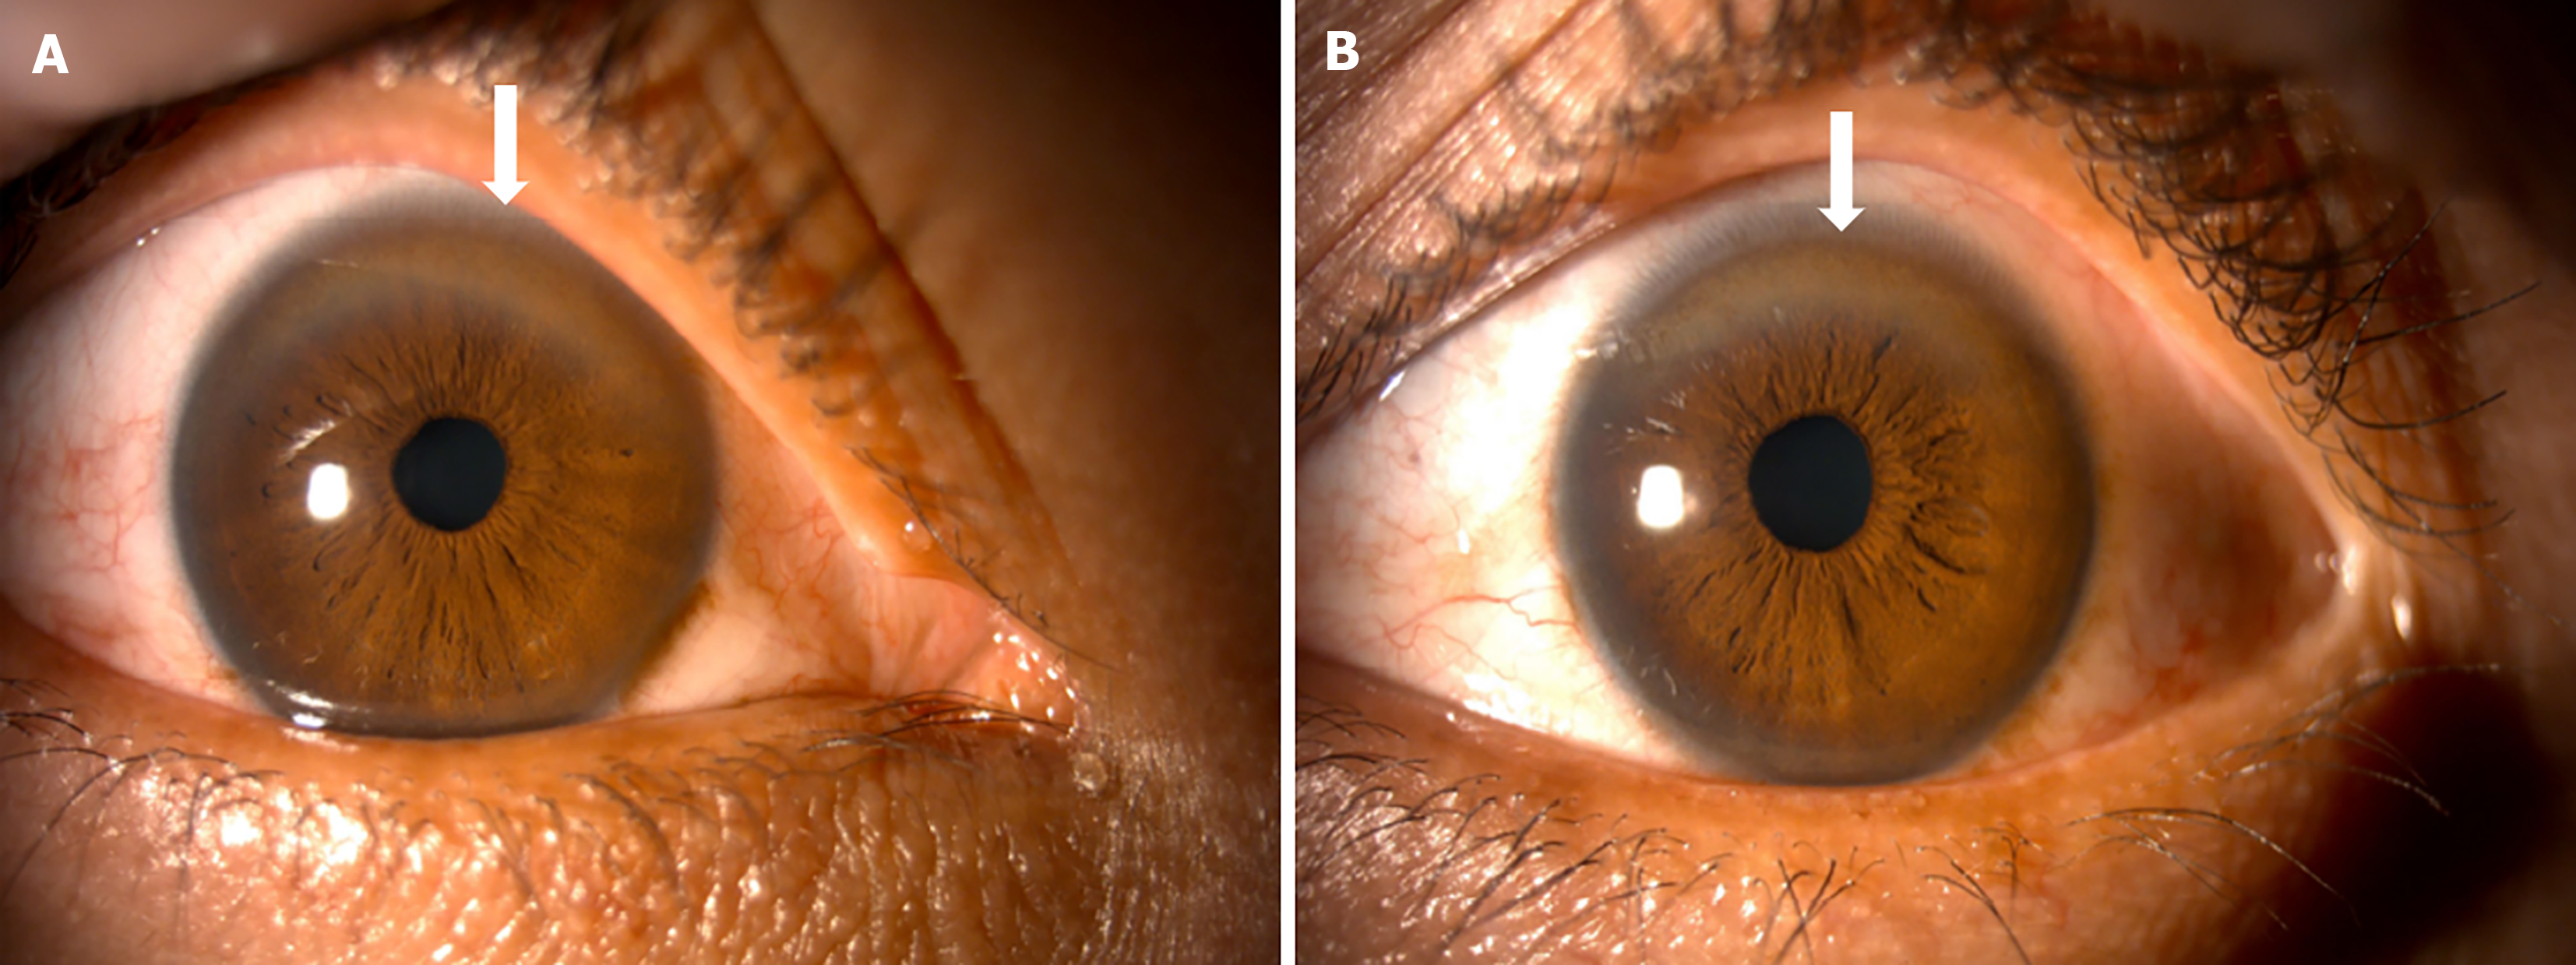
Figure 1 Kayser-Fleischer rings in Wilson’s Disease.
A: Right eye of Case 1; B: Left eye of Case 1 Kayser-Fleischer rings, considered pathognomonic for Wilson's disease, are visible as copper deposits on the superior portion of the corneal periphery upon slit-lamp examination (white arrows). These rings result from copper deposition on Descemet's membrane and typically appear as a brown or golden pigment.
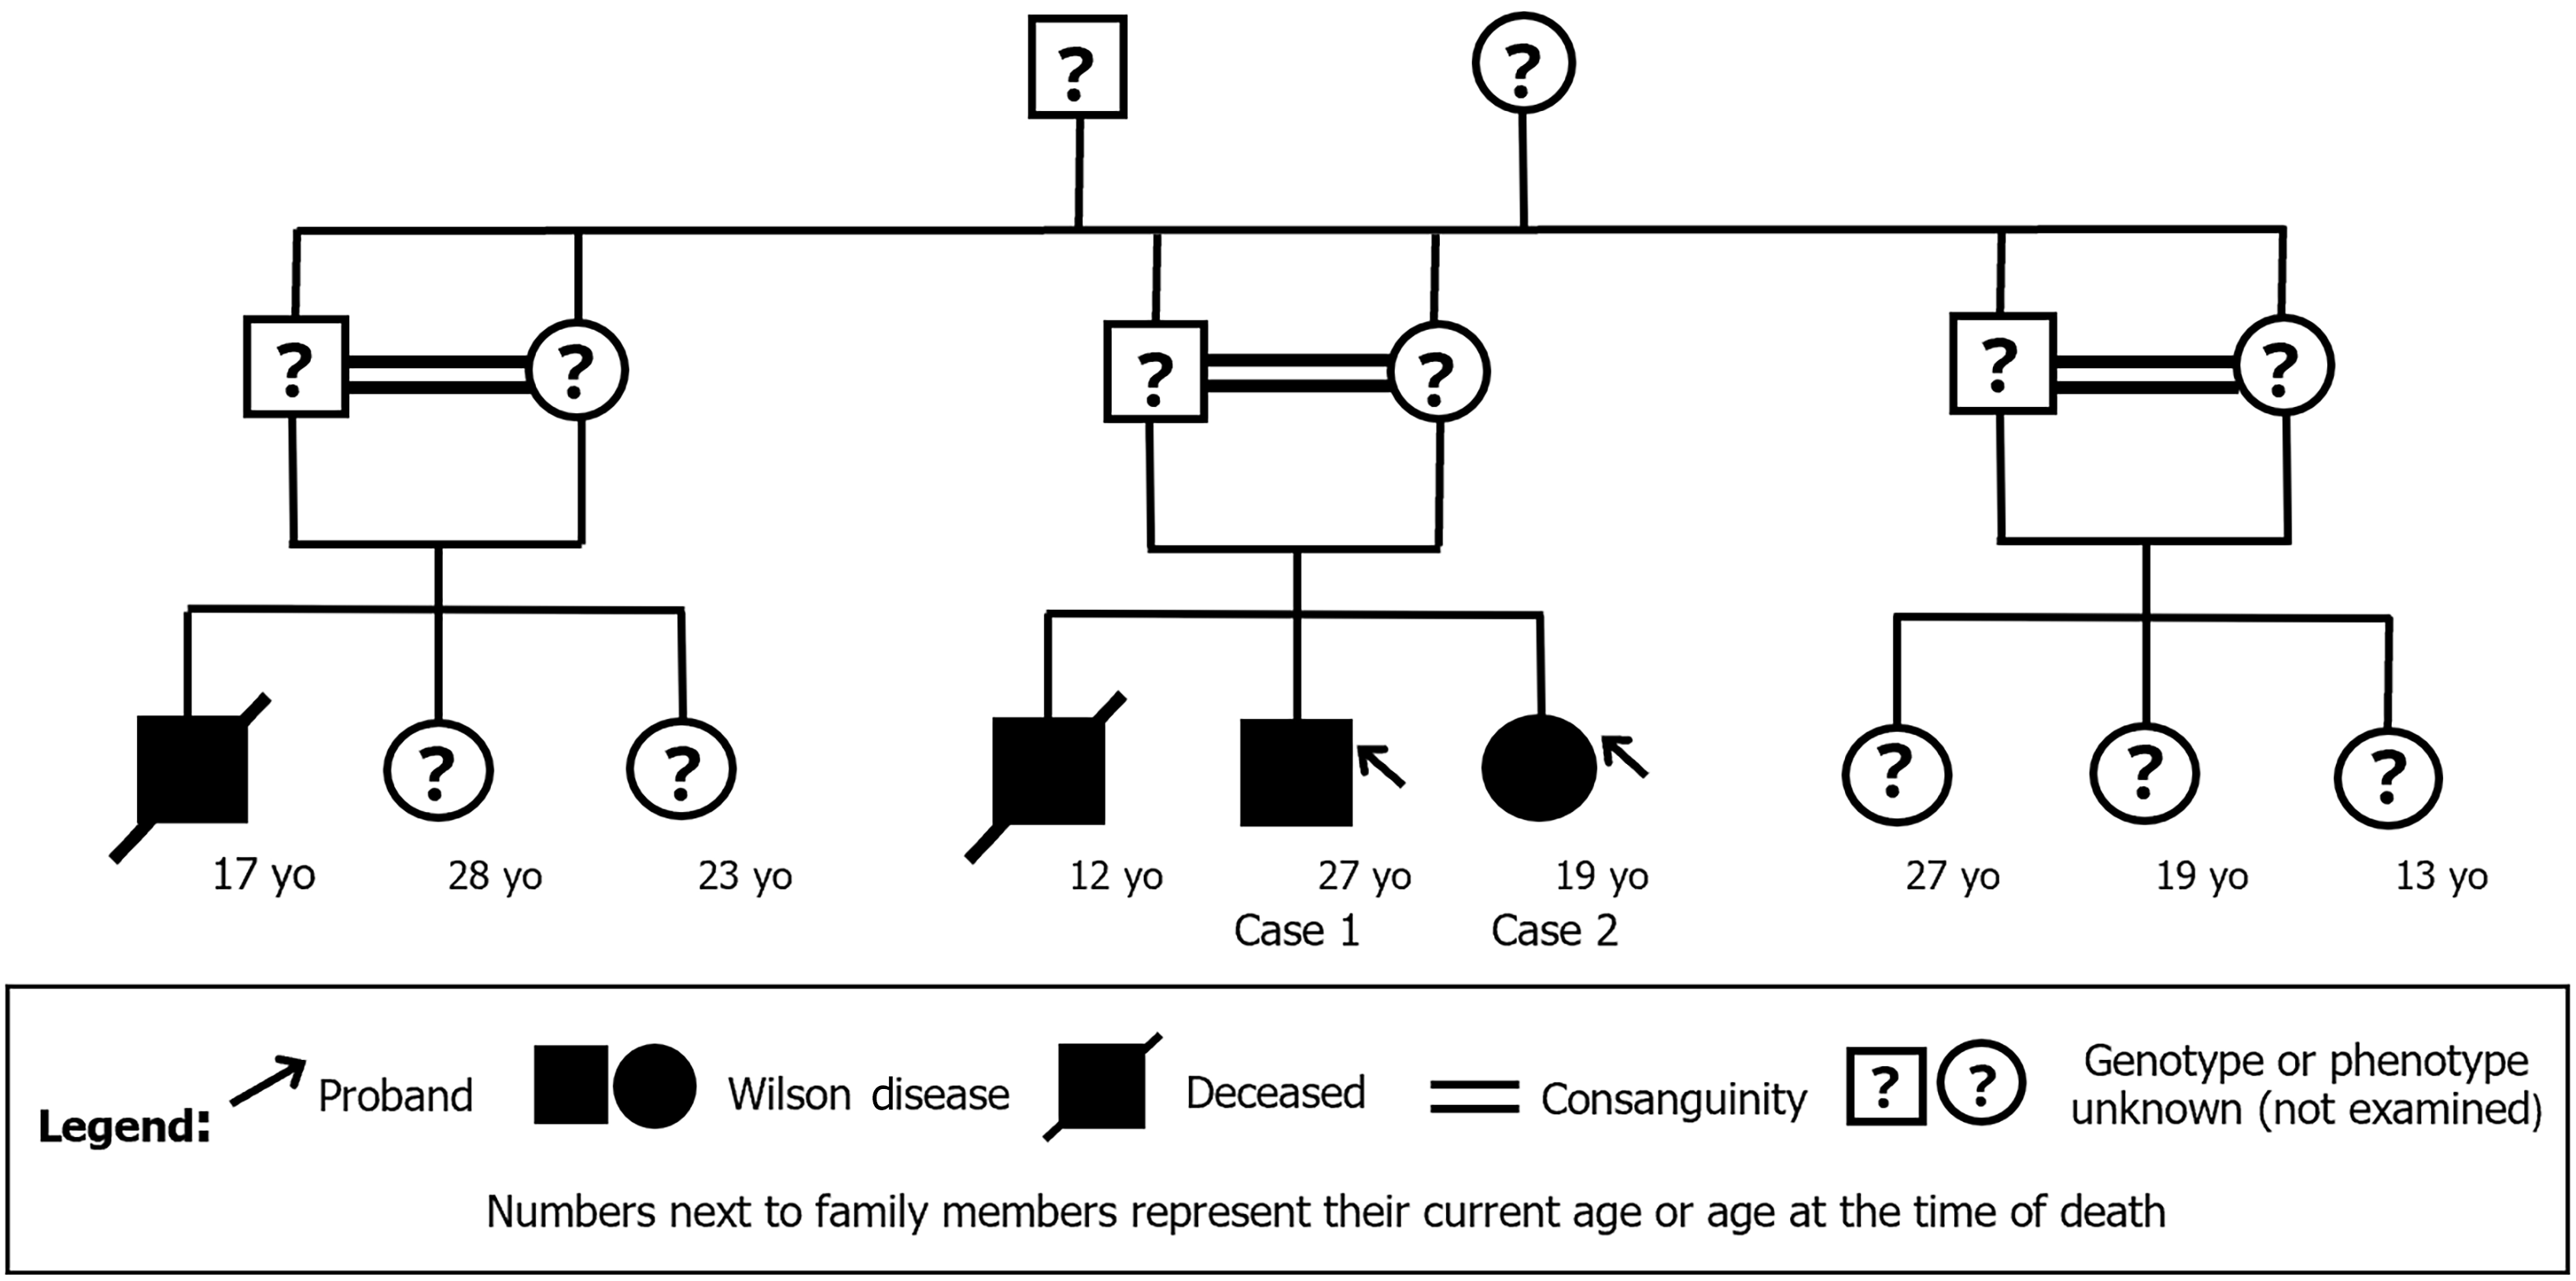
Figure 2 Family pedigree of two siblings affected by Wilson's disease.
An arrow indicates the probands in this family. Solid circles and squares represent confirmed cases of Wilson’s disease. 'Case 1' and 'Case 2' are labeled beneath the respective individuals. Squares with diagonal lines represent deceased individuals. Consanguinity between parents is represented by the equal sign. A question mark within a symbol indicates unknown genotype or phenotype (not examined). Numbers next to family members represent their current age or age at the time of death.
Figure 3 The 'double panda' sign in magnetic resonance imaging of Case 1.
A: Fluid-attenuation inversion recovery (FLAIR) magnetic resonance imaging (MRI) scan with an axial section view at the level of the midbrain exhibits the classic 'giant panda' sign (orange arrow), where the mesencephalic tegmentum shows increased T2 signal intensity, highlighting the contrast of the substantia nigra, corresponding to the ‘bear ears’, as well as the red nuclei, corresponding to the ‘bear eyes’; B: Image of the giant panda (Ailuropoda melanoleuca), licensed under creative commons; C: Image of the red panda (Ailurus fulgens), licensed under creative commons; D: FLAIR MRI scan with an axial section at the pons level shows the ‘small panda’ sign (orange arrow) in the pontine tegmentum, where increased T2 signal intensity allows better differentiation of the medial longitudinal fasciculi and central tegmental tracts, representing the ‘eyes of the bear’, and the superior angle of the fourth ventricle represents the ‘nose of the bear’.
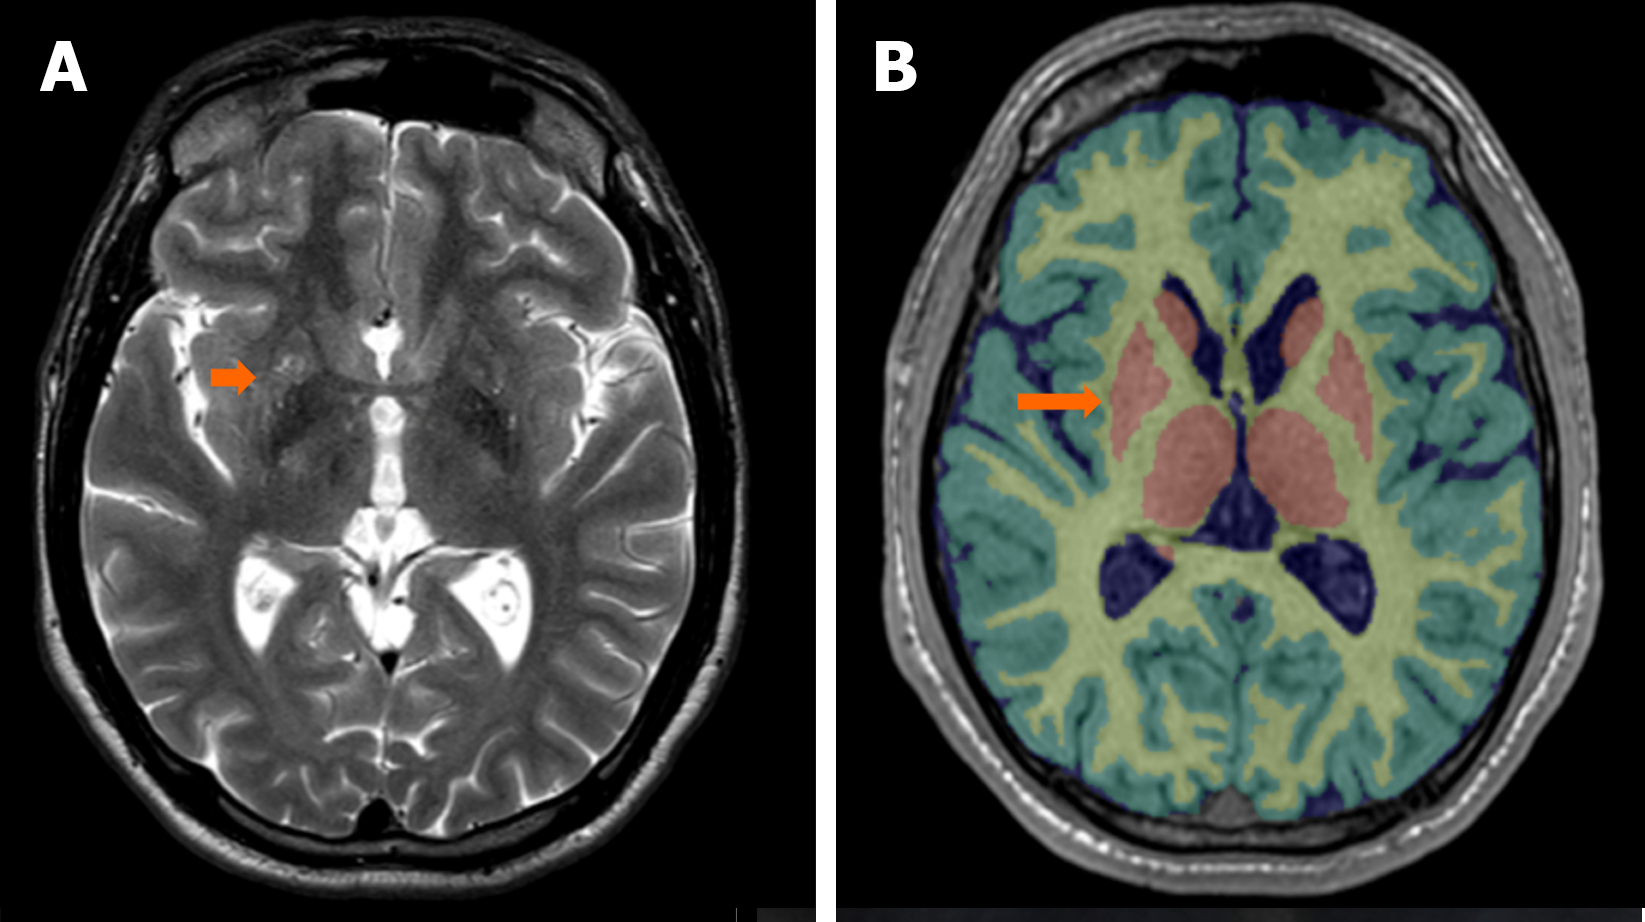
Figure 4 Encephalic atrophic changes in magnetic resonance imaging of Case 1.
A: T2-turbo spin-echo magnetic resonance imaging scan with an axial section view at the level of the anterior commissure. Findings are consistent with multiple diffuse T2 hyperintensities in the lentiform and caudate nuclei. The orange arrow indicates the right lenticular nucleus; B: A magnetic resonance imaging with automated analysis of T1-3D sequence shows pathological findings in the right lentiform nucleus (orange arrow), a part of the basal nuclei. The basal nuclei presented a reduced volume corresponding to less than the 1st percentile for age and sex in our patient.
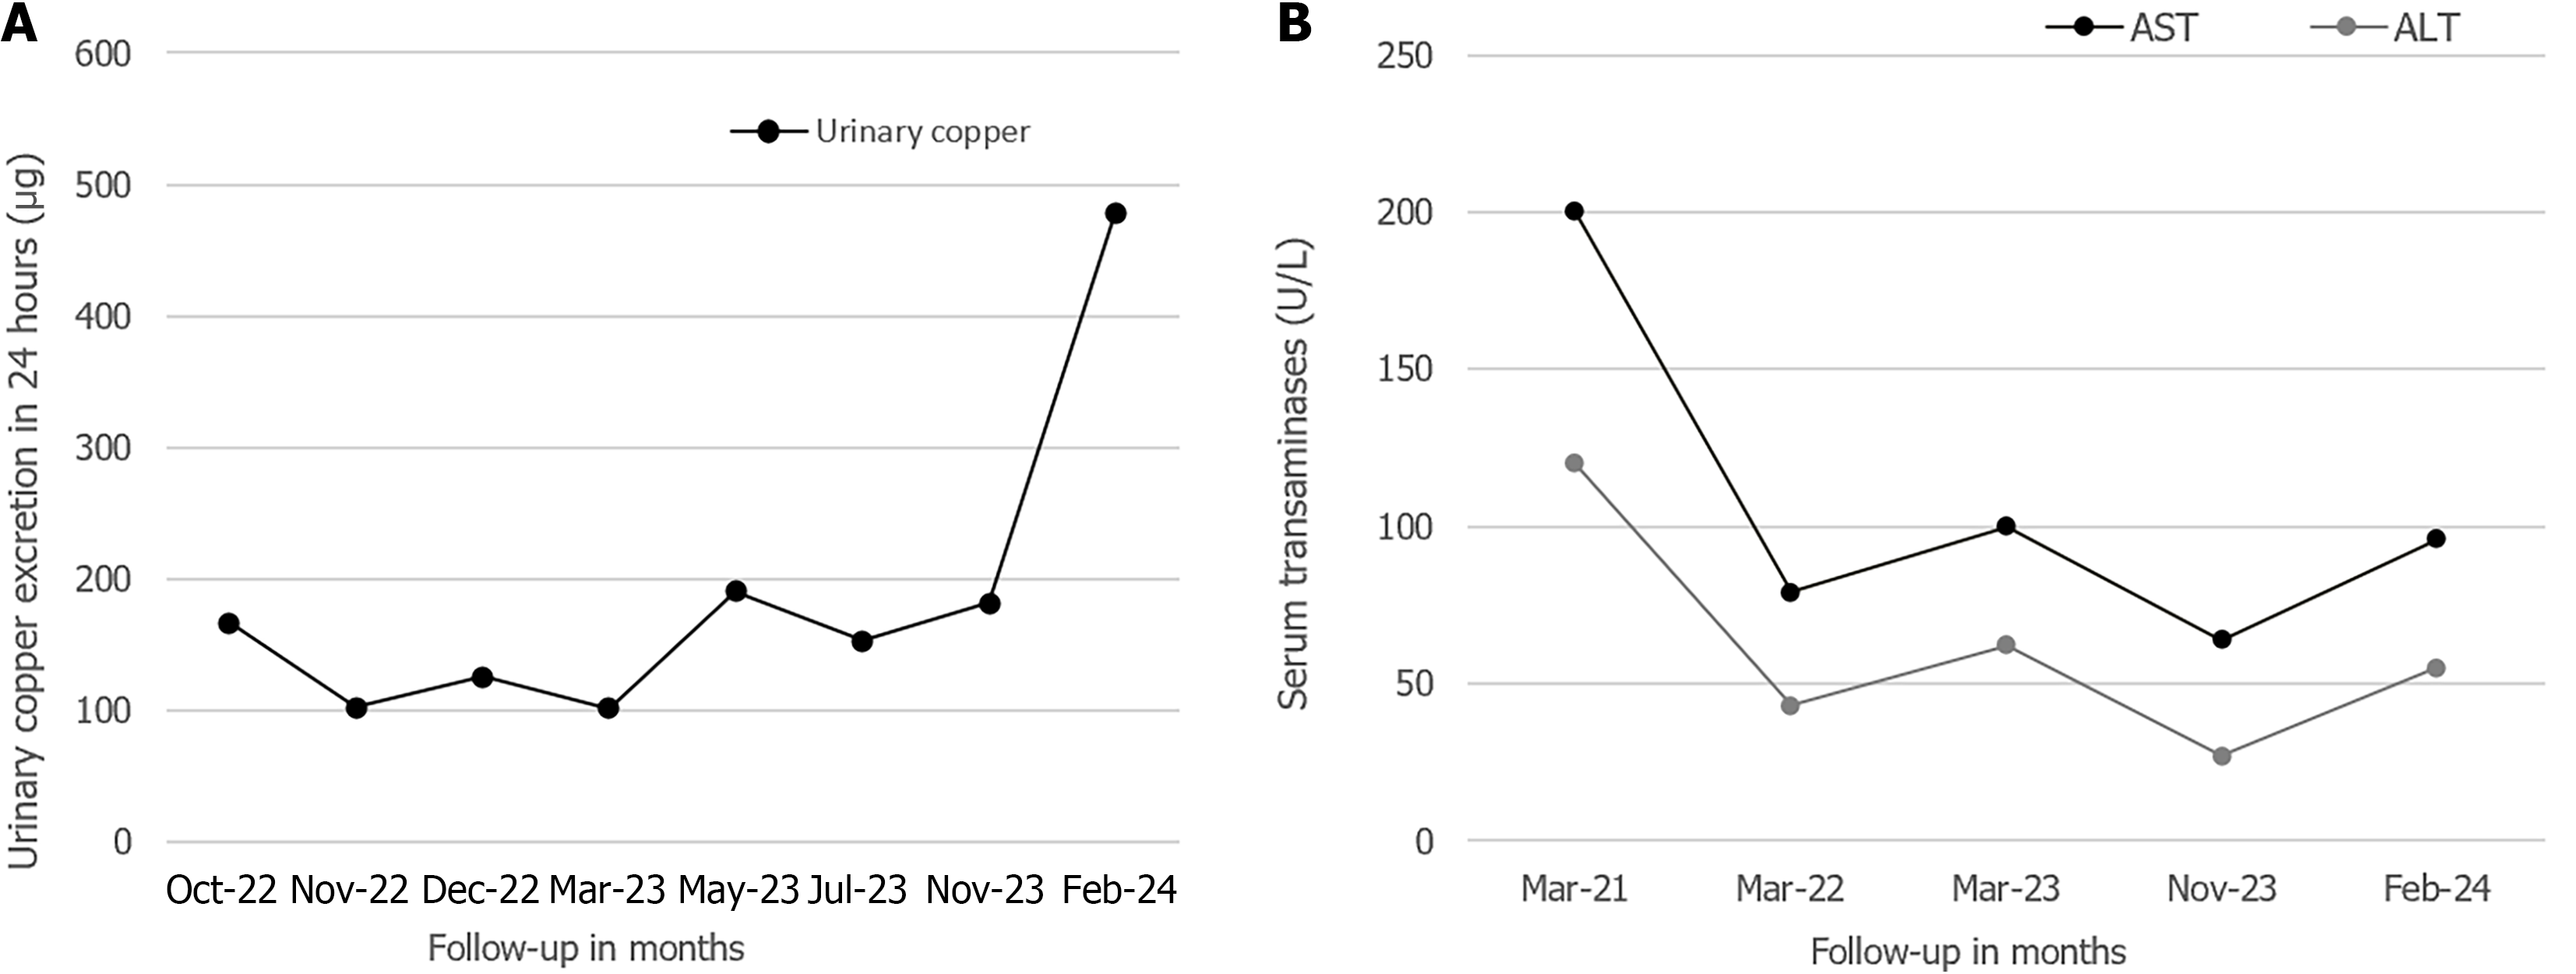
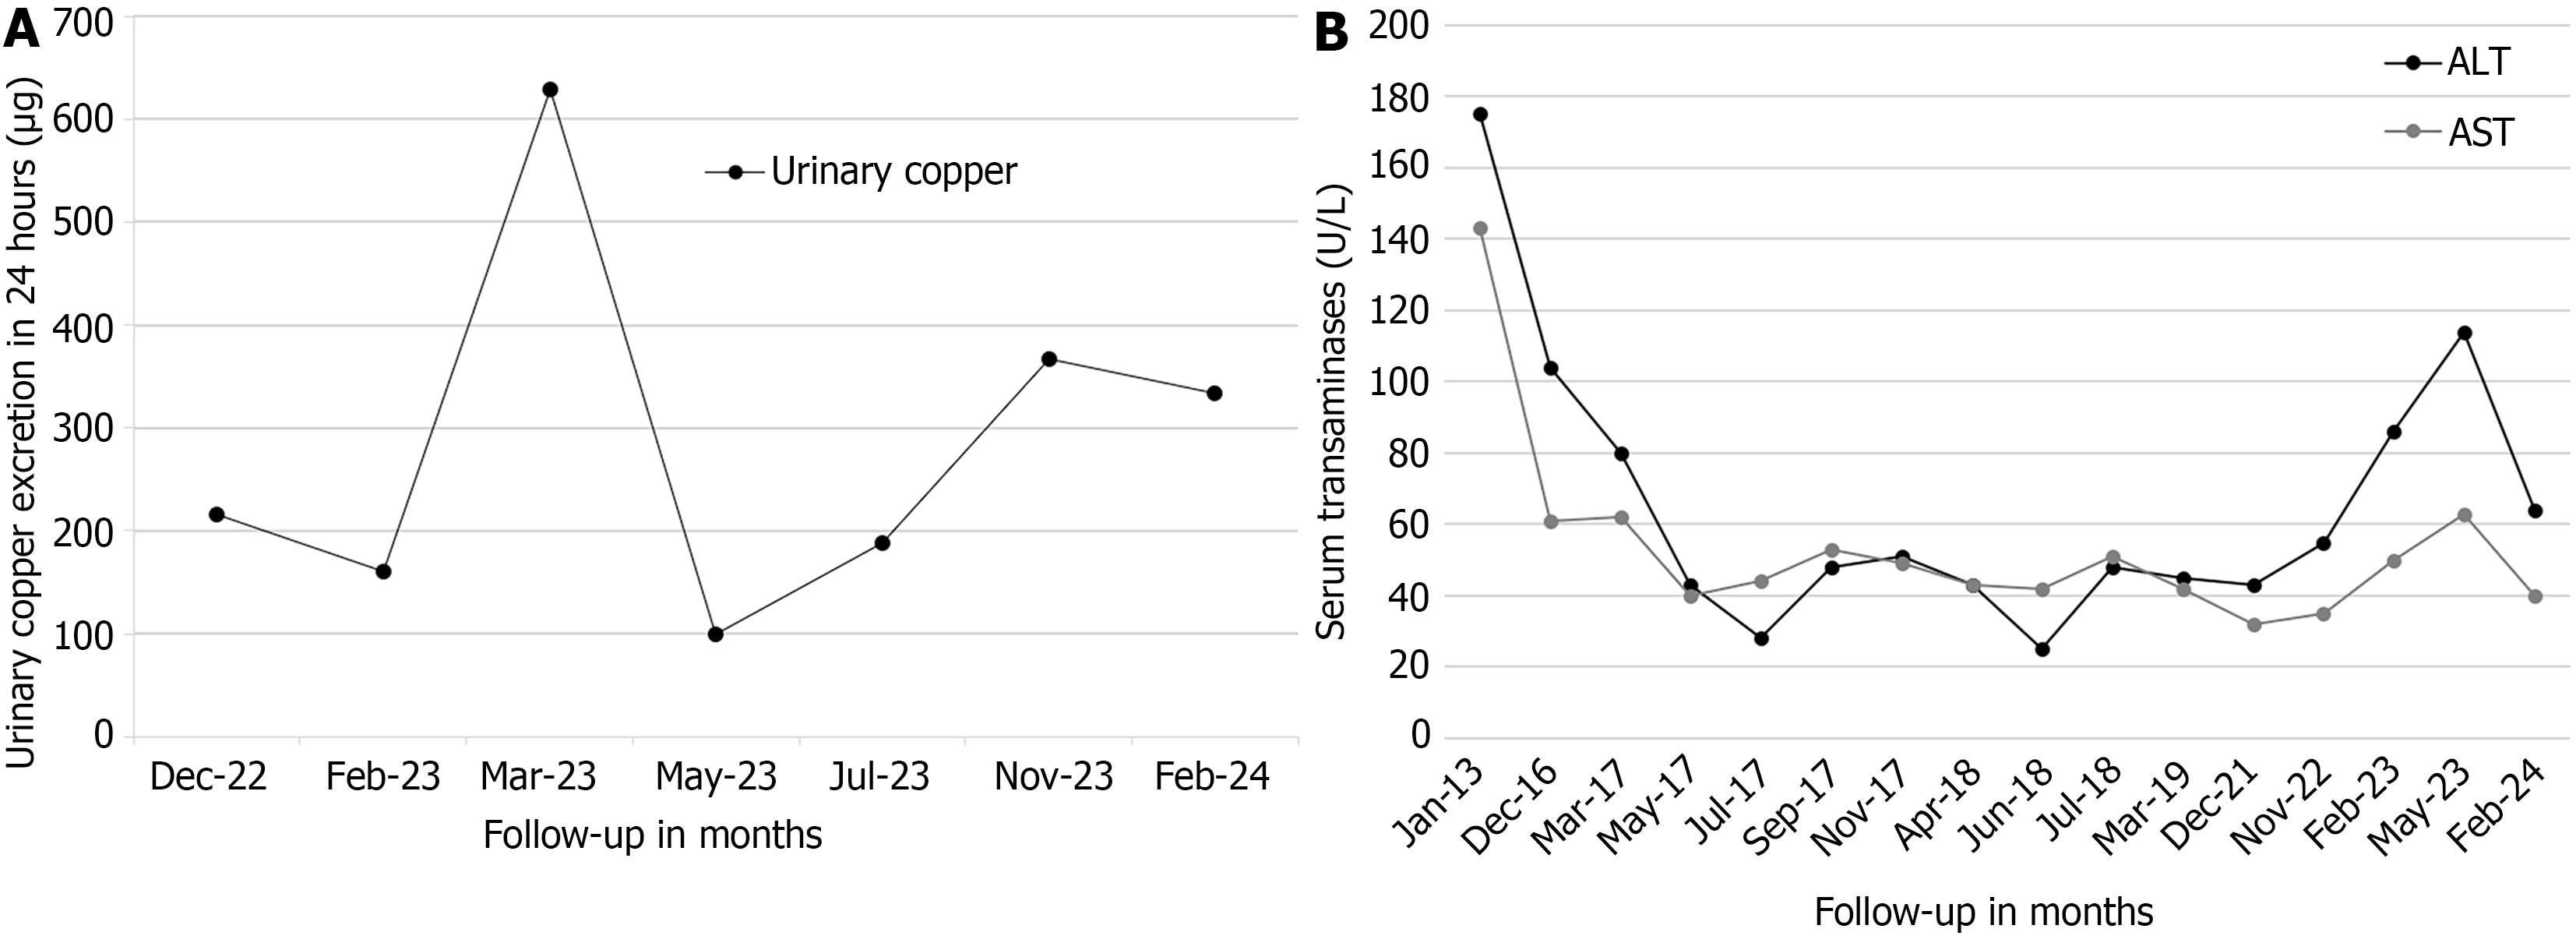
Figure 5 Monitoring of urinary copper excretion and serum transaminase levels in Case 1.
A: The graph shows the quantification of urinary copper excretion over a 24-hour period during follow-up in months; B: The graph represents the quantification of serum transaminase levels (alanine aminotransferase and aspartate aminotransferase) during follow-up in months. ALT: Alanine aminotransferase; AST: Aspartate aminotransferase.
Figure 6 Monitoring of urinary copper excretion and serum transaminase levels in Case 2.
A: The graph shows the quantification of urinary copper excretion over a 24-hour period during follow-up in months; B: The graph represents the quantification of serum transaminase levels (alanine aminotransferase and aspartate aminotransferase) during follow-up in months. ALT: Alanine aminotransferase; AST: Aspartate aminotransferase.
- Citation: Carrera E, Alvarado J, Astudillo M, Pillajo G. Wilson's disease in two siblings from Ecuador: Two case reports. World J Clin Cases 2025; 13(3): 99558
- URL: https://www.wjgnet.com/2307-8960/full/v13/i3/99558.htm
- DOI: https://dx.doi.org/10.12998/wjcc.v13.i3.99558


