Copyright
©The Author(s) 2025.
World J Clin Cases. Sep 16, 2025; 13(26): 107716
Published online Sep 16, 2025. doi: 10.12998/wjcc.v13.i26.107716
Published online Sep 16, 2025. doi: 10.12998/wjcc.v13.i26.107716
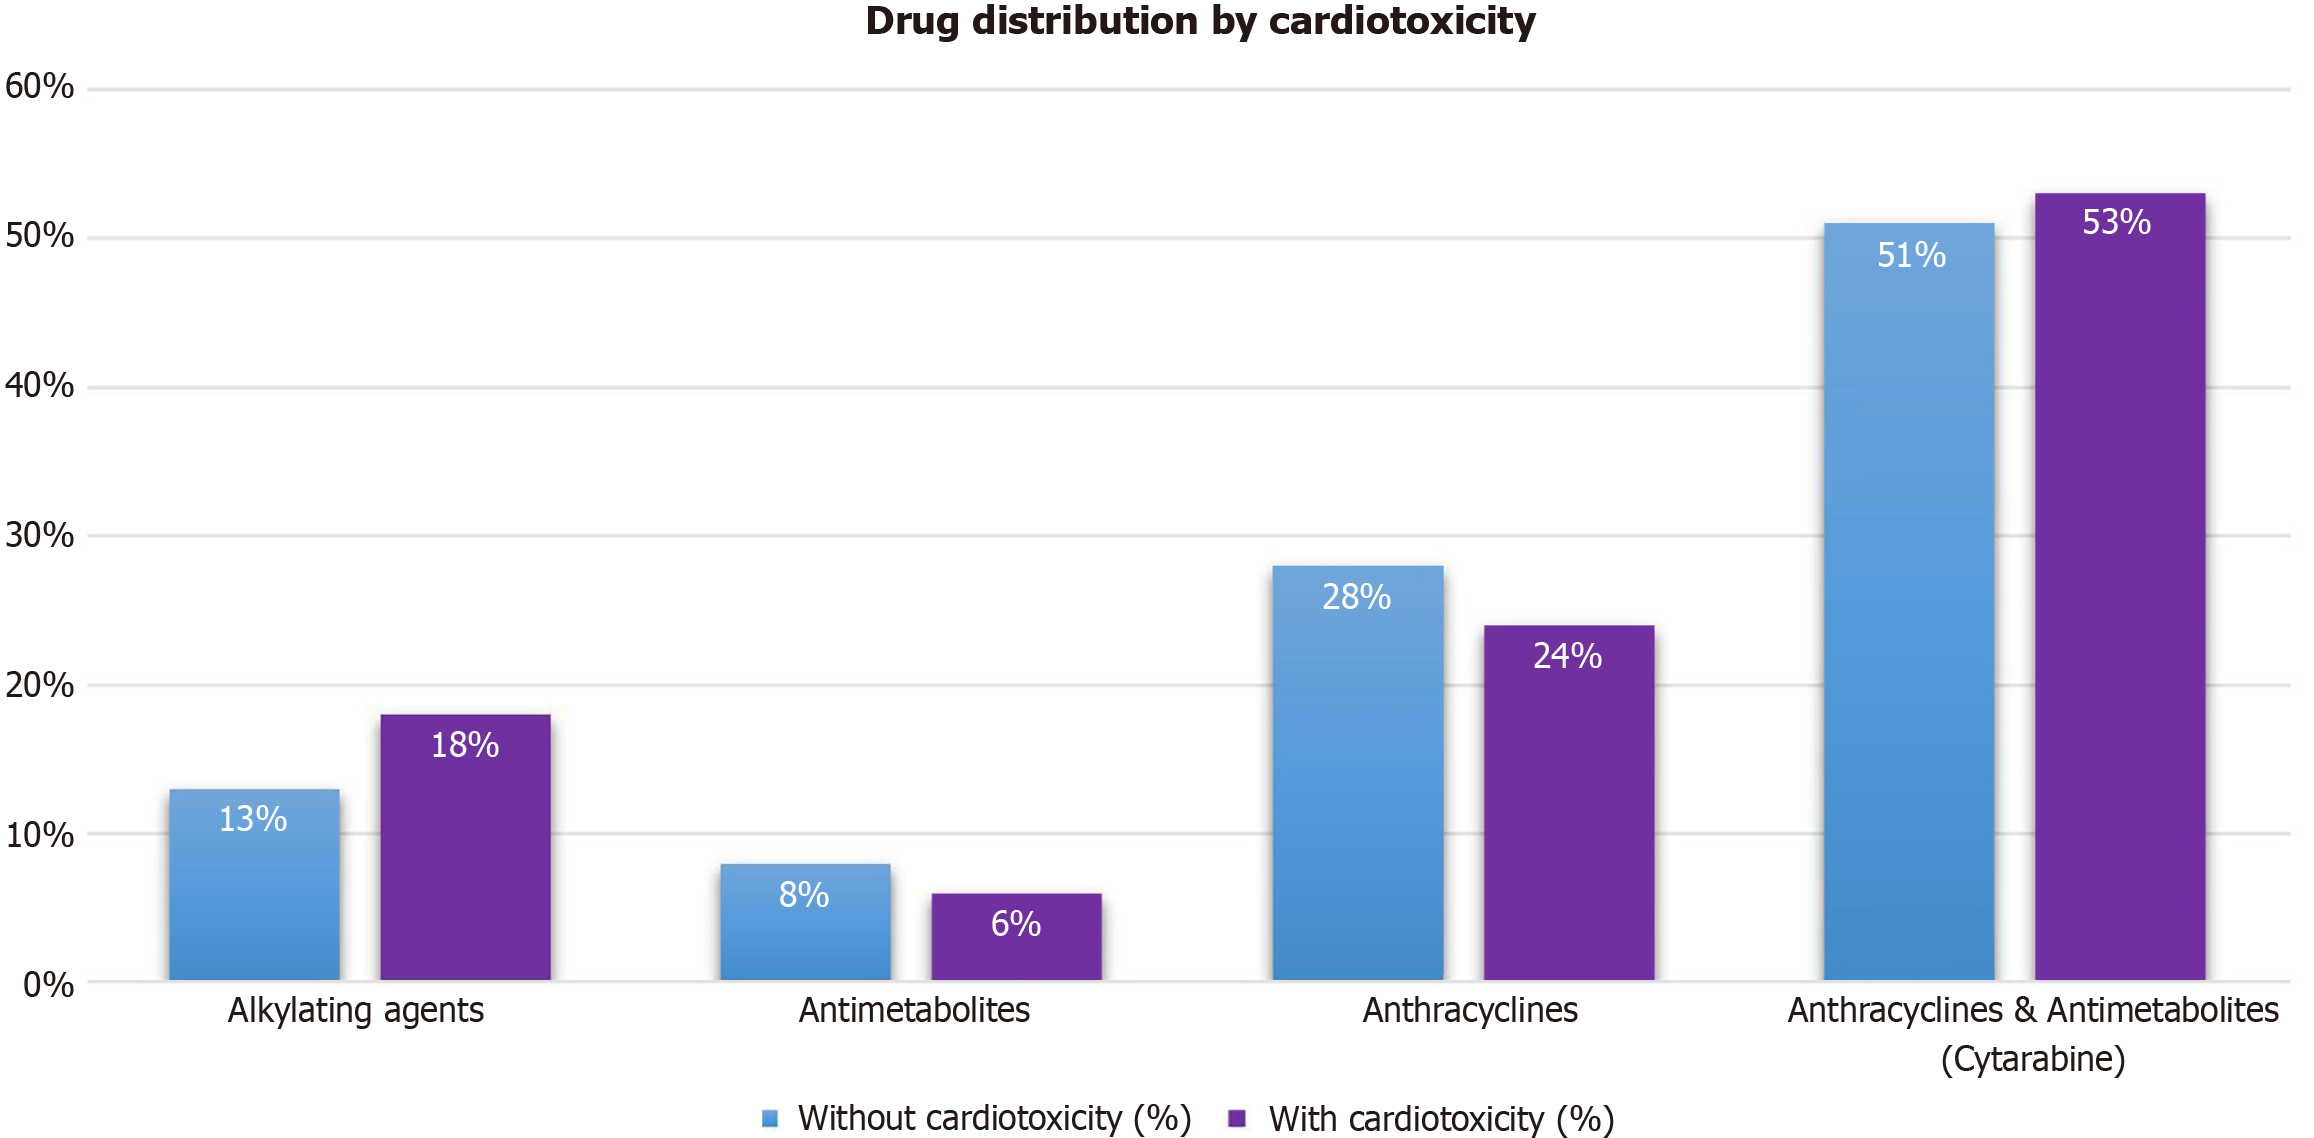
Figure 1 Distribution of different drug classes among patients with and without cardiotoxicity.
The X-axis represents drug classes, while the Y-axis shows the percentage of patients exposed to each category. Blue bars correspond to patients without cardiotoxicity, whereas orange bars indicate those with cardiotoxicity. The highest prevalence was observed in the "Anthracyclines & Antimetabolites (Cytarabine)" group, with 51% of patients without cardiotoxicity and 53% with cardiotoxicity. Conversely, "Antimetabolites" have the lowest representation, with 8% in the non-cardiotoxicity group and 6% in the cardiotoxicity group.
Figure 2 Use of biomarkers and echocardiography before and after chemotherapy.
In the cardiotoxicity subgroup, NT-proBNP was used in 29.4% of cases, troponin in 23.5%, and the combination of both in 23.5%. A: The left panel illustrates the use of cardiac biomarkers before and after chemotherapy. Troponin is the most frequently used biomarker, with a slightly higher percentage before chemotherapy (blue) compared to after (red). The use of proBNP remains relatively low and stable between both periods. The combined use of both biomarkers increases after chemotherapy; B: The right panel depicts echocardiography utilization and left ventricular ejection fraction (LVEF) evolution in chemotherapy patients. The usage percentage of echocardiography and global longitudinal strain recordings (blue bars) decreases from the start to the end of treatment. The red solid and dashed lines show a decline in global LVEF and a more pronounced reduction in LVEF among patients with cardiotoxicity.
- Citation: Méndez-Toro A, Muñoz-Rossi FA, Tejada-Cabrera RE, Rojas-Ruiz IT, Flechas-Ardila JD, García-Gutiérrez A, Novoa-Álvarez RA. Monitoring high-risk patients for chemotherapy-related cardiotoxicity: A retrospective analysis. World J Clin Cases 2025; 13(26): 107716
- URL: https://www.wjgnet.com/2307-8960/full/v13/i26/107716.htm
- DOI: https://dx.doi.org/10.12998/wjcc.v13.i26.107716


