Copyright
©The Author(s) 2025.
World J Clin Cases. Sep 16, 2025; 13(26): 107028
Published online Sep 16, 2025. doi: 10.12998/wjcc.v13.i26.107028
Published online Sep 16, 2025. doi: 10.12998/wjcc.v13.i26.107028
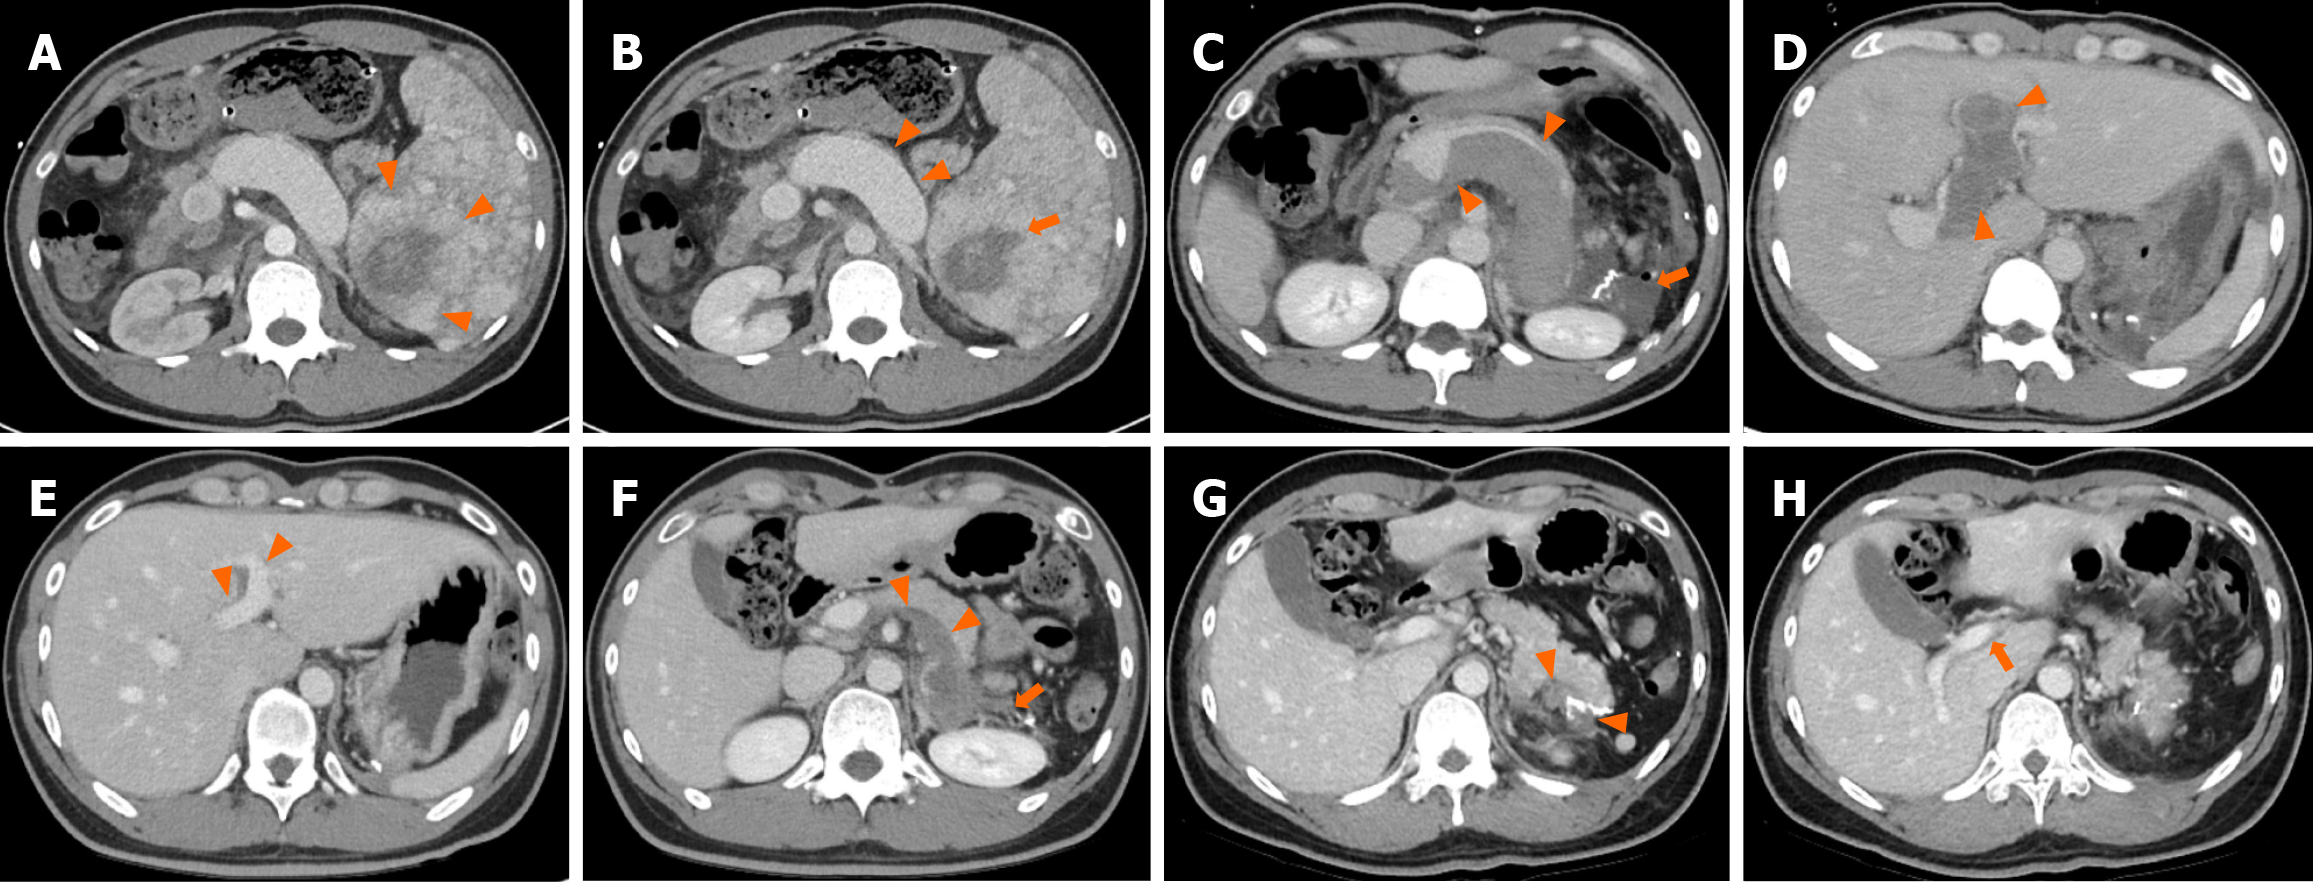
Figure 1 Abdominal contrast-enhanced computed tomography images with postoperative course in a 33-year-old man.
A: Arterial phase contrast-enhanced computed tomography (CT) shows an 8.2 cm × 6.2 cm mass lesion with peripheral rim enhancement (arrowheads); B: Portal venous phase CT reveals a centrally necrotic lesion (orange arrow) with engorged splenic vein (arrowheads); C: On postoperative day 5, portal venous phase CT demonstrates massive splenic vein thrombosis (arrowheads) and a resection site hematoma (orange arrow); D: postoperative day 5, portal venous phase CT also reveals significant intrahepatic and extrahepatic portal vein thrombosis (arrowheads); E: At the 3-month postoperative follow-up, portal venous phase CT shows a remarkable reduction in portal vein thrombosis (arrowheads); F: Significant resolution of remnant splenic vessel thrombosis (arrowheads) and resection site hematoma is observed (orange arrows); G: At the 1-year postoperative follow-up, portal venous phase CT confirms substantial resolution of resection site hematoma (arrowheads); H: Complete resolution of extrahepatic and intrahepatic portal vein thrombosis is seen (orange arrow), with no evidence of recurrence or other abnormalities.
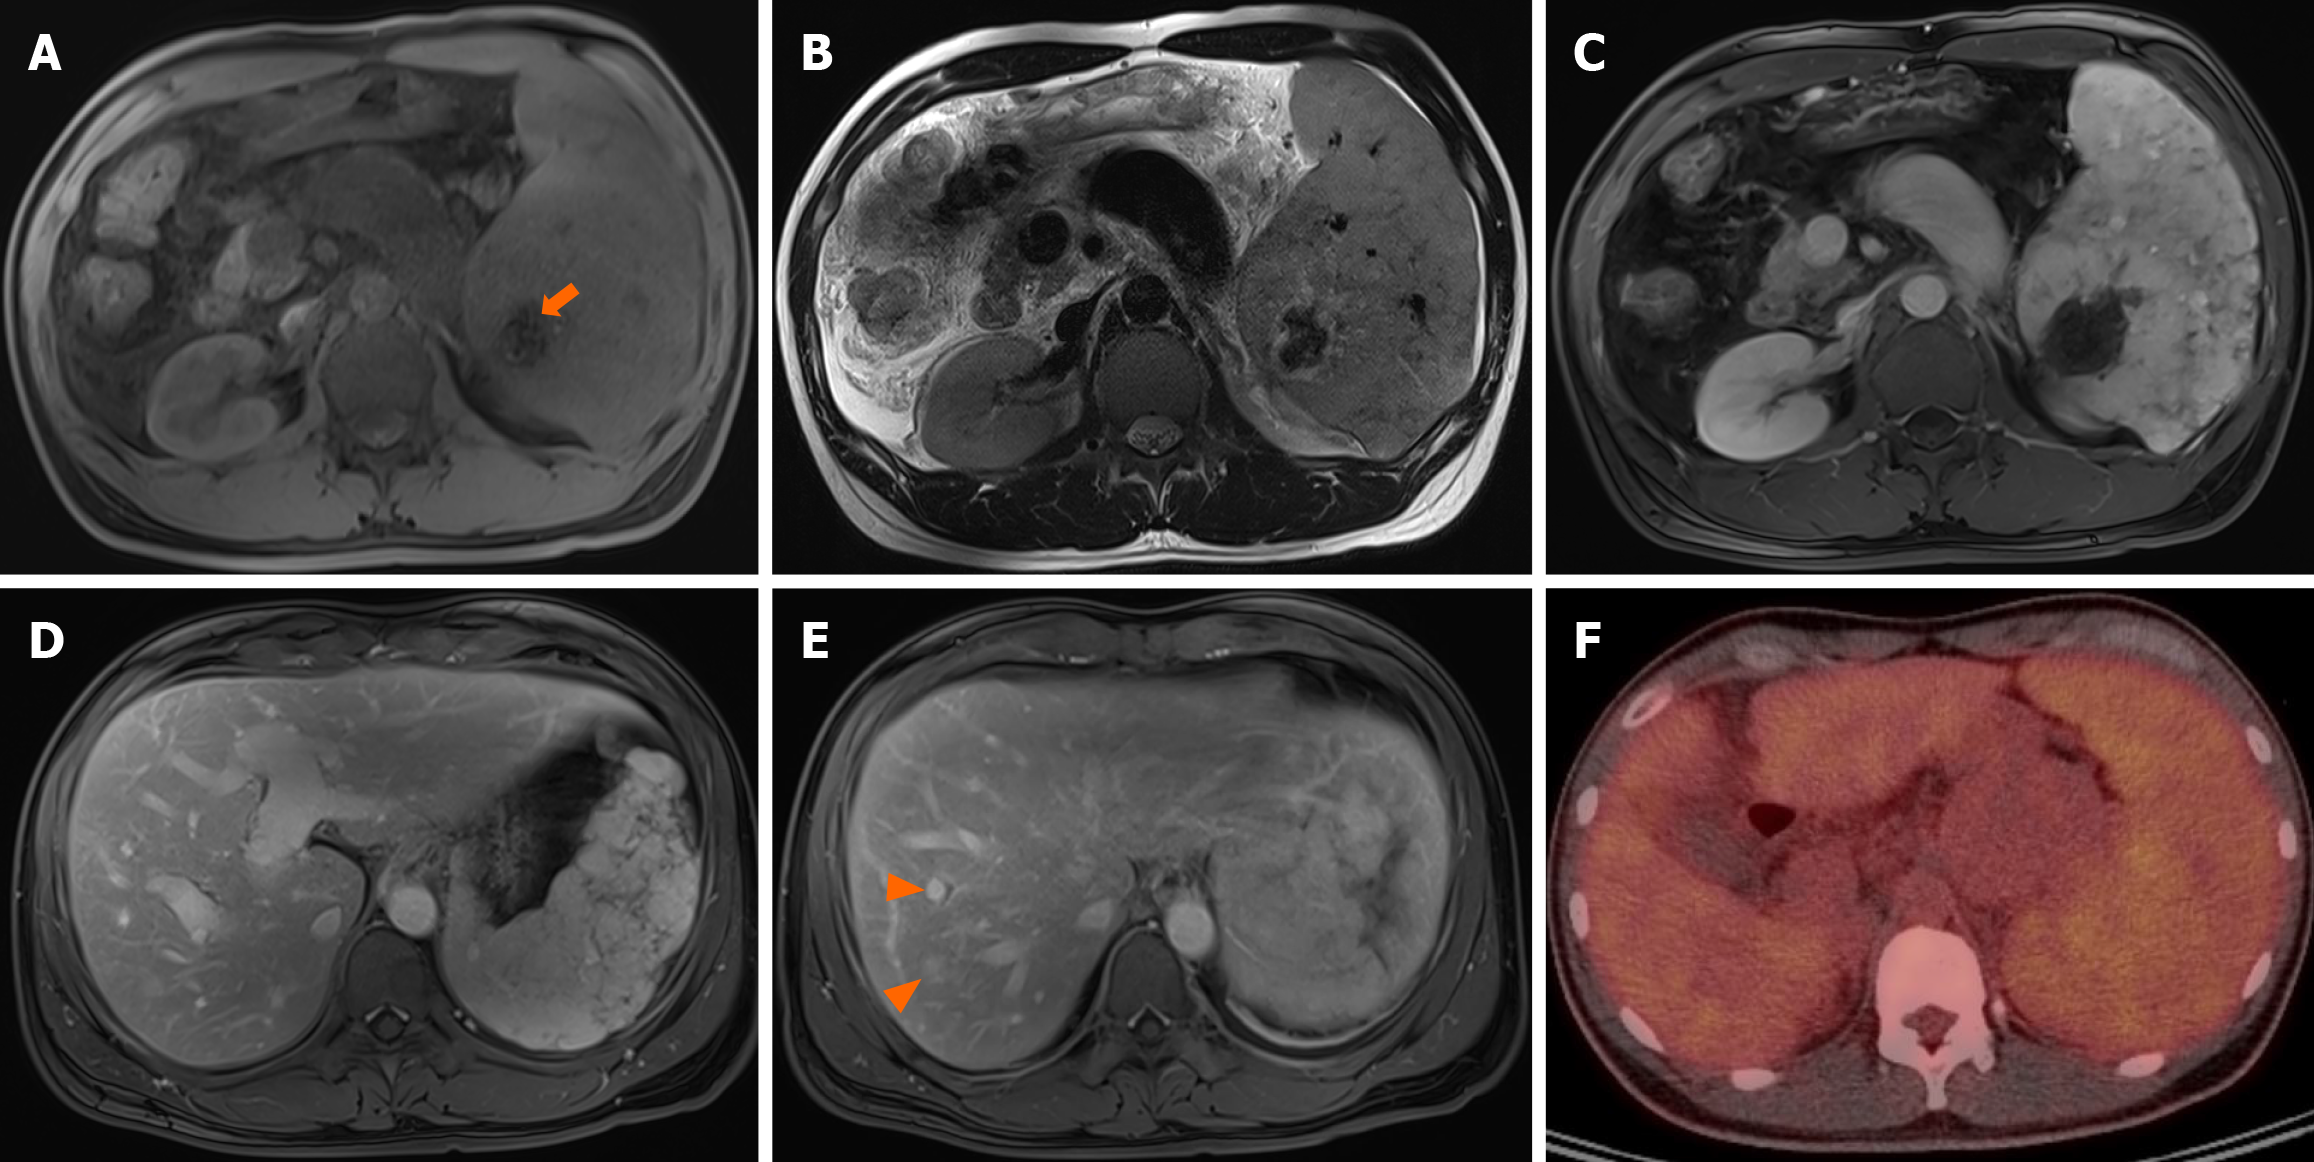
Figure 2 Gadoxetic acid-enhanced liver magnetic resonance imaging and 18F-fluorodeoxyglucose positron emission tomography-computed tomography examination.
The central portion of 8.2 cm × 6.2 cm splenic mass contained hemosiderosis (orange arrow) showing low signal intensity. In dynamic contrast enhanced magnetic resonance images, the splenic mass showed iso to high signal intensity. Contrast enhanced magnetic resonance images demonstrated the multiple hypervascular masses (arrowheads) in liver right hepatic lobe. Positron emission tomography-computed tomography demonstrated splenomegaly with mildly diffusely increased metabolic activity, raising suspicion of hematologic malignancy. A: T1-weighted image; B: T2-weighted image; C-E: In dynamic contrast enhanced magnetic resonance images; F: Positron emission tomography-computed tomography examination image.
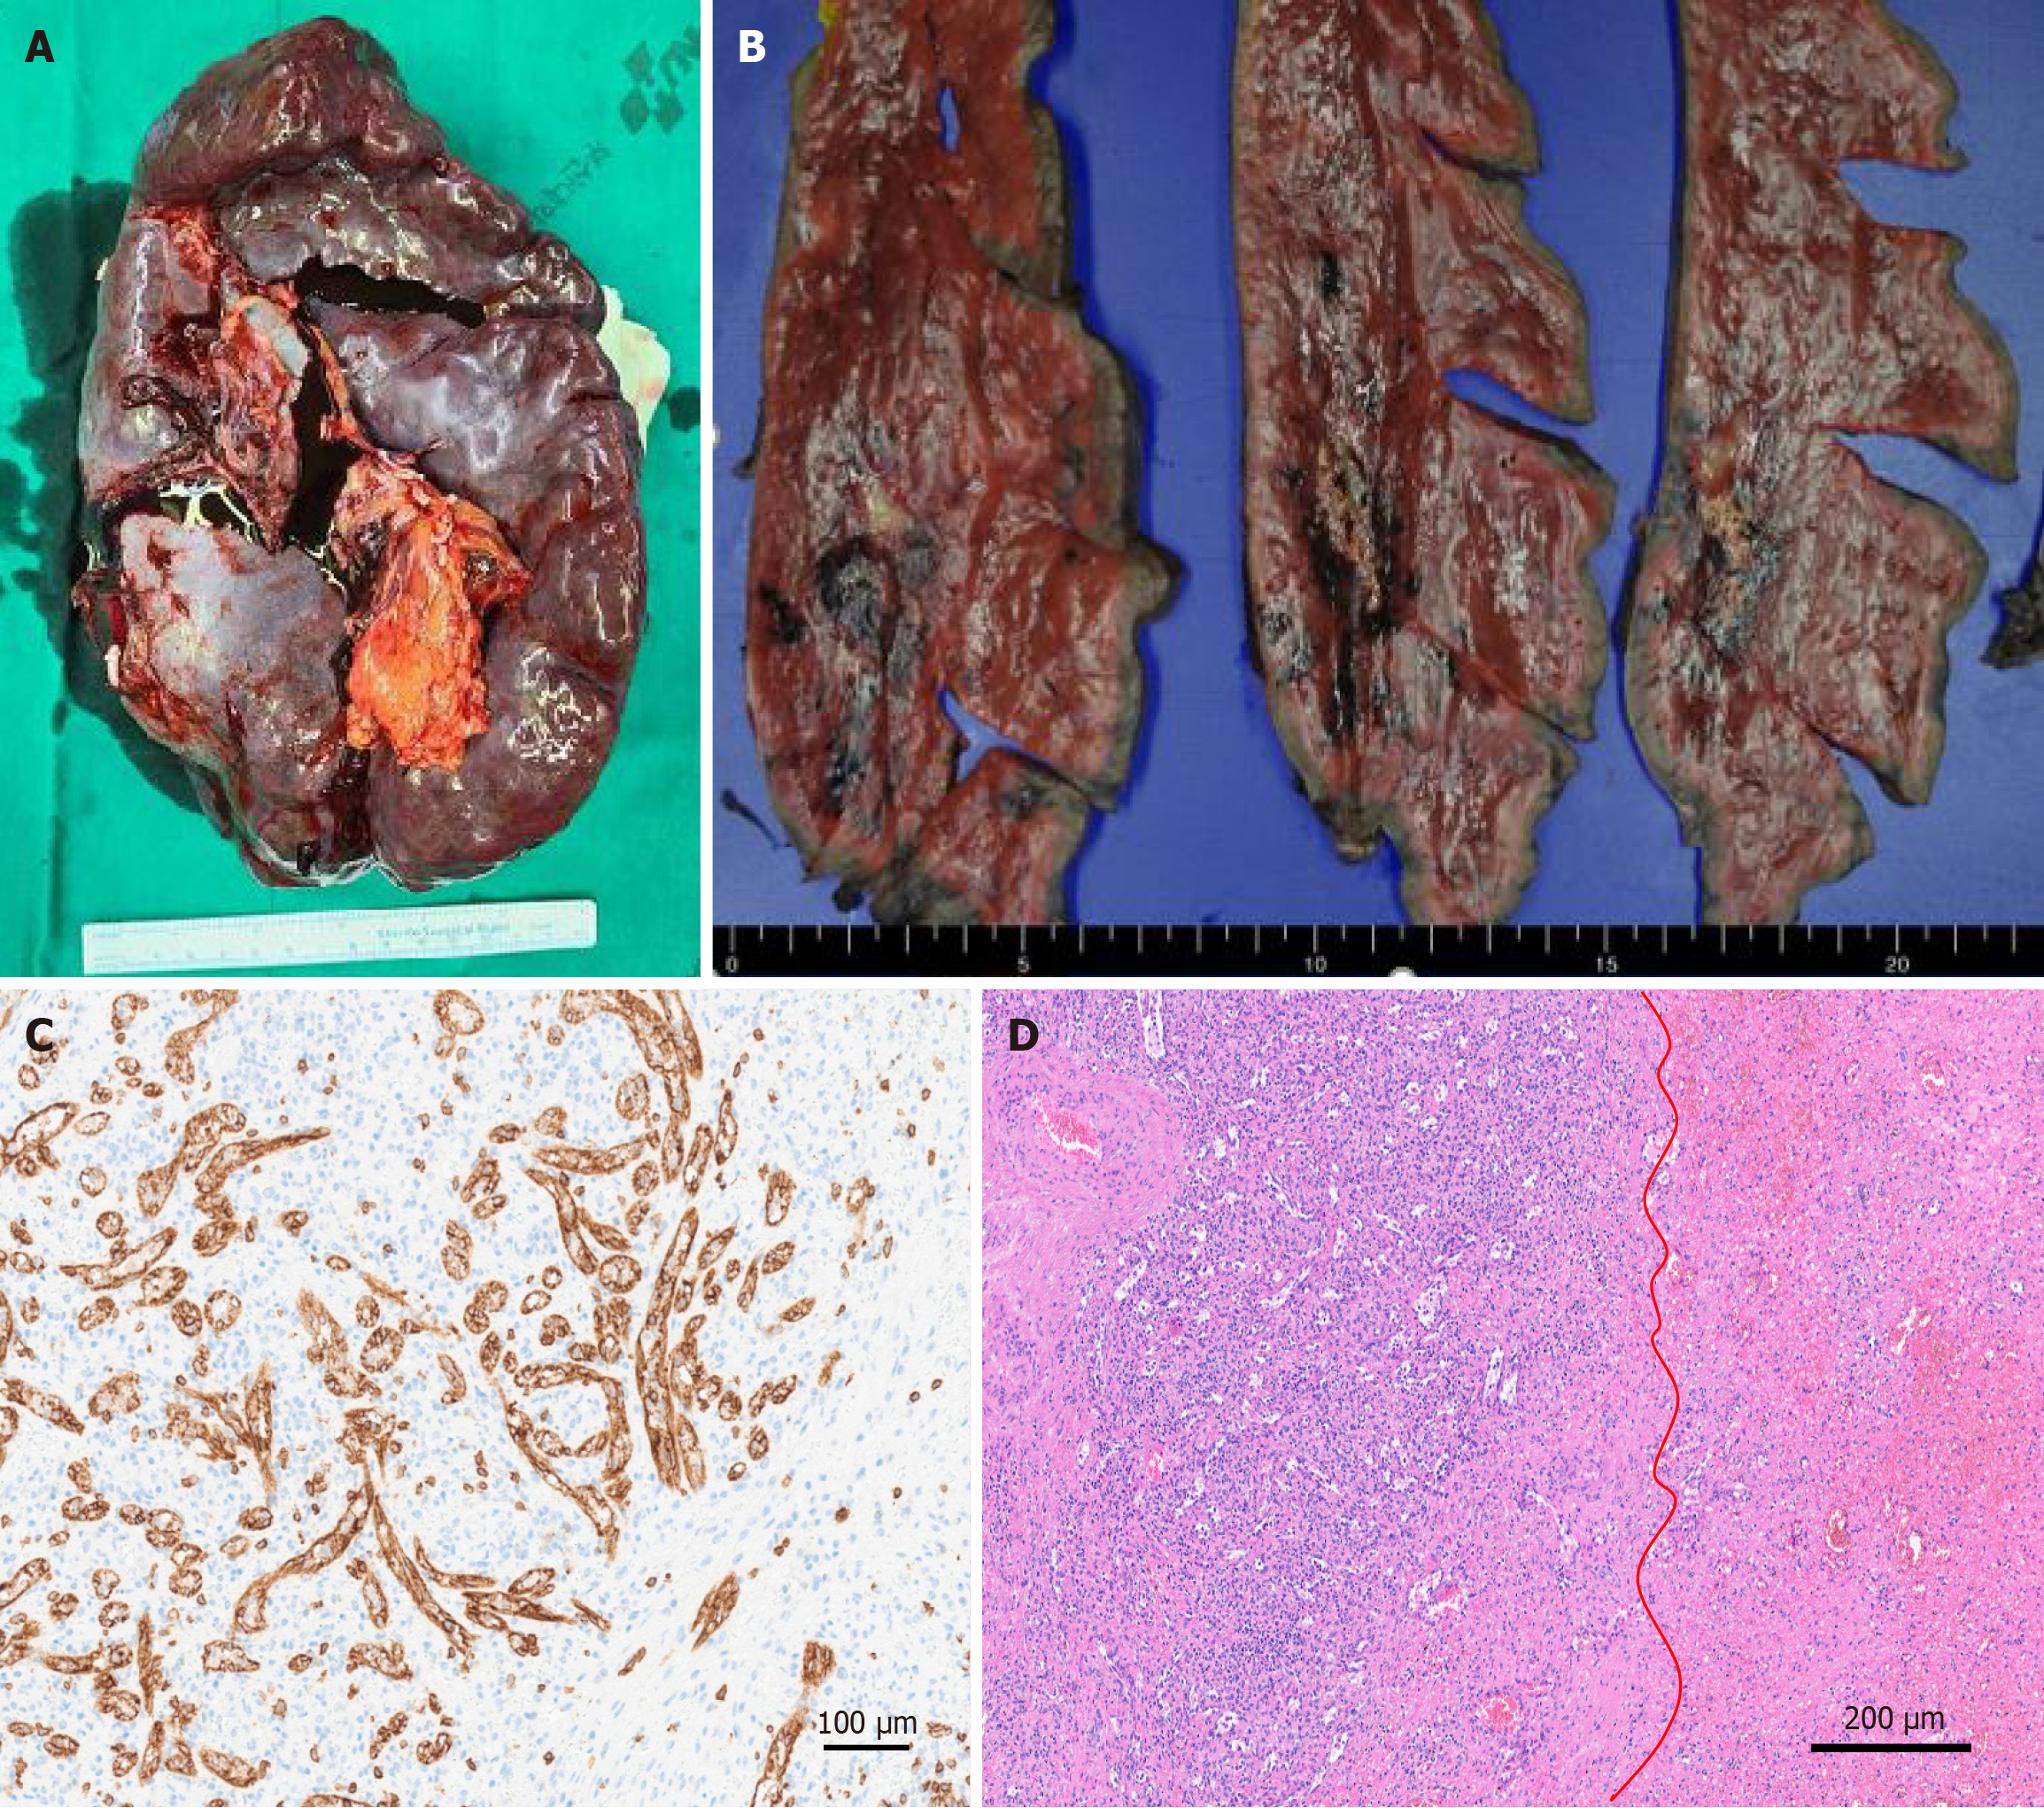
Figure 3 Surgical specimen with histopathological analysis and immunohistochemical examination after splenectomy.
A: The surgical specimen measured 21.7 cm × 15.5 cm × 6.3 cm, with an intact capsule and no signs of congestion; B: Gross examination reveals an ill-defined yellow-white solid mass with hemorrhage, measuring 4.5 cm × 2.5 cm × 2 cm; C: Immunohistochemical staining for CD8+ sinuses (× 200); D: Microscopic findings show vascular proliferation composed of disorganized red pulp elements (left from red line) and hemorrhage (right from red line), visualized with hematoxylin-eosin staining (× 100).
- Citation: Song SB, Noh BG, Oh MH, Yoon M, Park YM, Seo HI, Hong SB, Kim S. Splenic hamartoma mimicking angiosarcoma: A case report. World J Clin Cases 2025; 13(26): 107028
- URL: https://www.wjgnet.com/2307-8960/full/v13/i26/107028.htm
- DOI: https://dx.doi.org/10.12998/wjcc.v13.i26.107028


