Copyright
©The Author(s) 2025.
World J Clin Cases. Jul 26, 2025; 13(21): 105066
Published online Jul 26, 2025. doi: 10.12998/wjcc.v13.i21.105066
Published online Jul 26, 2025. doi: 10.12998/wjcc.v13.i21.105066
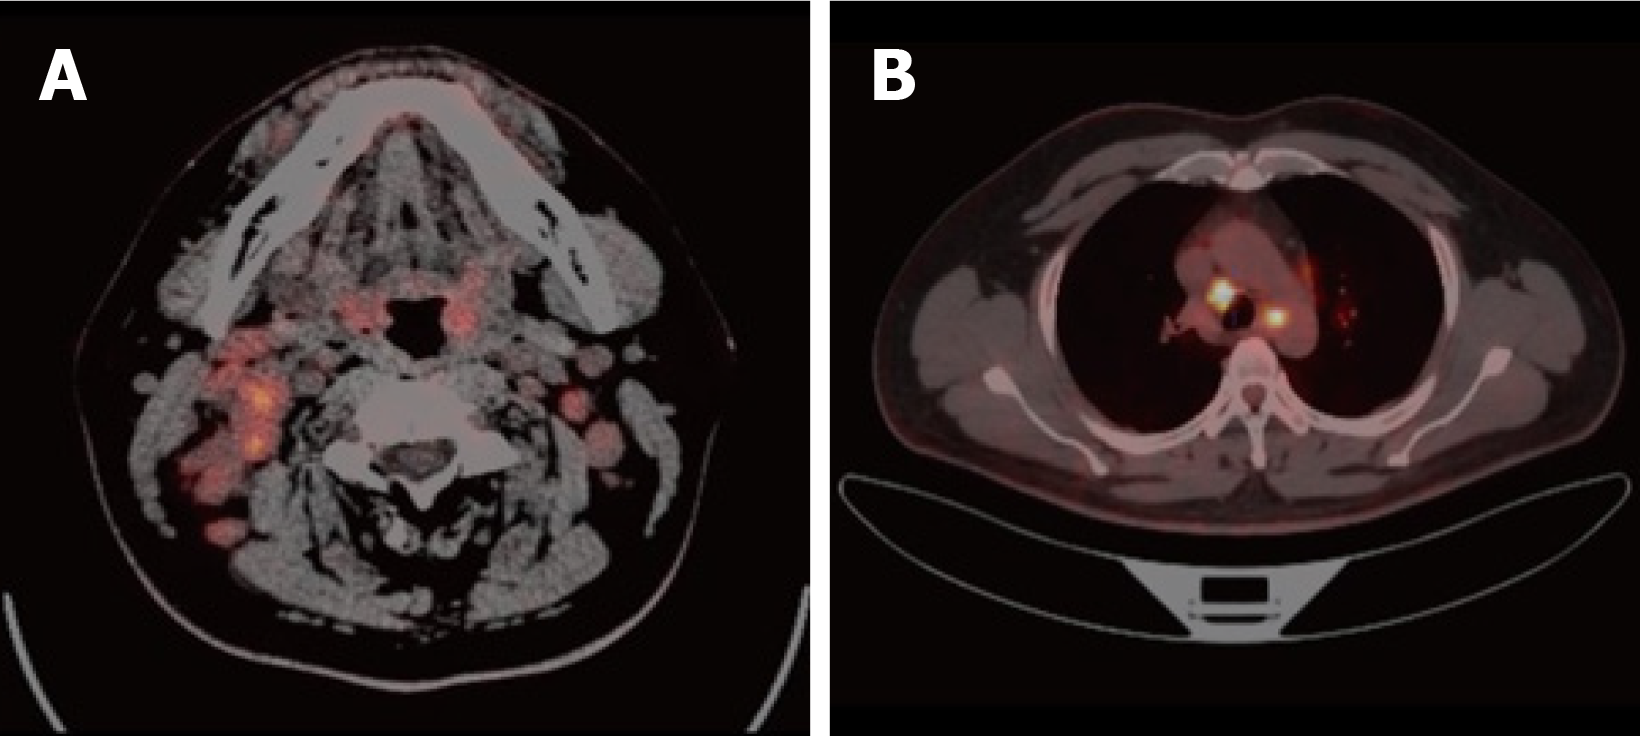
Figure 1 Positron emission tomography/computed tomography findings (July 5, 2022).
A: (Head and neck) Thickening of soft tissue in the posterior wall of the nasopharynx, accompanied by a slight increase in glucose metabolism; Multiple enlarged lymph nodes in the bilateral walls of the oropharynx and bilateral parapharyngeal spaces, accompanied by increased glucose metabolism; B: (Pulmonary hilum and mediastinum) Multiple enlarged lymph nodes in the mediastinum and bilateral hilum, accompanied by increased glucose metabolism.
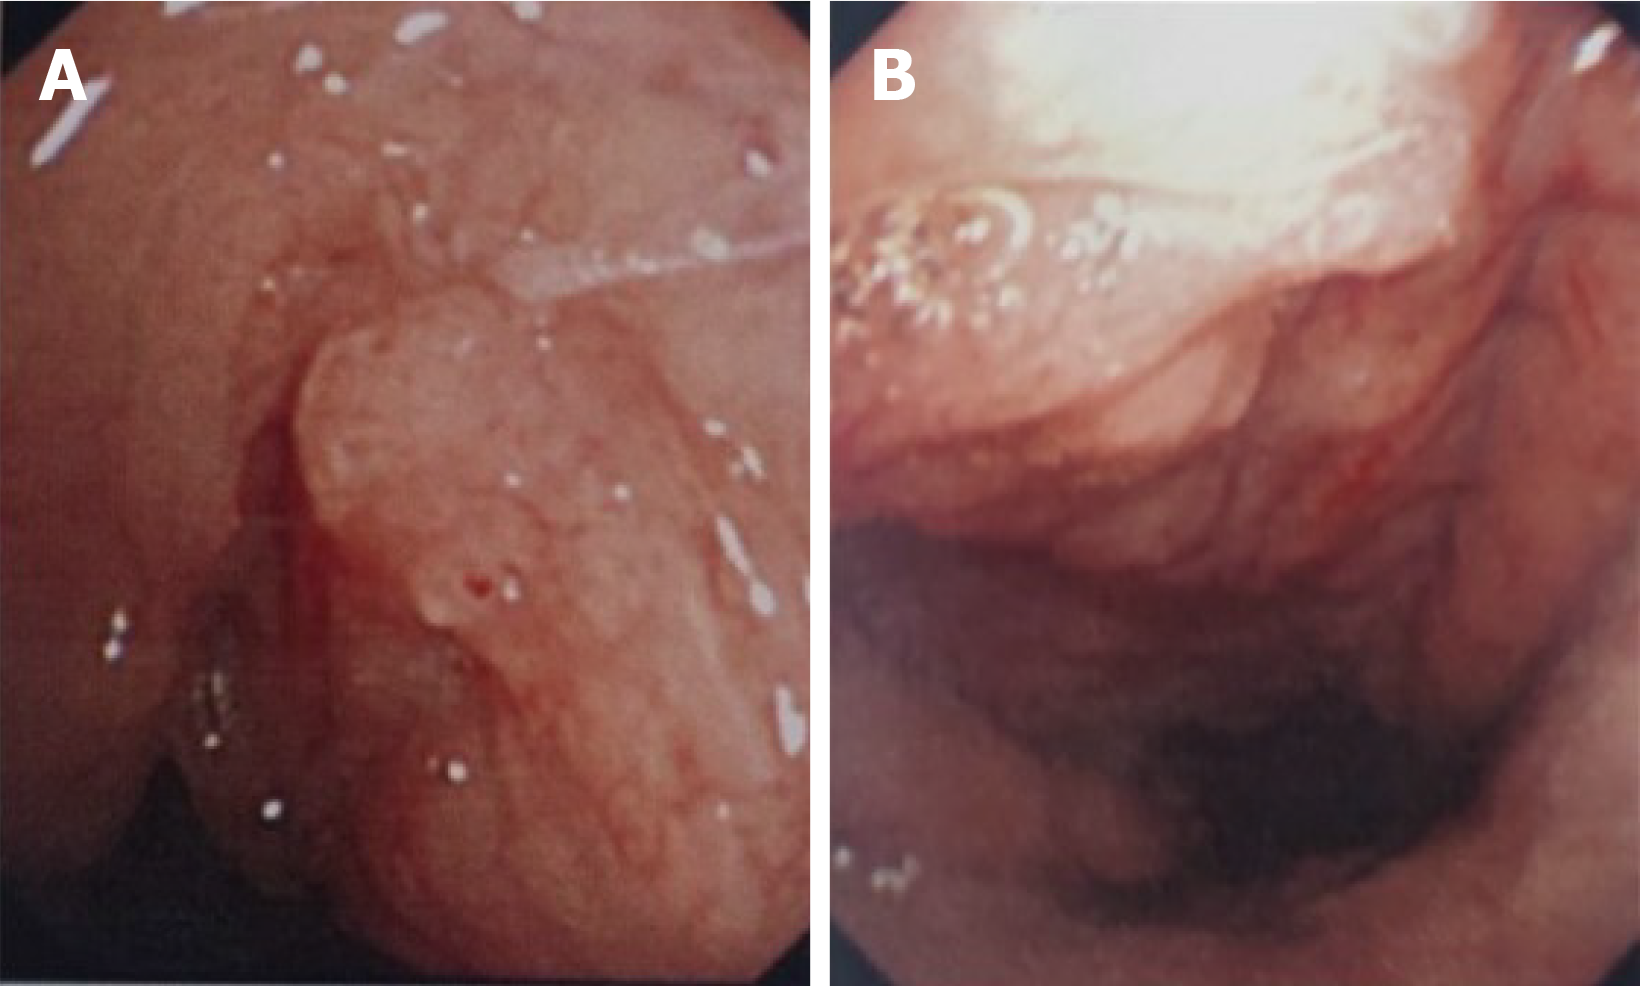
Figure 2 Electronic endoscope images (July 9, 2022).
A: Right pharyngeal recess, tubal torus; B: Nasopharyngeal posterior wall. The nonsmooth new organism is located on the posterior wall of the right nasopharynx, on the right round pillow, and in the pharyngeal recess. The surface of the new organism presents a vascular disorder like appearance.
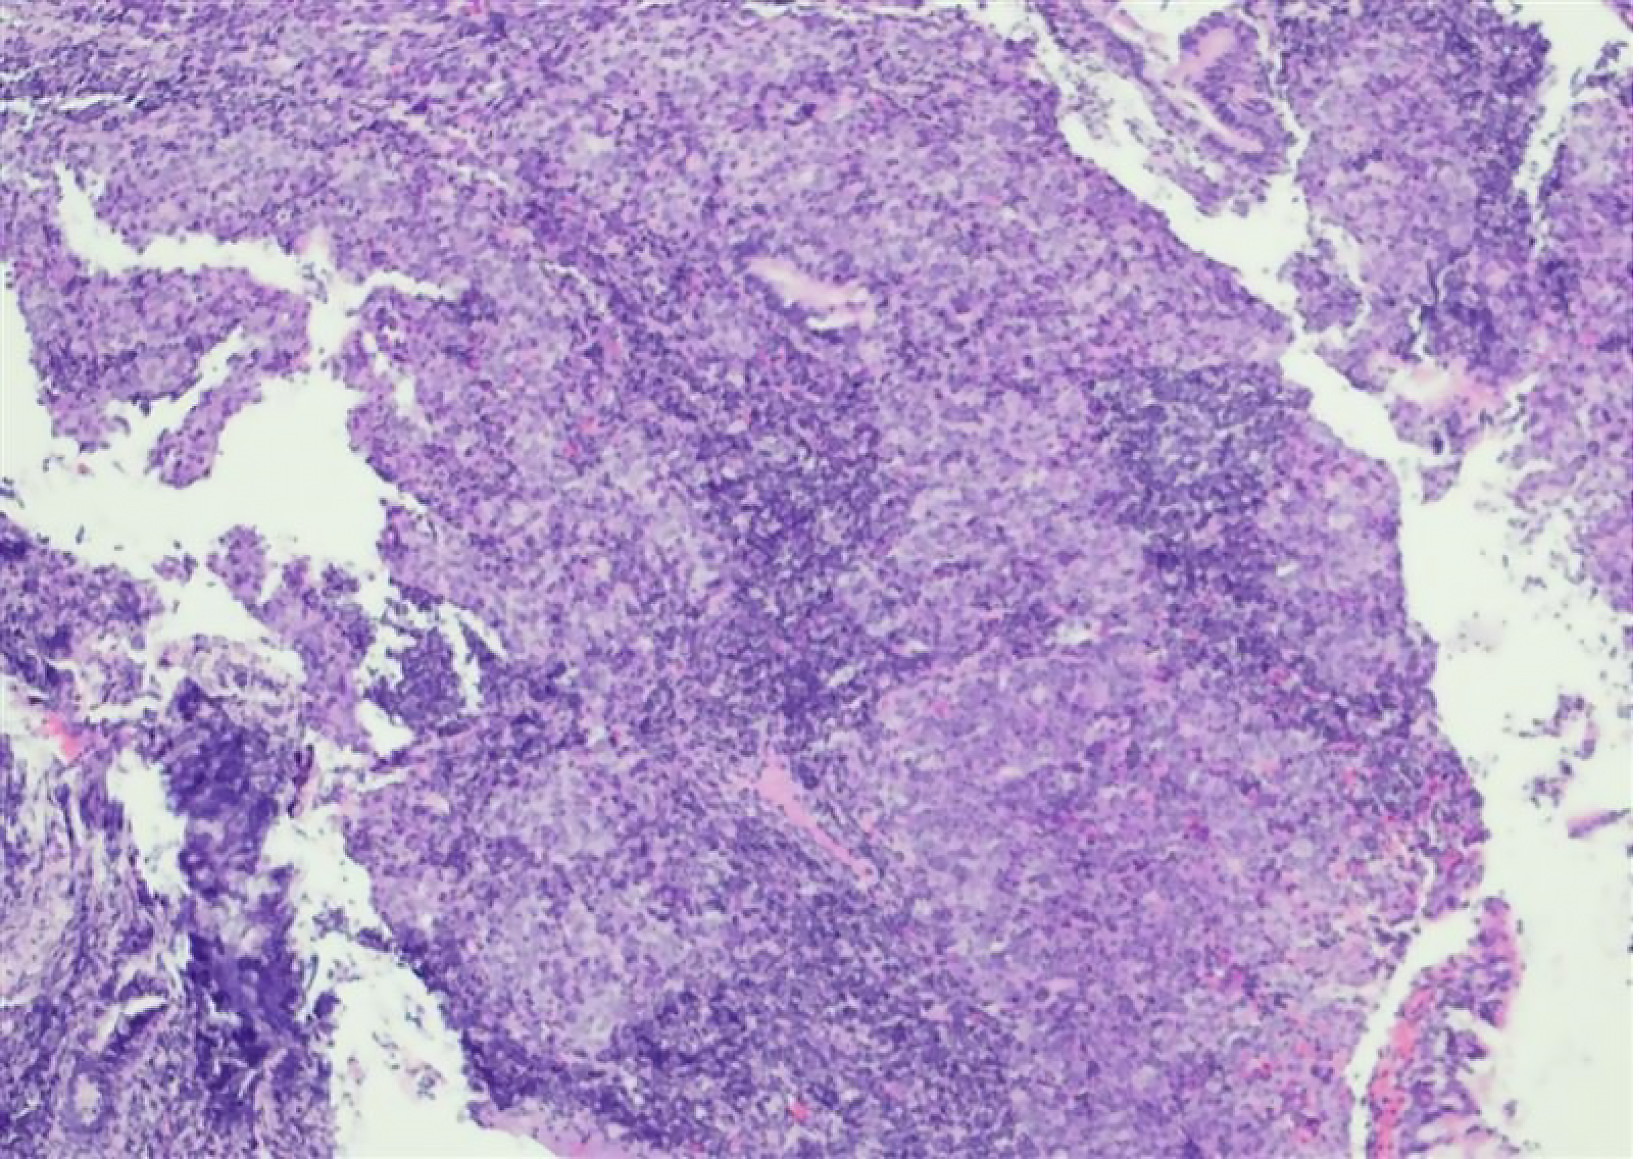
Figure 3 Pathology.
Two grayish-white to yellowish rice-grain-sized masses were obtained from the nasopharynx of the patient. Immunohistochemical analysis revealed the following results: Cytokeratin (+), tumor Protein p53 (wild-type), tumor Protein p63(+), marker of Proliferation Ki-67 (30%+), tumor Necrosis Factor Receptor Superfamily Member 8 (scattered+), ΔNp63 Isoform of tumor Protein p63 (P40) (+), Cytokeratin 7 (-), and Cytokeratin 5/6 (+). Hematoxylin and eosin staining; magnification, ×100.
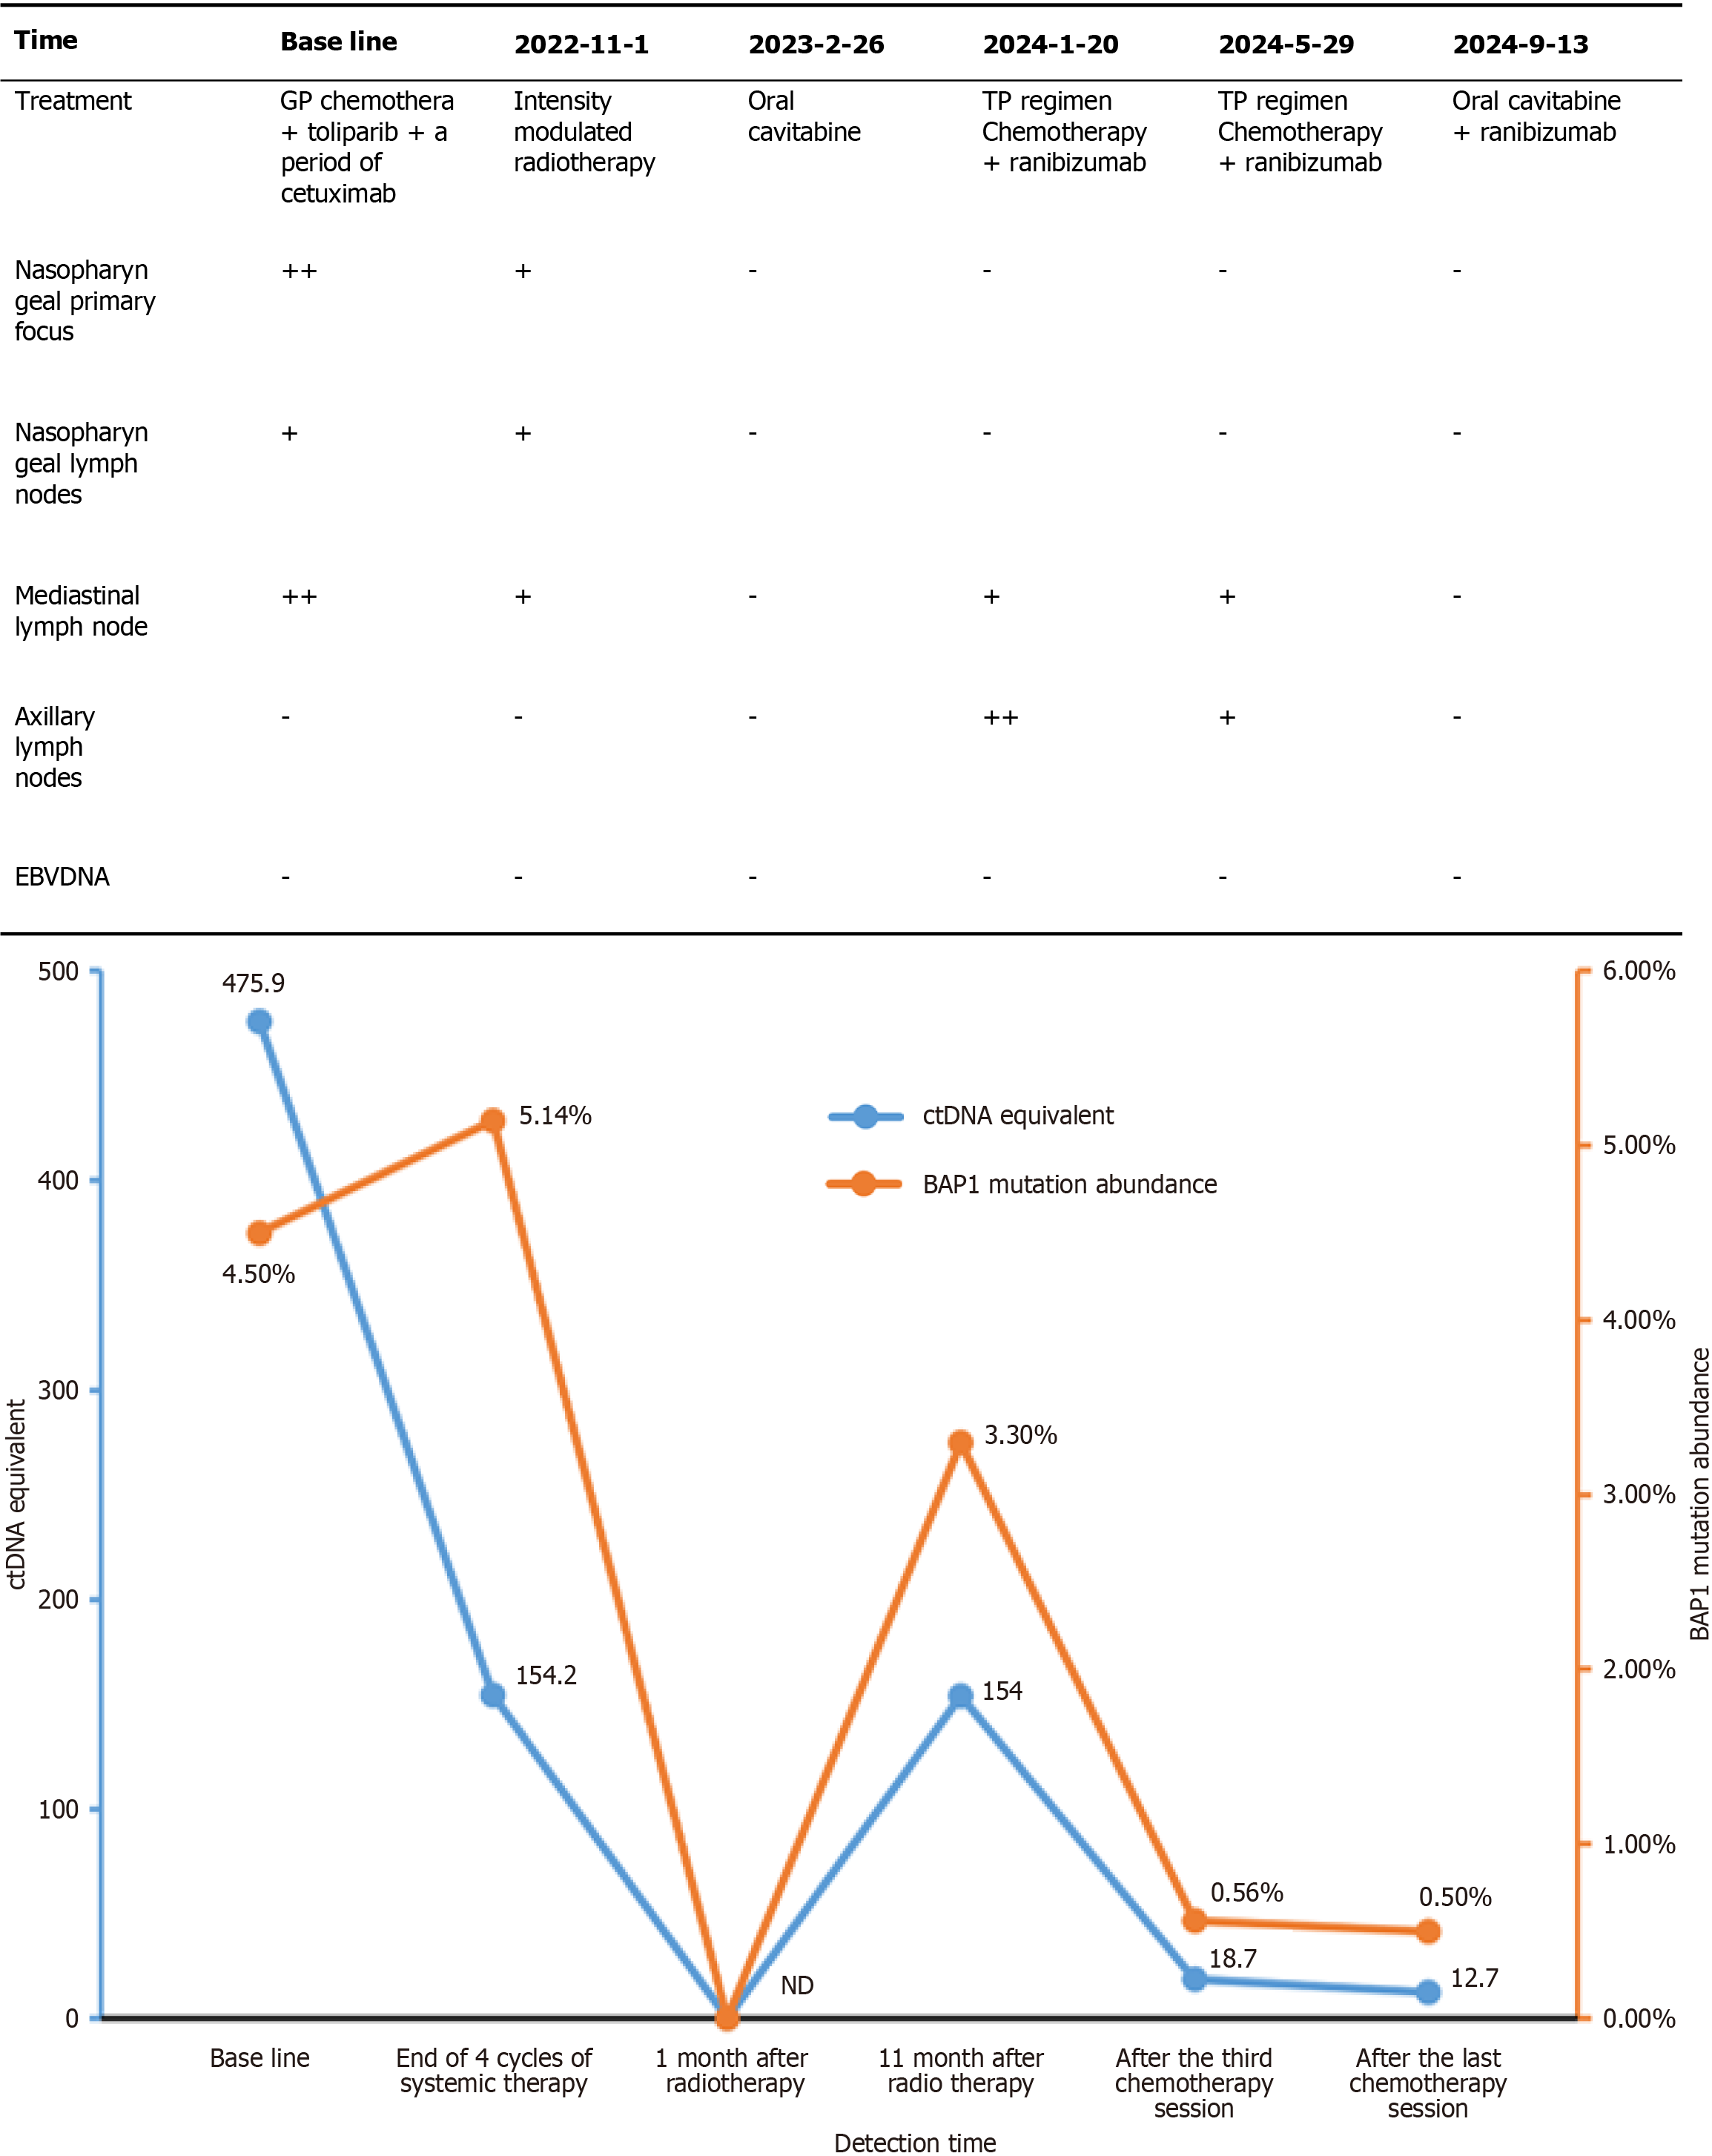
Figure 4 Table of patient's disease progression during treatment and line graph of the abundance of circulating tumor DNA -specific tumor mutations in liquid biopsies as a function of treatment time point.
EBV: Epstein–Barr virus.
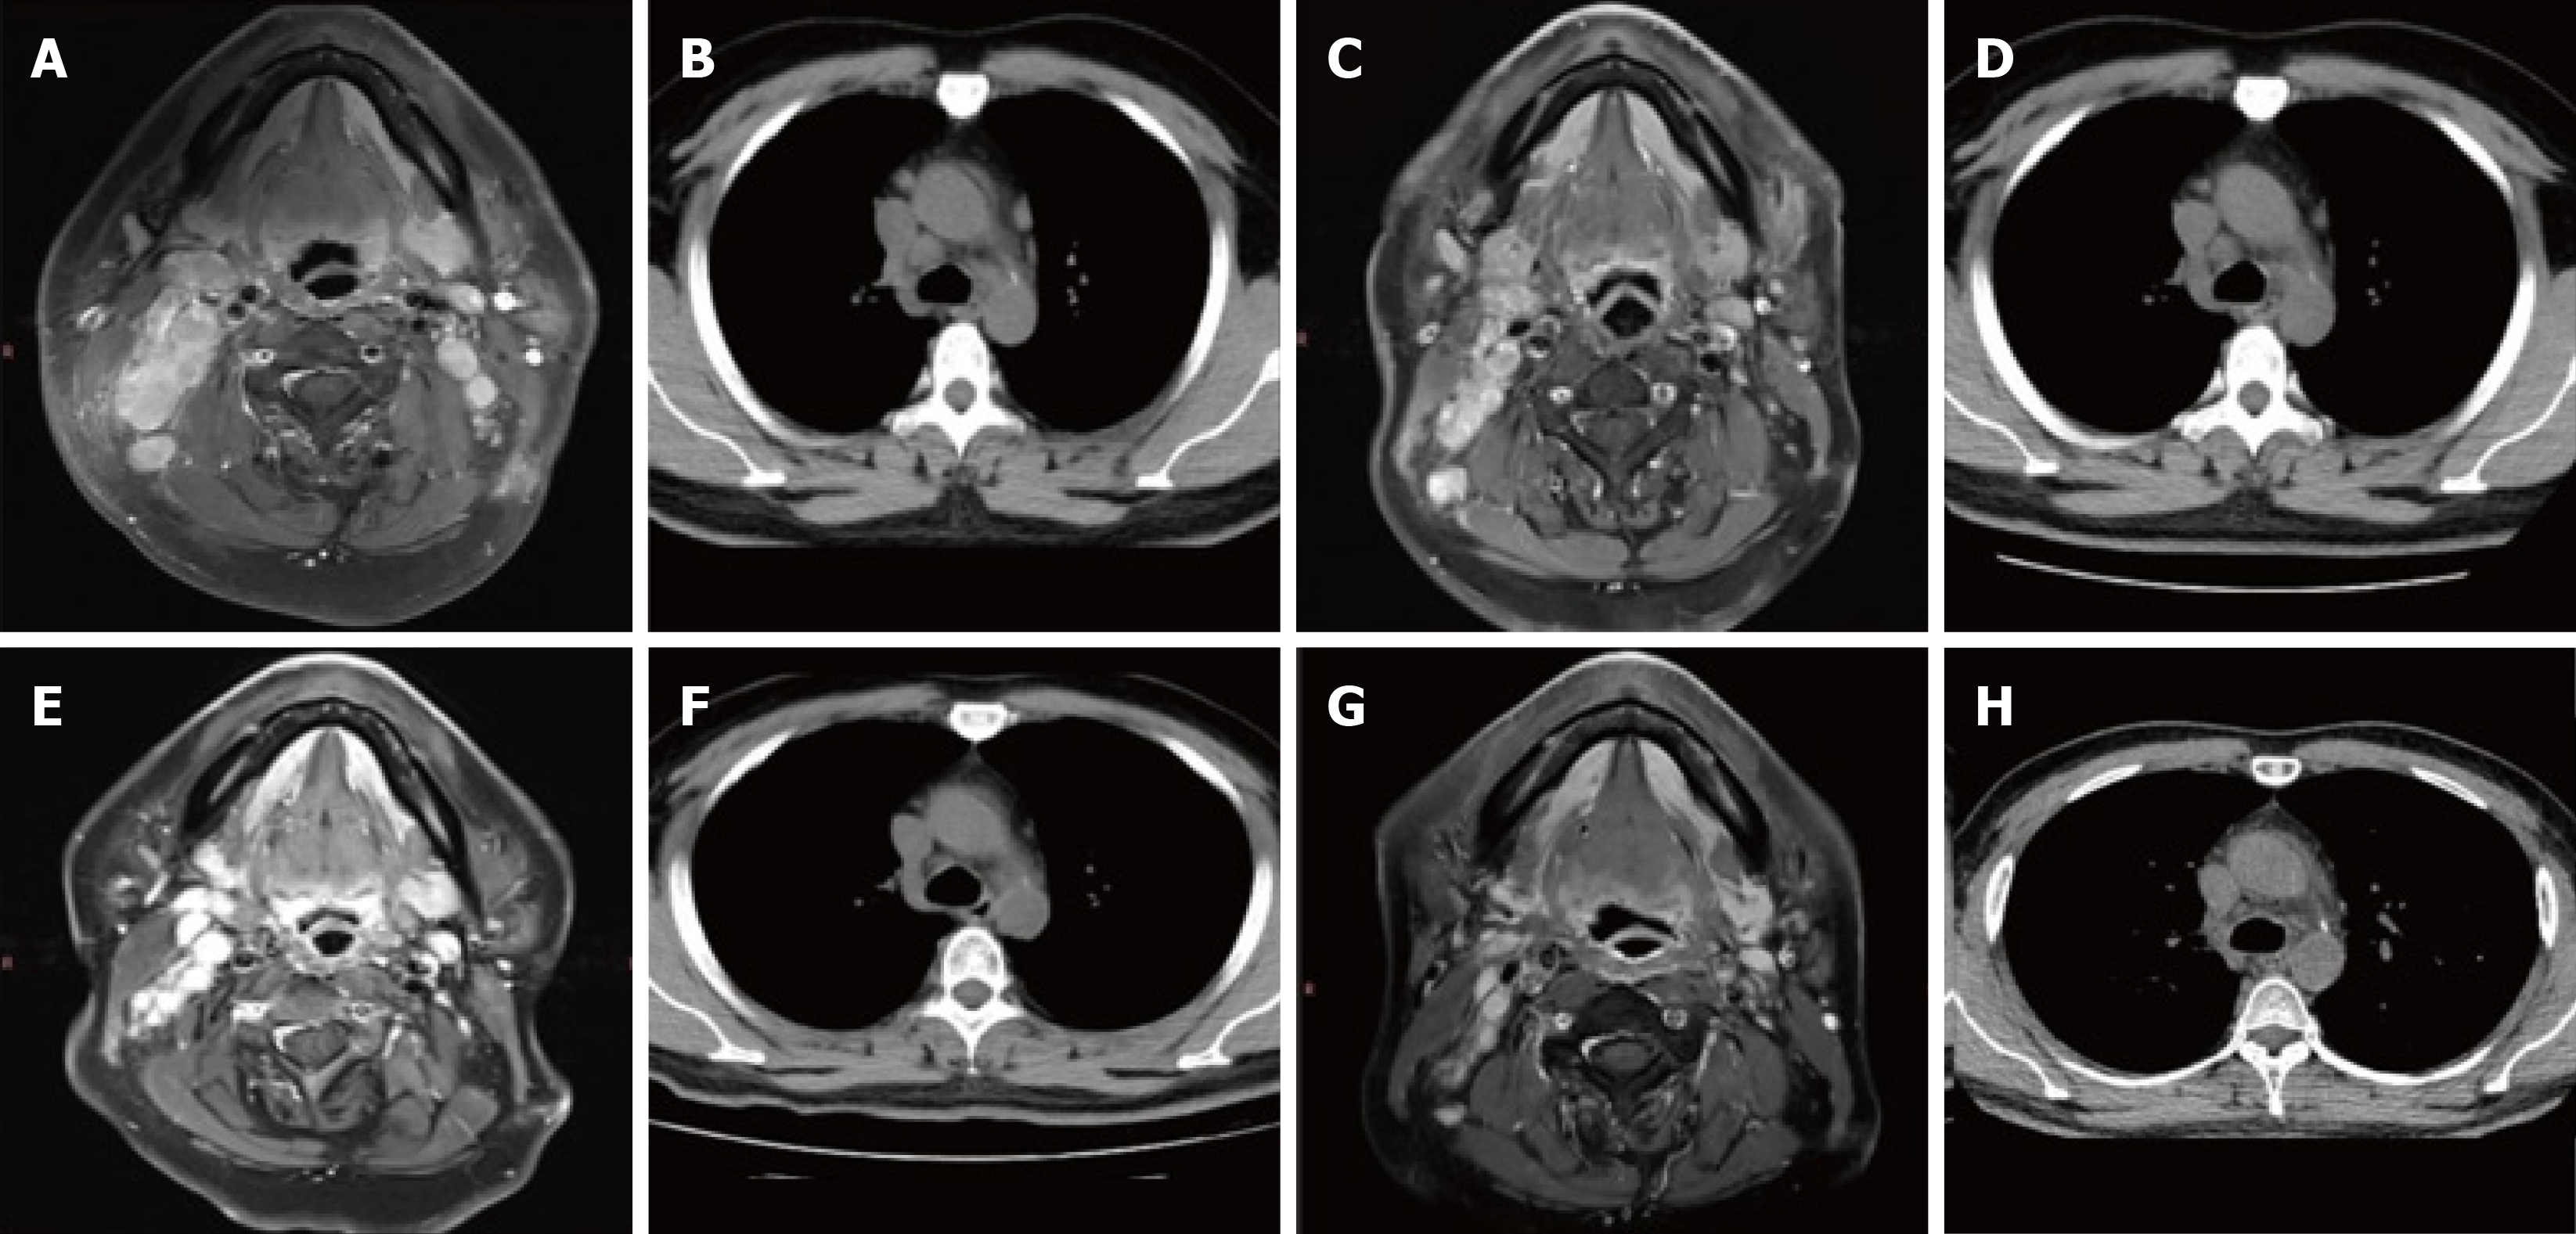
Figure 5 Nasopharynx magnetic resonance imaging (T1+C) and lung computed tomography findings of the nasopharynx.
A: Nasopharynx magnetic resonance imaging (MRI) (July 27, 2022) reveals multiple enlarged lymph nodes in both neck and retropharyngeal groups, with enhancement, partial necrosis, and fusion; B: Lung computed tomography (CT) (August 27, 2022) reveals multiple enlarged lymph nodes in the right neck, bilateral hilum, and mediastinum; C: Nasopharynx MRI (November 03, 2022) reveals that the range of lesions is slightly smaller than that in July; D: Lung CT (December 23, 2022) reveals that bilateral hilar and mediastinal lymph nodes are enlarged; E: Nasopharyngeal MRI (March 8, 2023) reveals that the range of lesions was significantly reduced compared to the October film; F: Lung CT (March 8, 2023) reveals that the range of lesions is significantly reduced compared to the November film; G: Nasopharyngeal MRI (July 5, 2023) reveals swelling and resolution of lymph nodes, diffuse swelling of submandibular soft tissue, slight thickening of the left side of the mucosa in the nasopharynx, and a more uniform signal; H: Lung CT (July 5, 2023) reveals lymph node enlargement subside.
Figure 6 Delineation of the target area for local intensity modulated radiotherapy plan.
A: Lung target area: GTVnd2 = 2 Gy × 33f, CTV = 1.82 Gy × 33f; B: Nasopharynx target area: GTV = 2.12 Gy × 33f, CTV = 1.82 Gy × 33f; C: Neck Lymph Nodes: GTVnd1 = 2.12 Gy × 33f, CTV = 1.82 Gy × 33f. CTV: Clinical target volume.
Figure 7 Computed tomography of the patient's lungs during the second pre-treatment period.
A: (March 2024) reveals slightly enlarged mediastinal lymph nodes; B: (June 17, 2024) reveals that Left lung micronodule, bilateral hilar and mediastinal lymph nodes enlarged but smaller than before; C: (September 7, 2024) reveals that Lymph nodes are smaller than before.
- Citation: Zhou XY, Jiang YJ, Guo XM, Han DH, Liu Y, Qiao Q. Application of circulating tumor DNA liquid biopsy in nasopharyngeal carcinoma: A case report and review of literature. World J Clin Cases 2025; 13(21): 105066
- URL: https://www.wjgnet.com/2307-8960/full/v13/i21/105066.htm
- DOI: https://dx.doi.org/10.12998/wjcc.v13.i21.105066


