Copyright
©The Author(s) 2025.
World J Clin Cases. Jul 16, 2025; 13(20): 104556
Published online Jul 16, 2025. doi: 10.12998/wjcc.v13.i20.104556
Published online Jul 16, 2025. doi: 10.12998/wjcc.v13.i20.104556
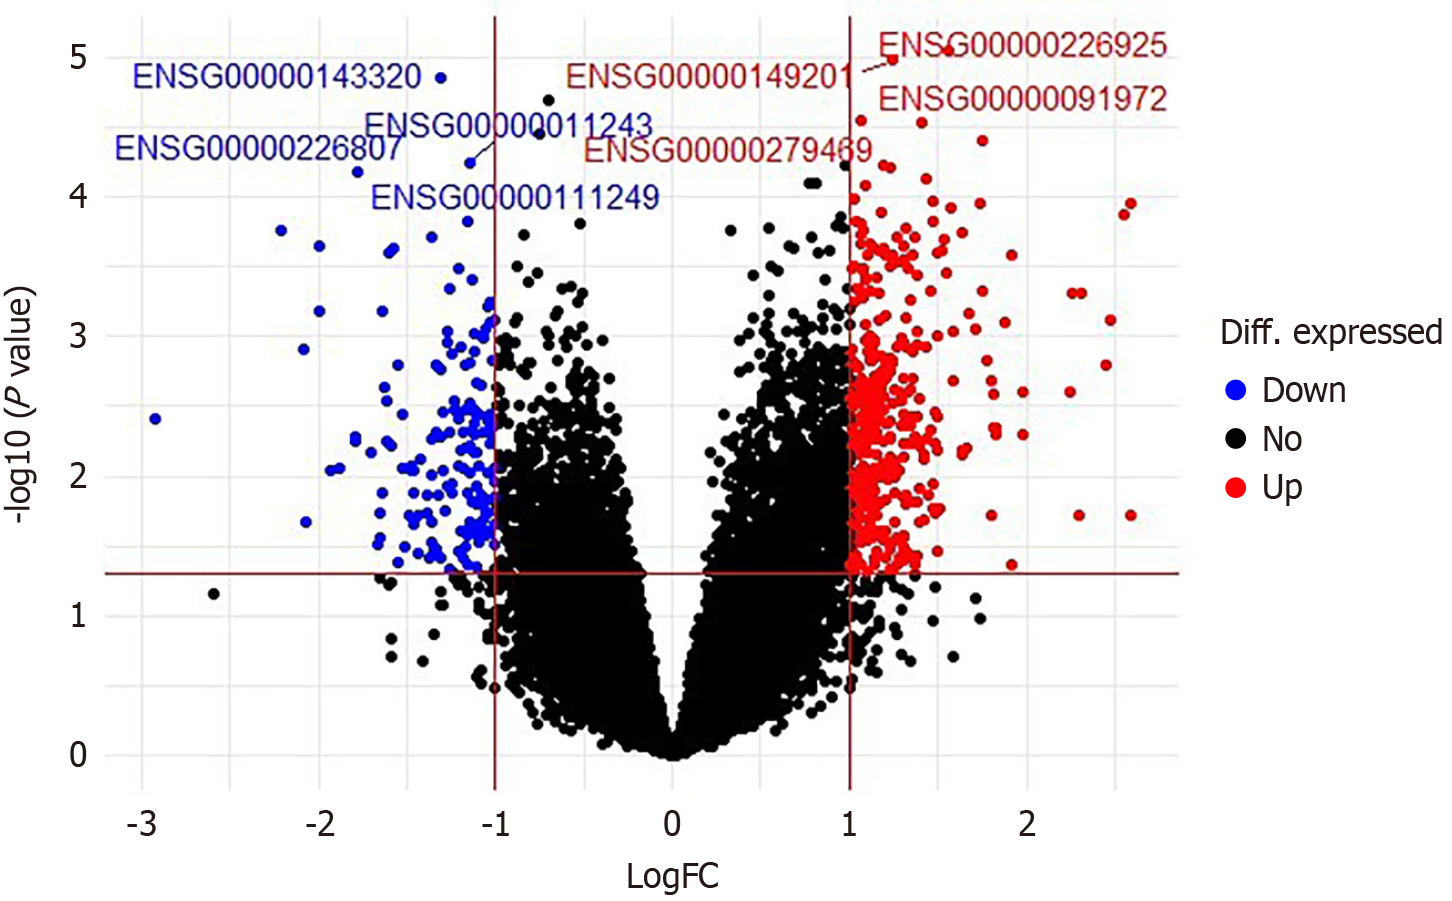
Figure 1 A volcano plot graph.
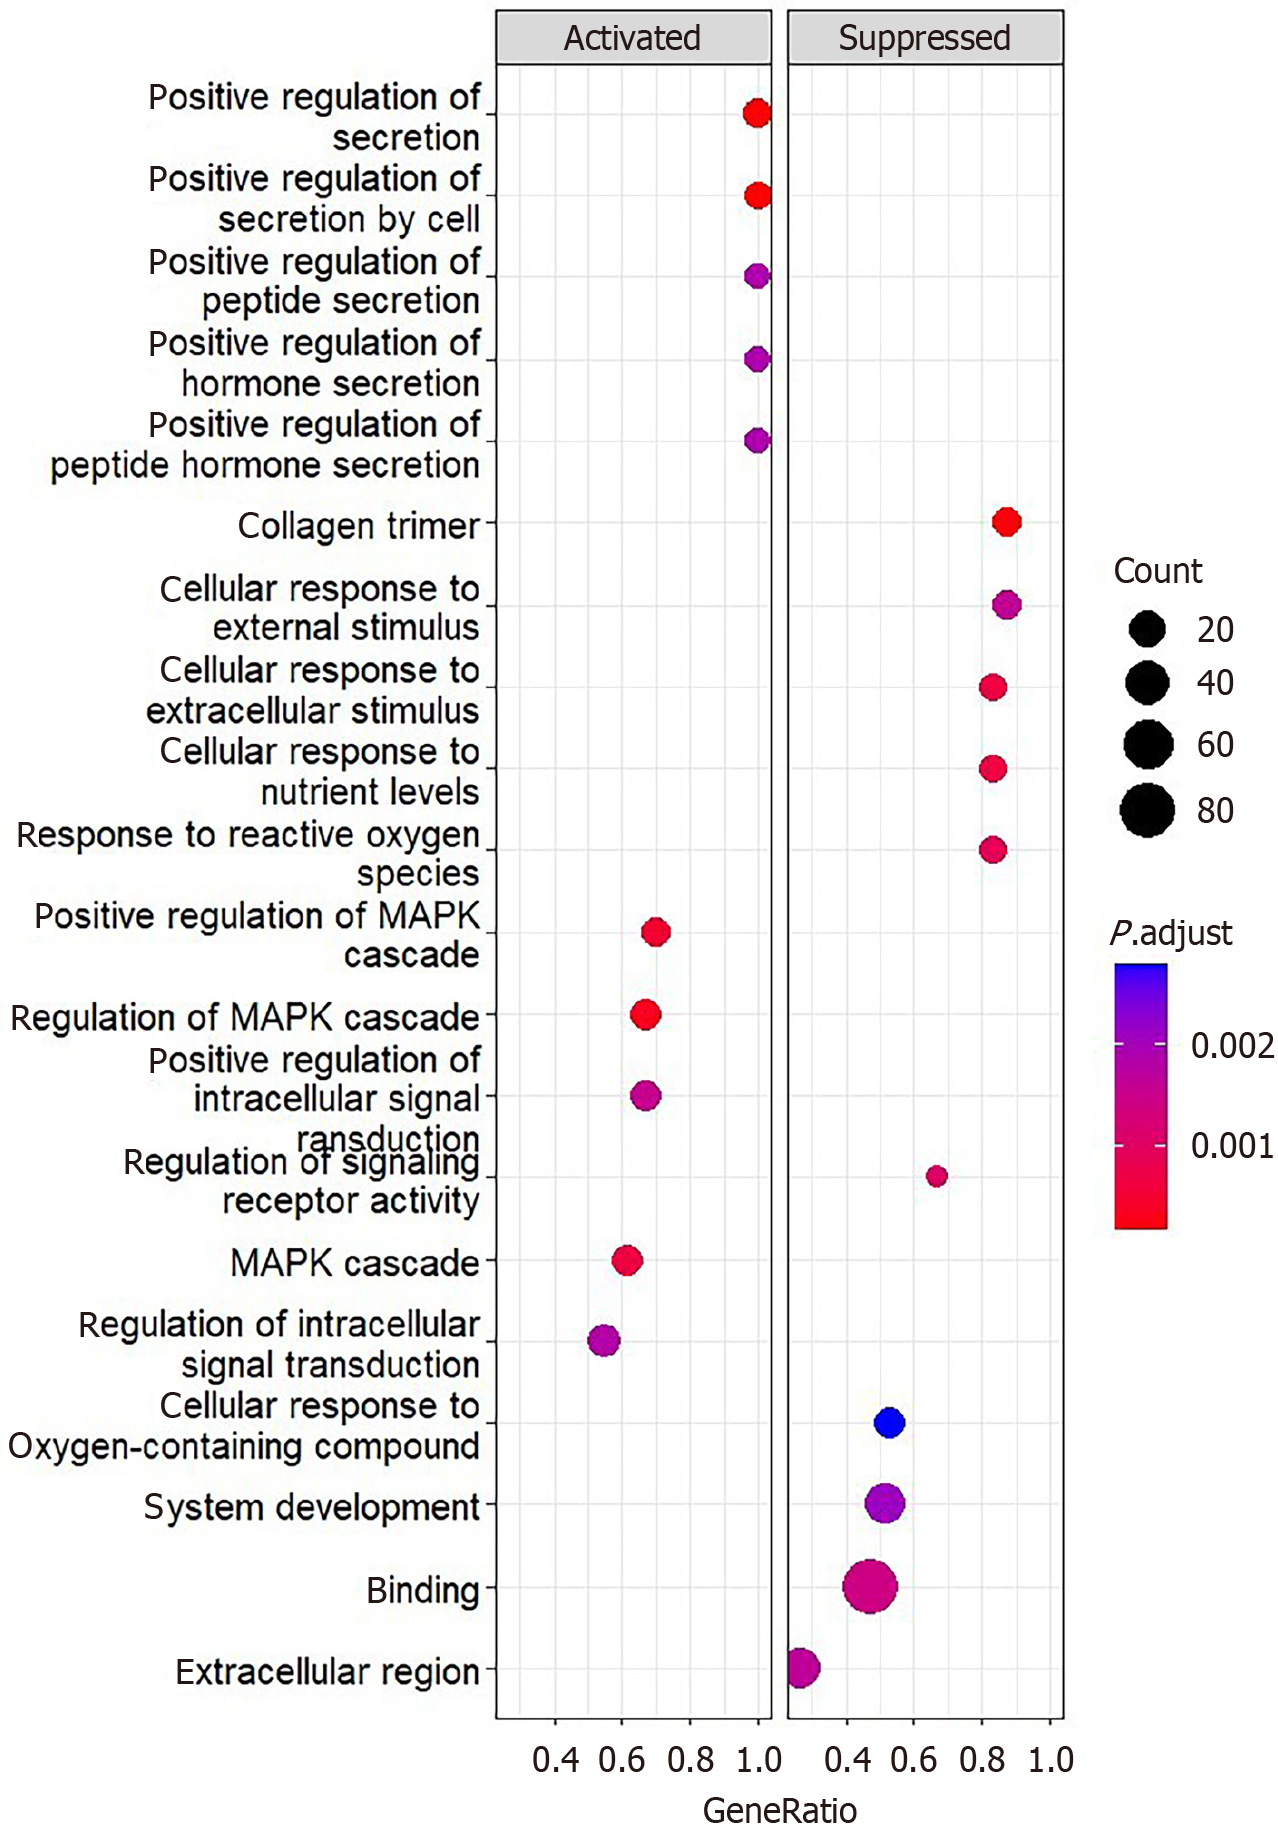
Figure 2 Gene ontology enrichment analysis for control and endometriosis groups.
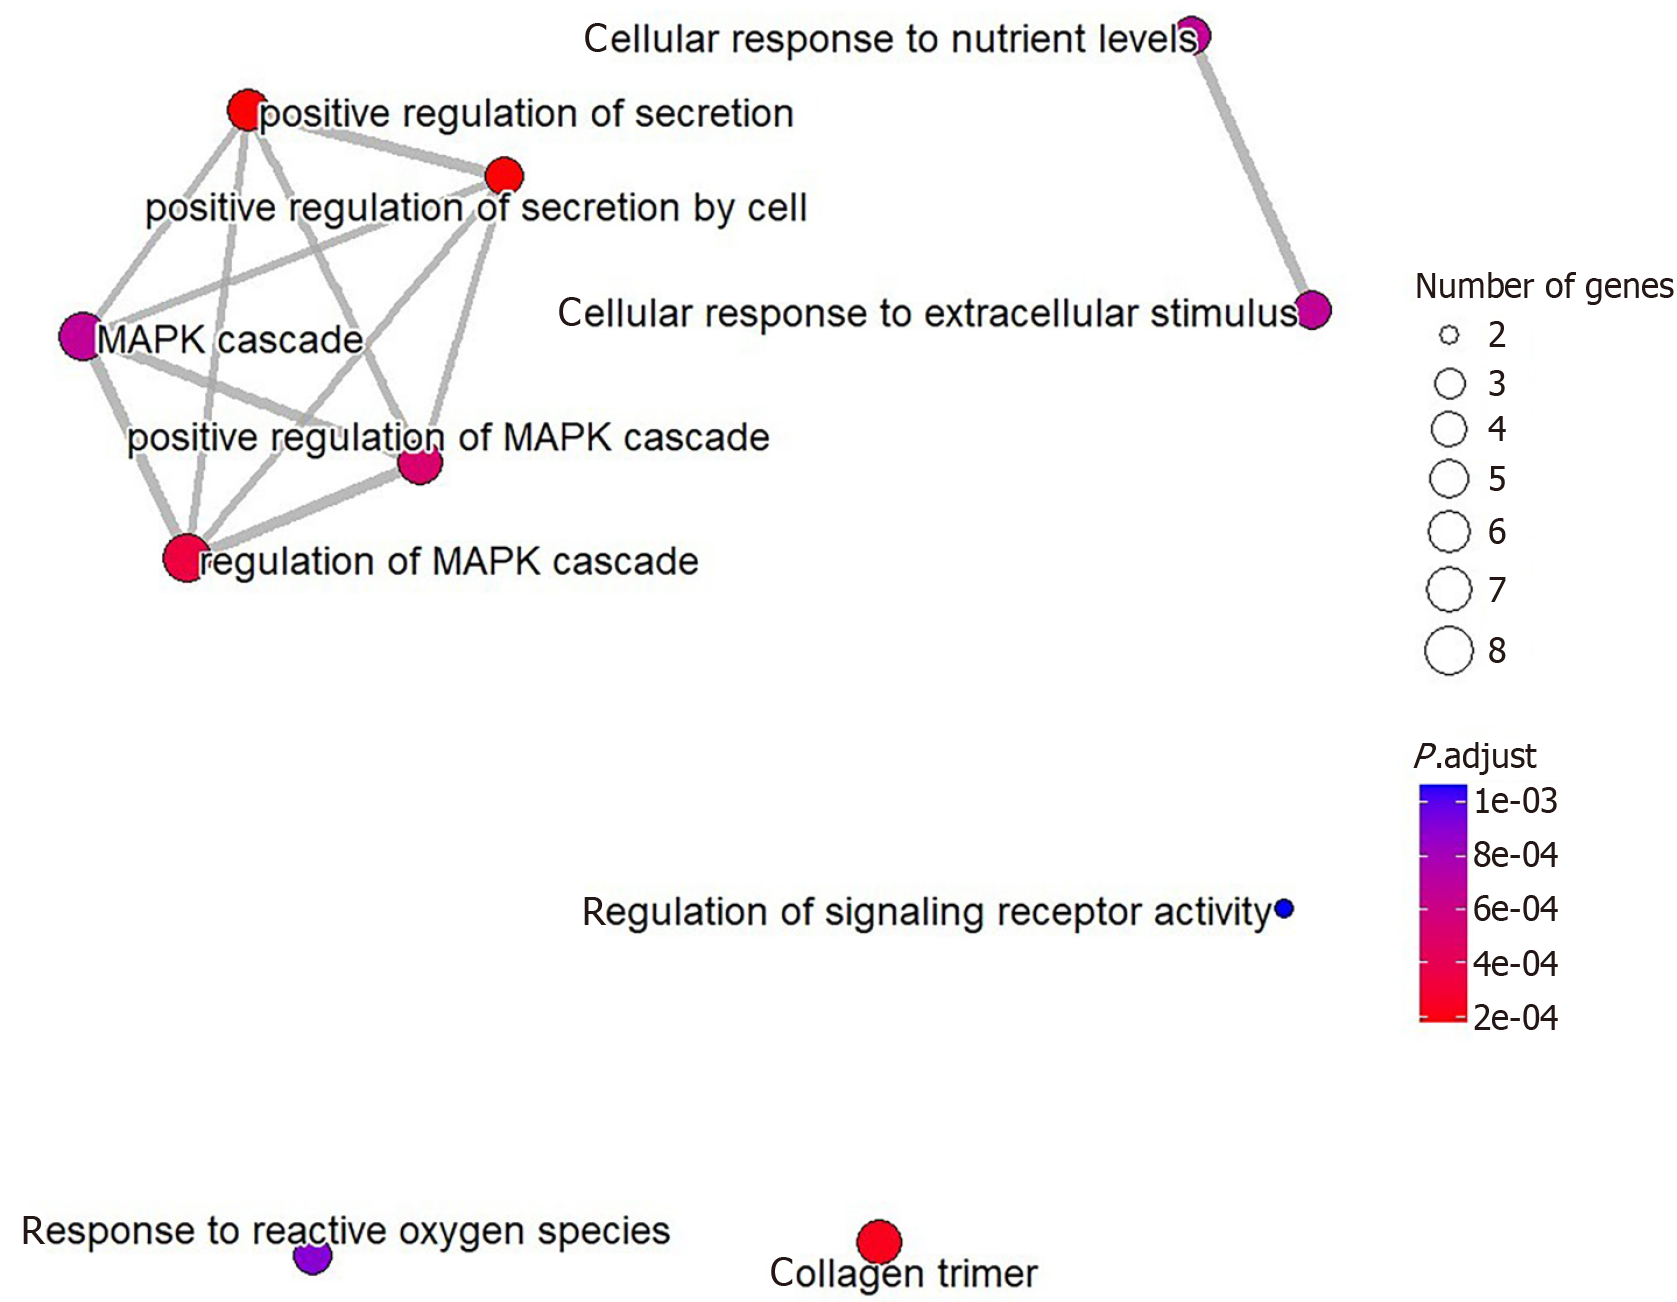
Figure 3 Network map of semantic relationships between gene ontology terms.
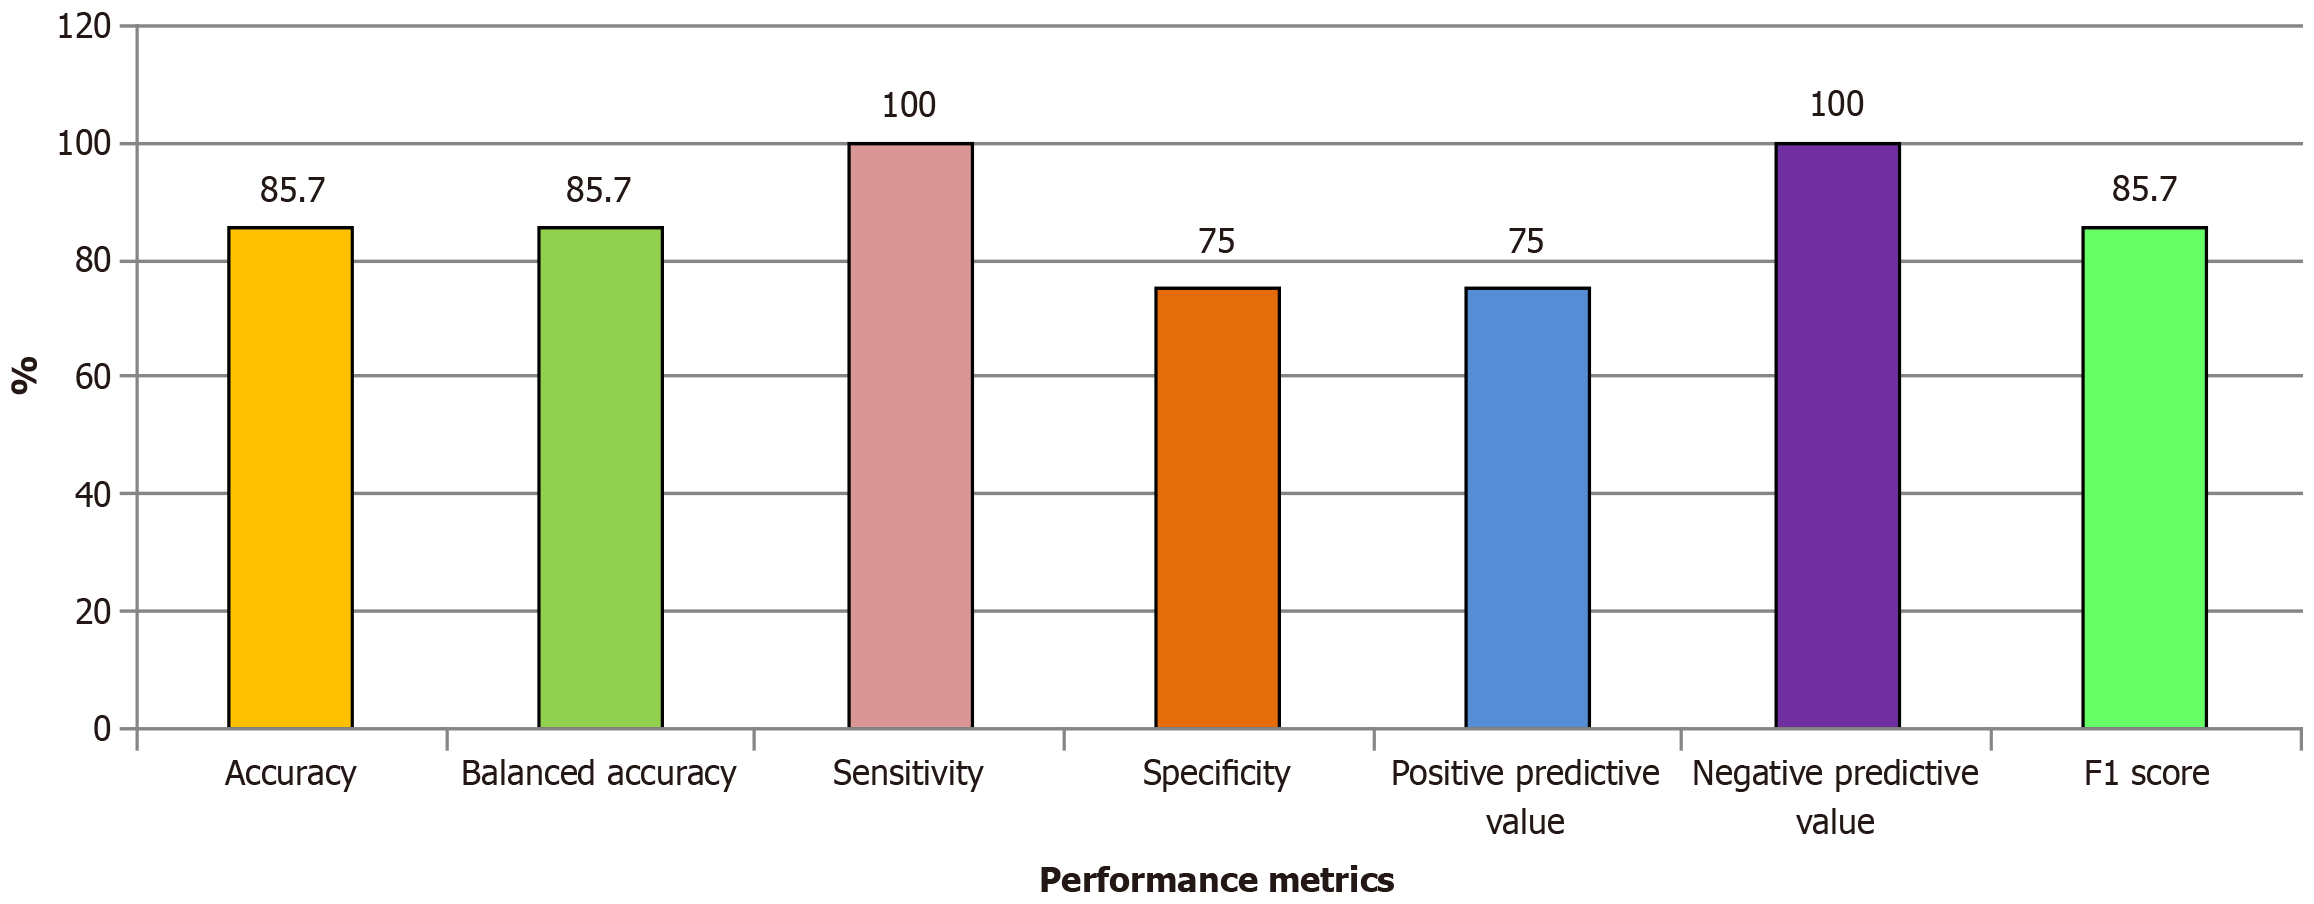
Figure 4 Graph of values for performance criteria obtained from Bagged Classification and Regression Trees models.
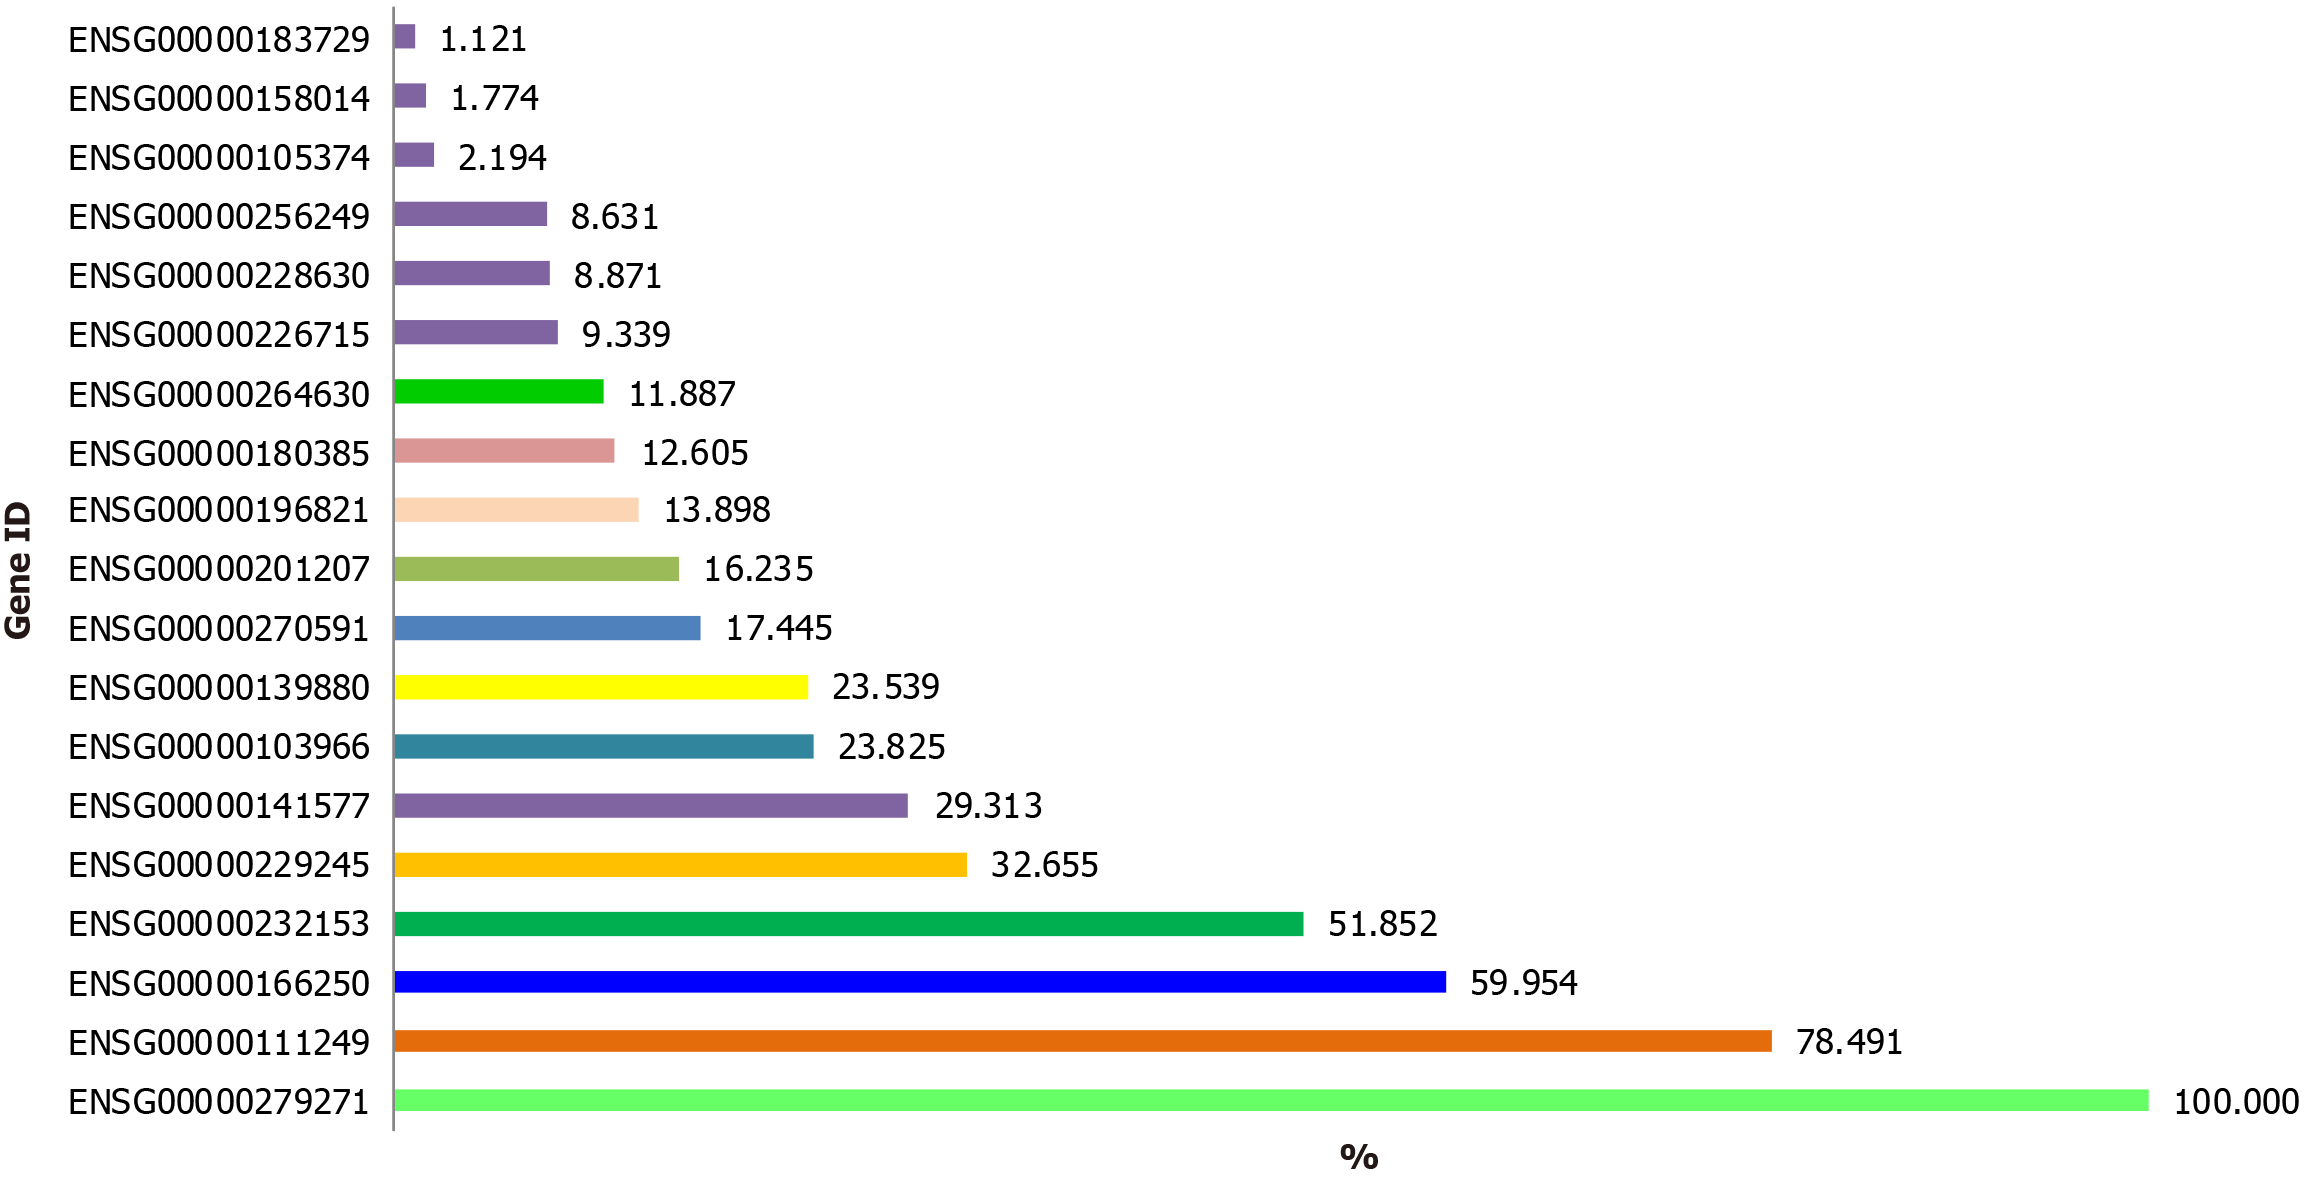
Figure 5 The graphic of gene importance values for predicting the output variable.
- Citation: Kucukakcali Z, Akbulut S, Colak C. Prediction of genomic biomarkers for endometriosis using the transcriptomic dataset. World J Clin Cases 2025; 13(20): 104556
- URL: https://www.wjgnet.com/2307-8960/full/v13/i20/104556.htm
- DOI: https://dx.doi.org/10.12998/wjcc.v13.i20.104556


