Copyright
©The Author(s) 2025.
World J Clin Cases. Jun 16, 2025; 13(17): 103350
Published online Jun 16, 2025. doi: 10.12998/wjcc.v13.i17.103350
Published online Jun 16, 2025. doi: 10.12998/wjcc.v13.i17.103350
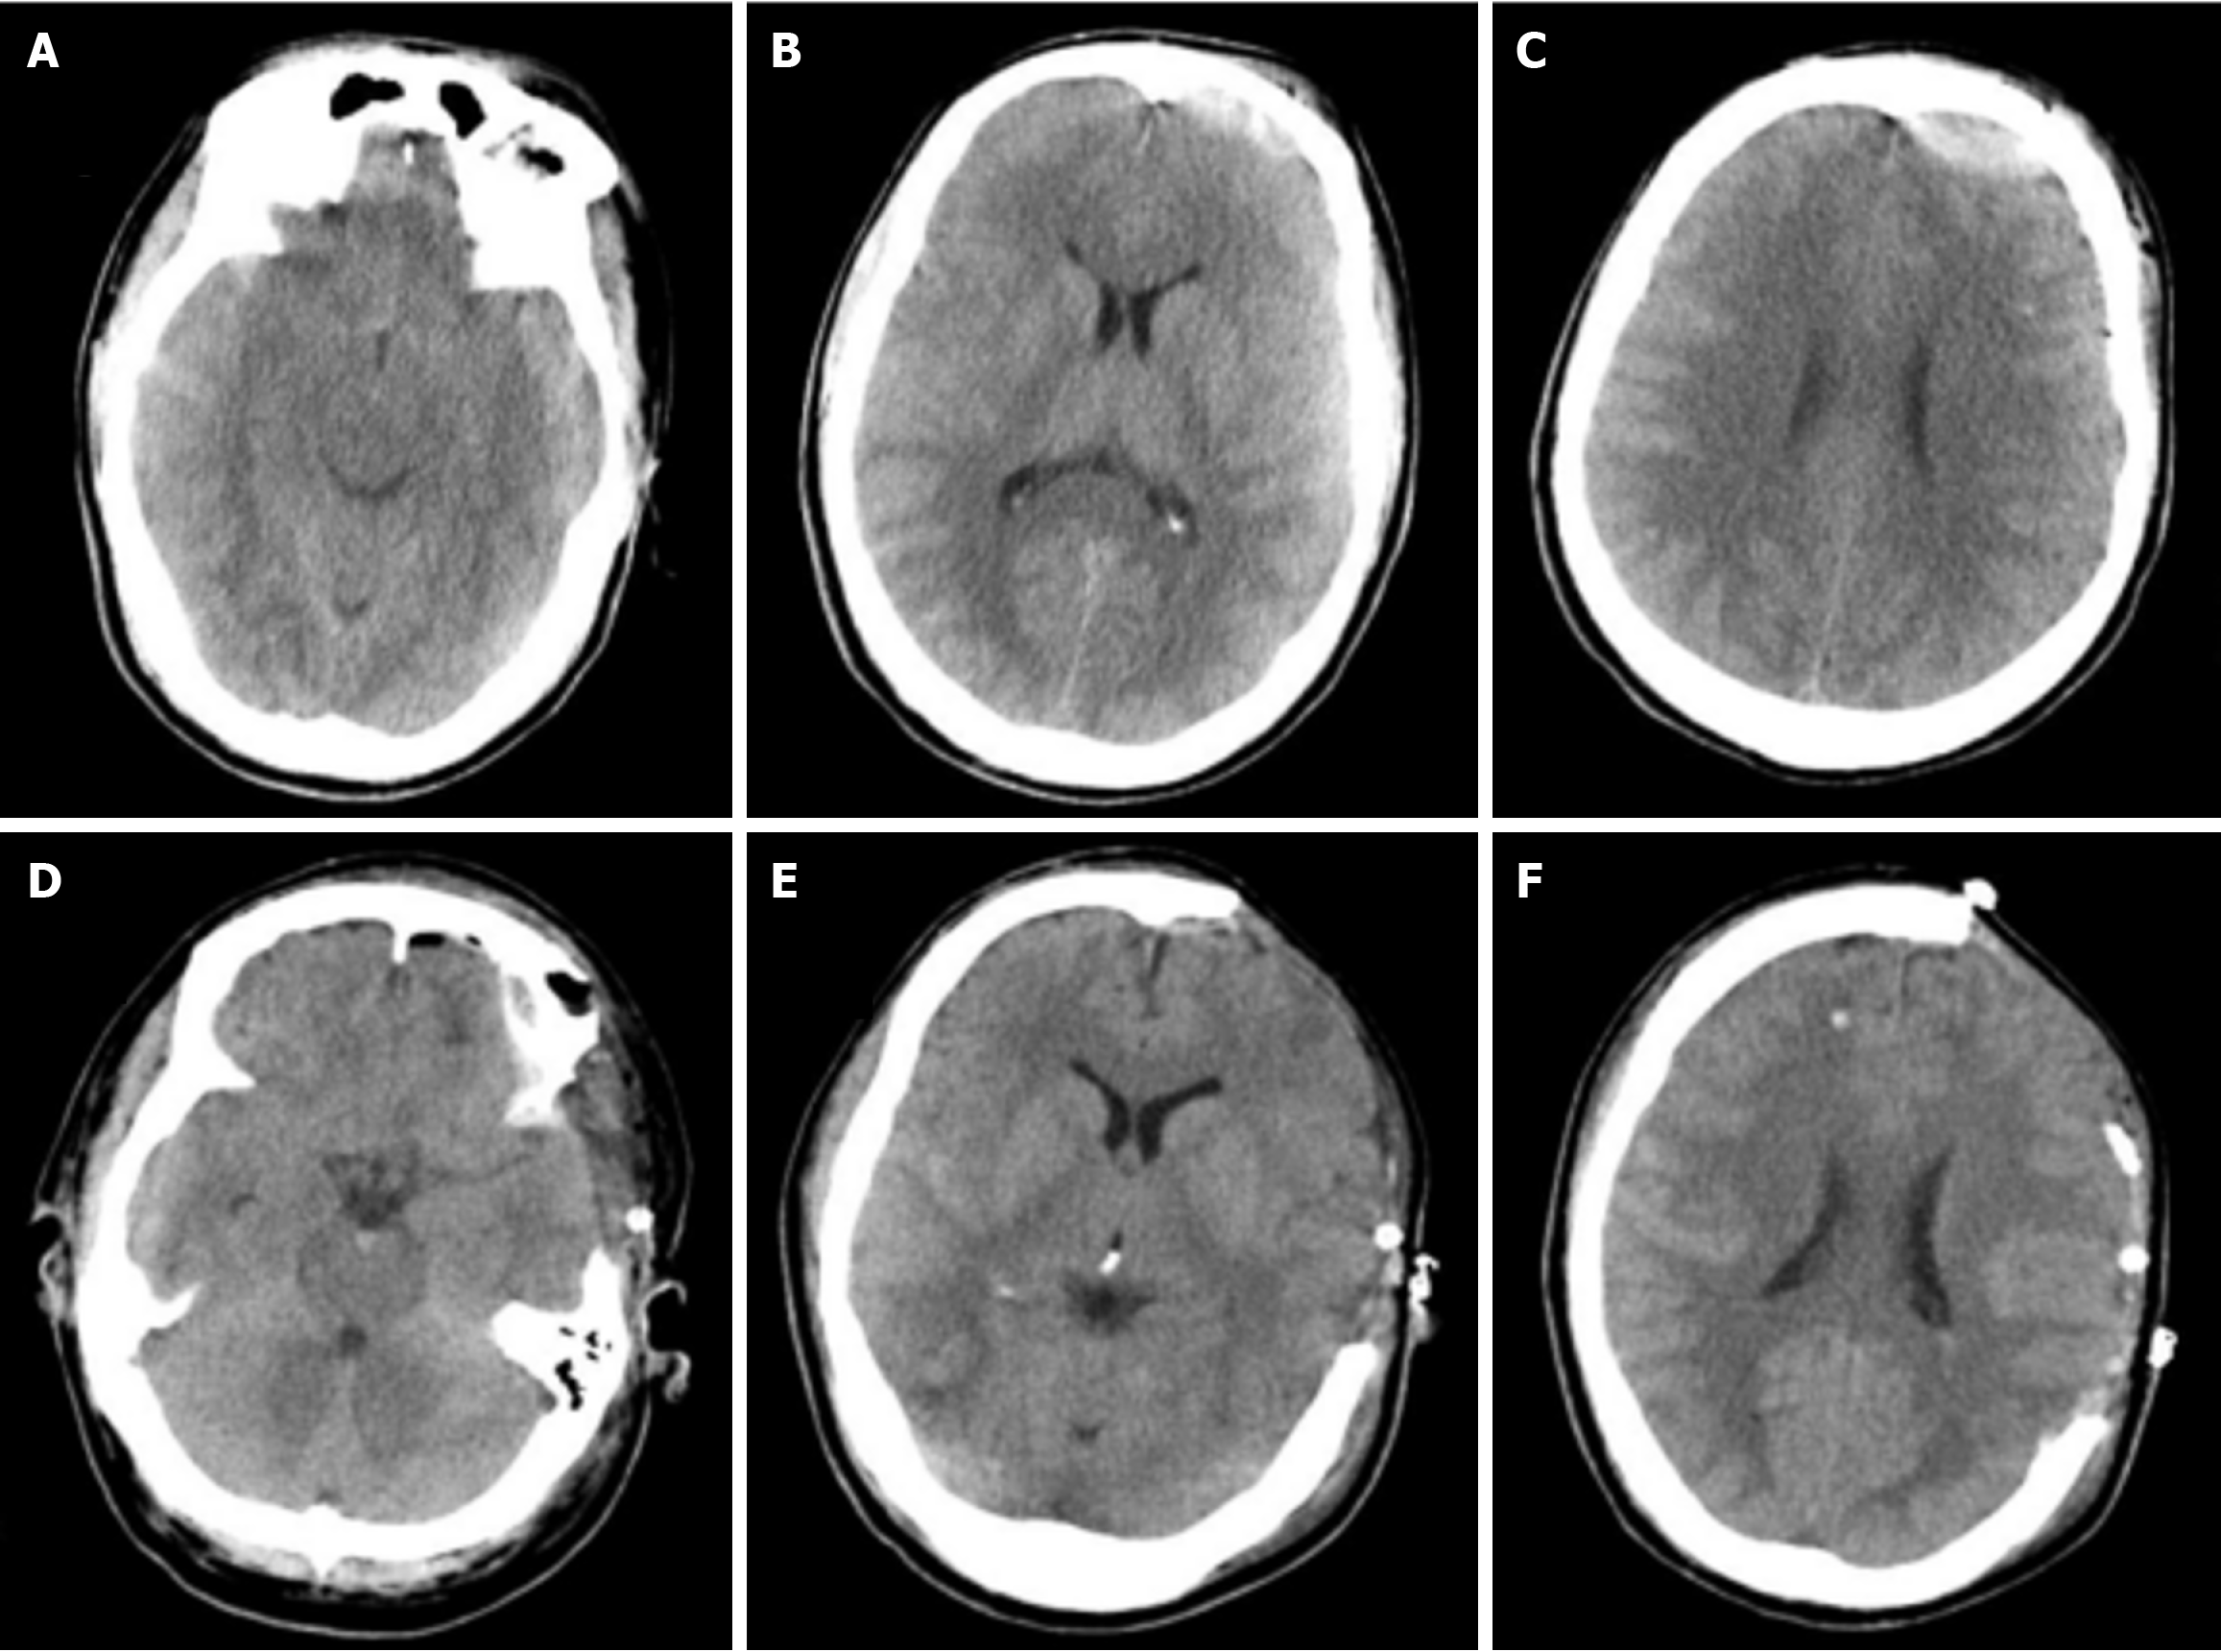
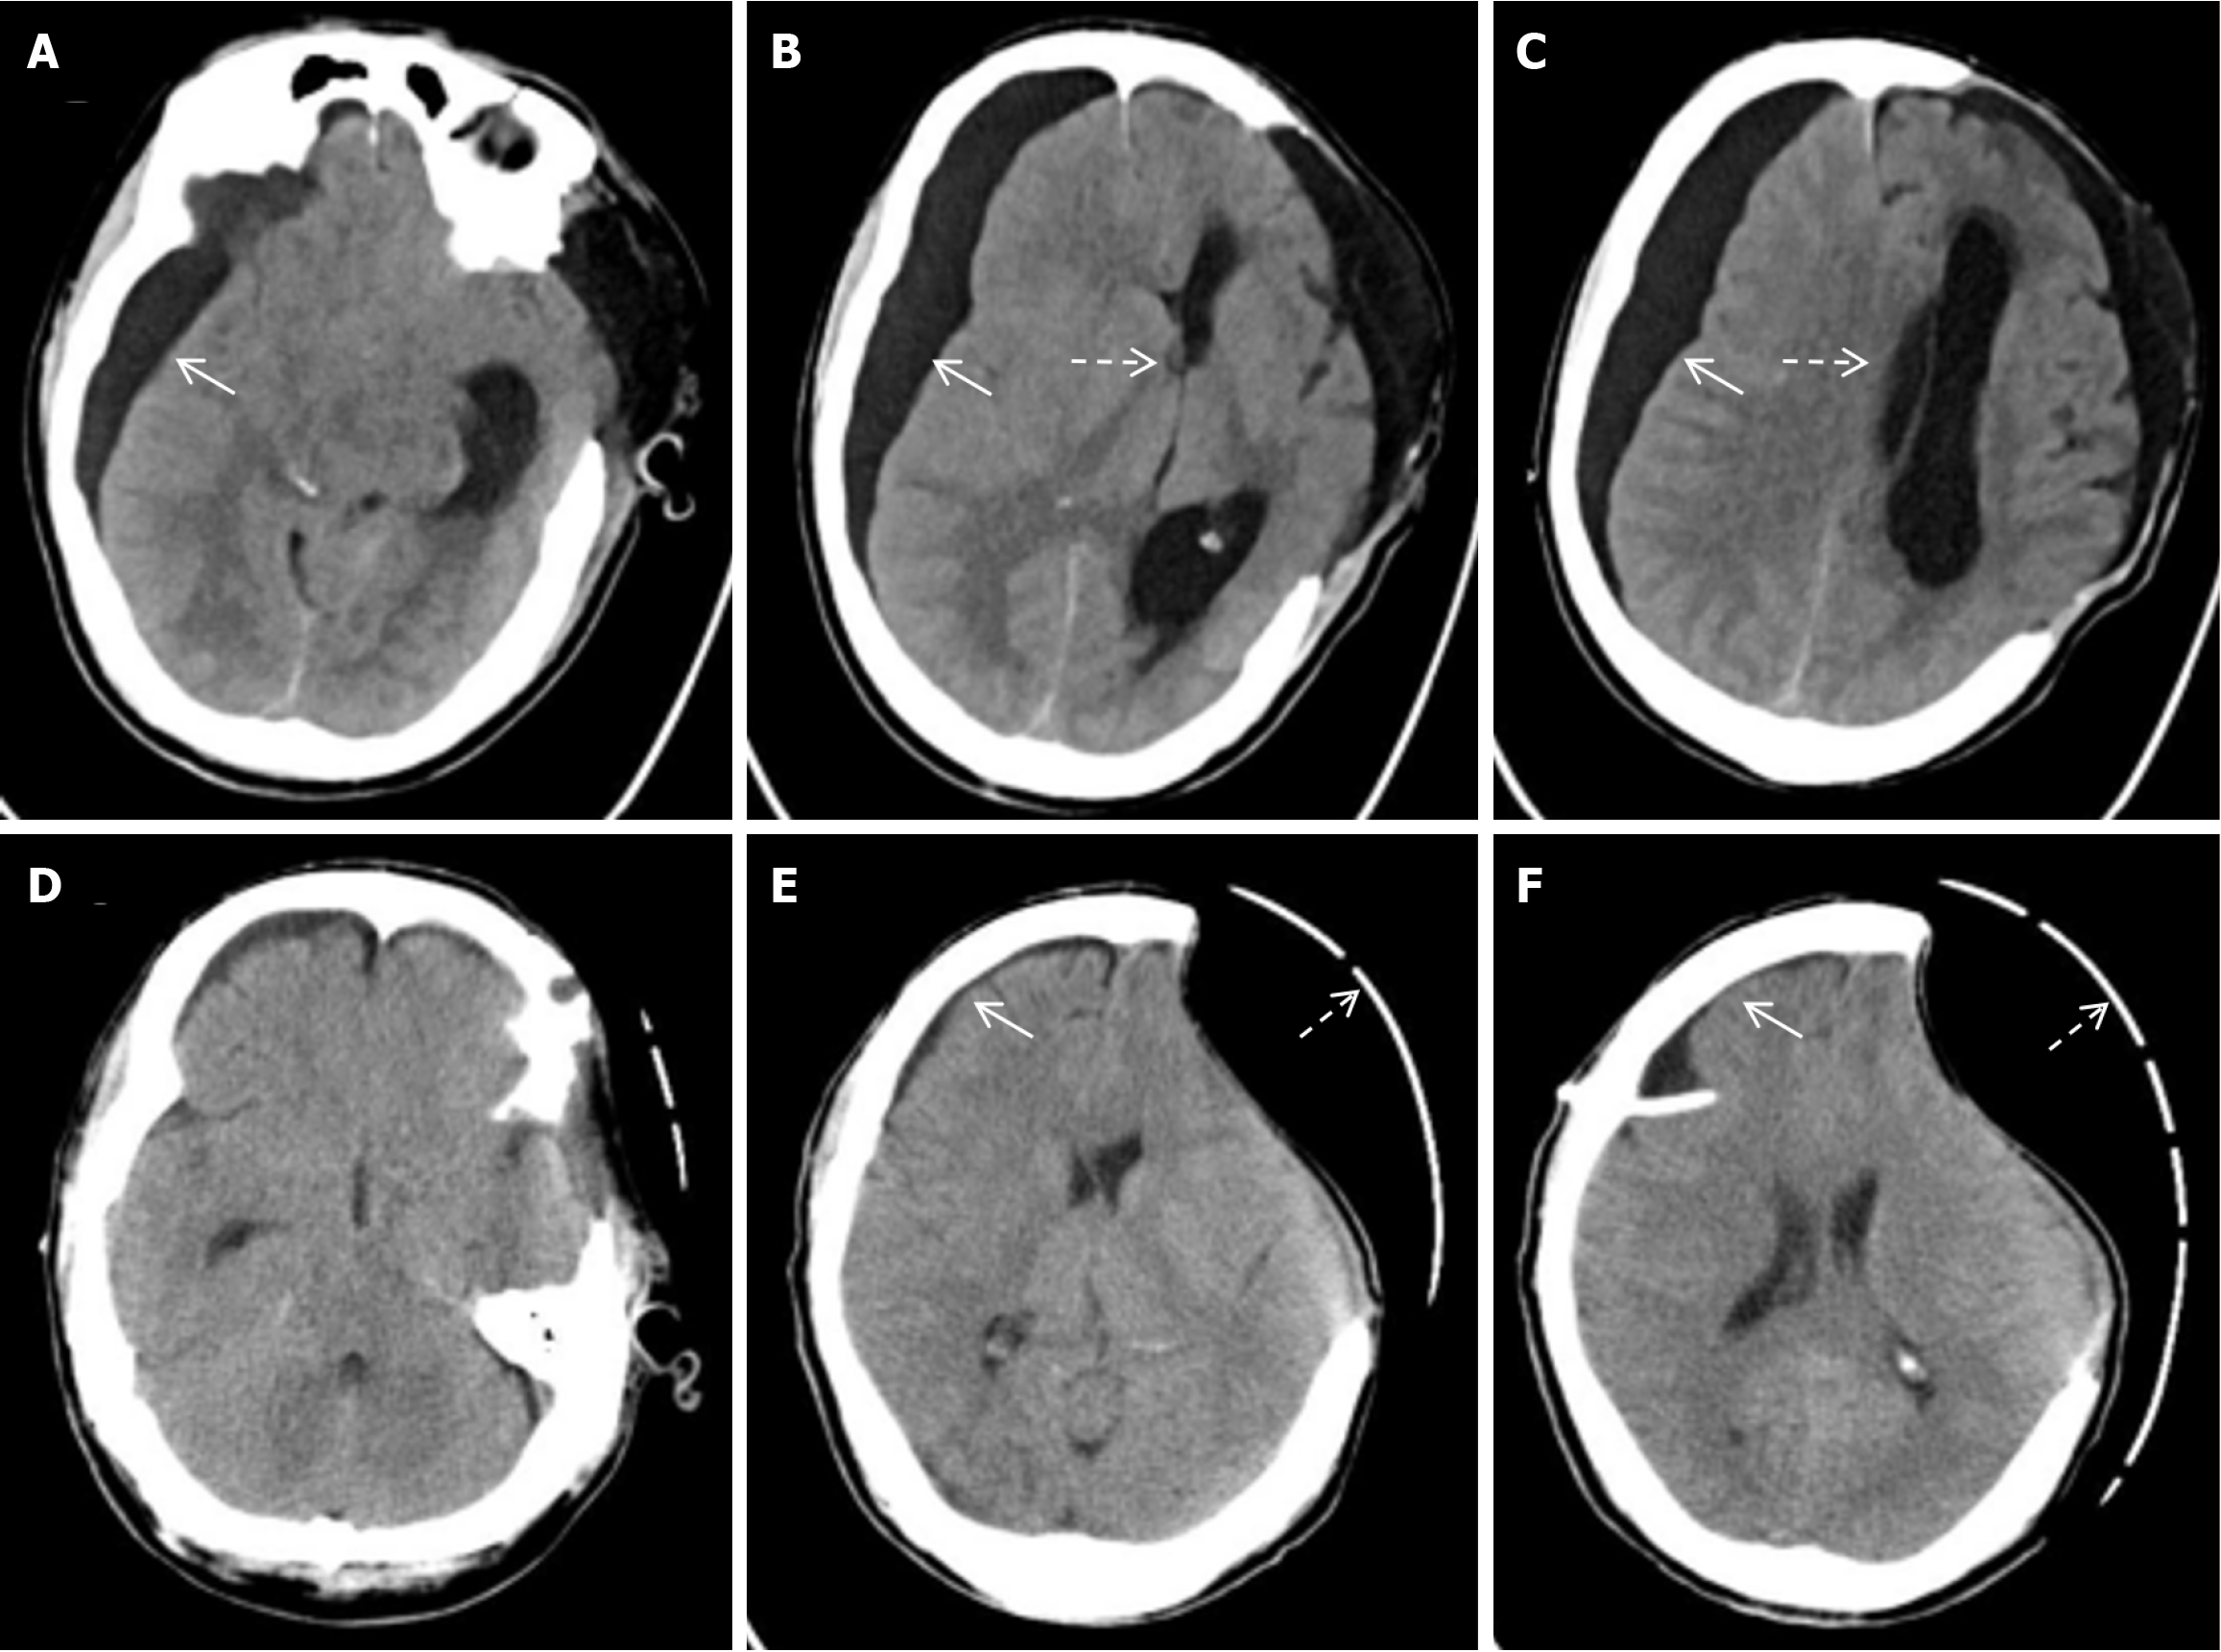
Figure 1 Brain computed tomography scan before and after decompressive craniectomy.
A-C: Brain computed tomography scan on admission; D-F: Brain computed tomography scan on the first day after decompressive craniectomy.
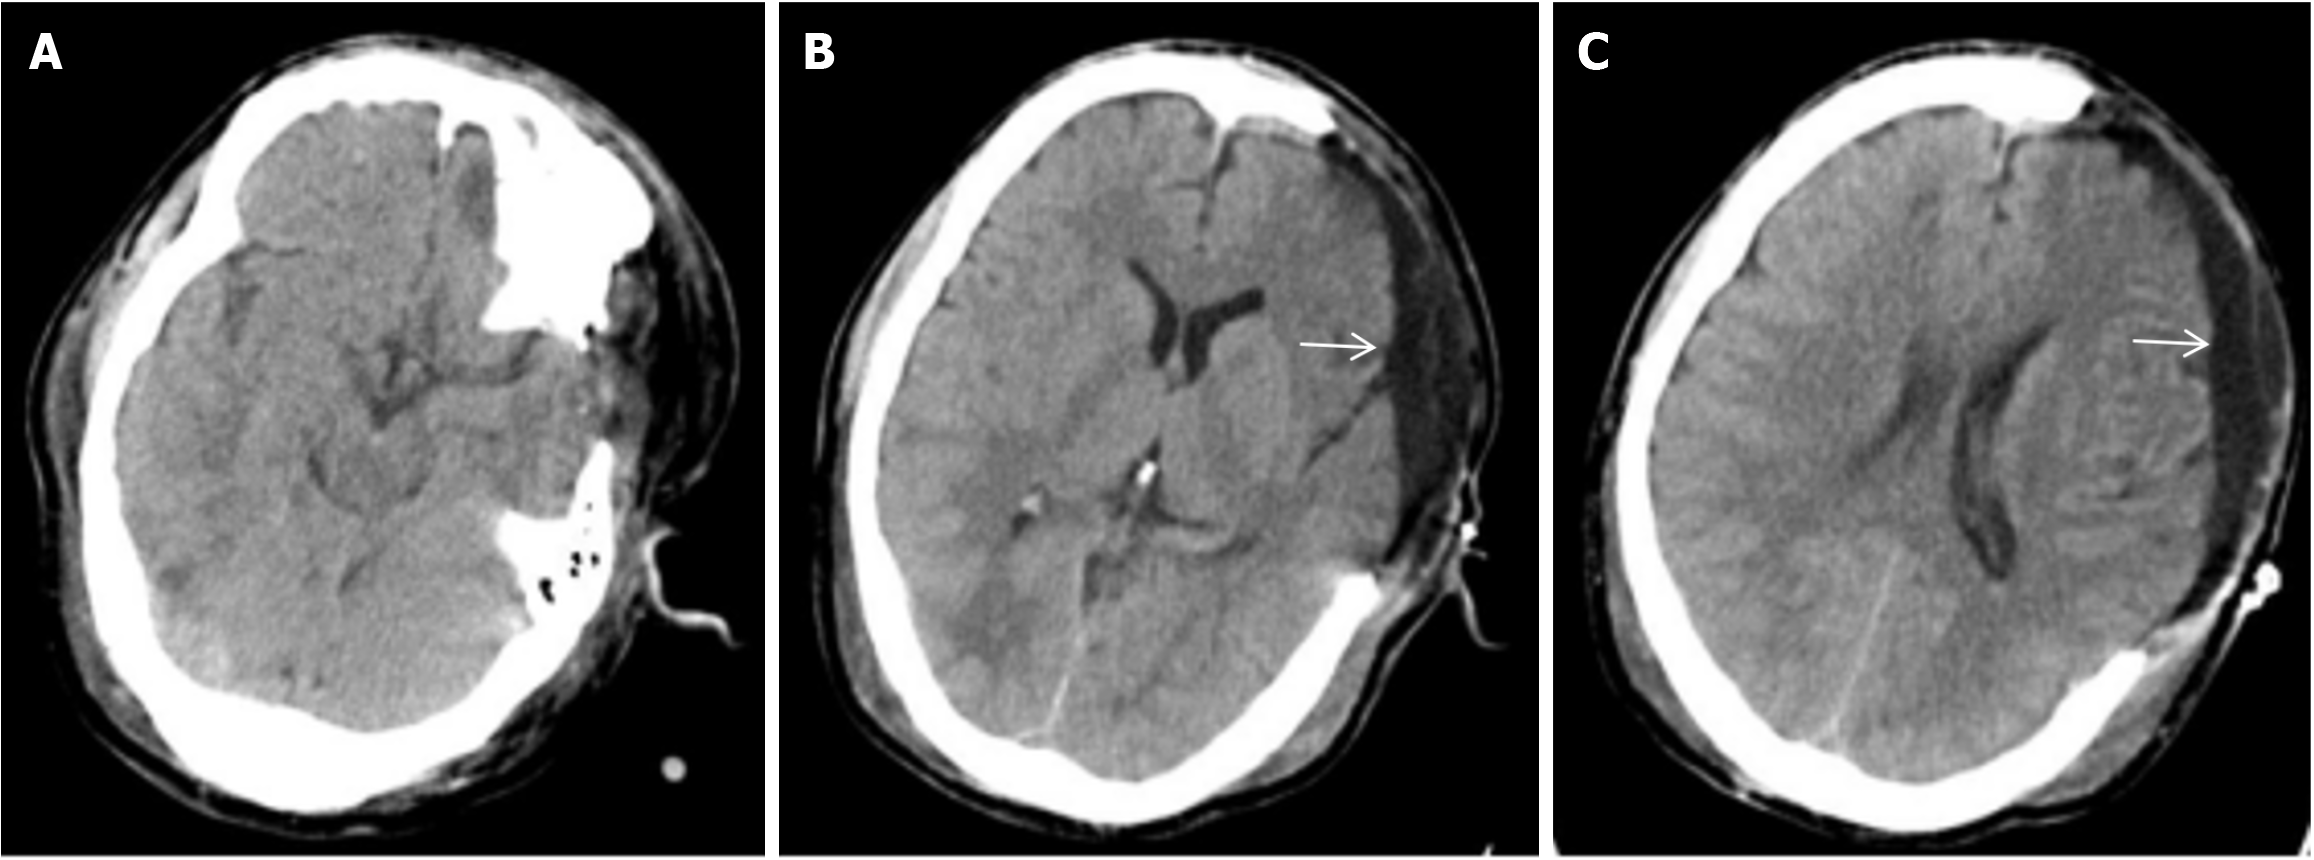
Figure 2 Brain computed tomography scan 7 days after decompressive craniectomy.
A-C: Brain computed tomography scan 7 days after decompressive craniectomy. White solid arrow: Postoperative left subdural fluid accumulation.
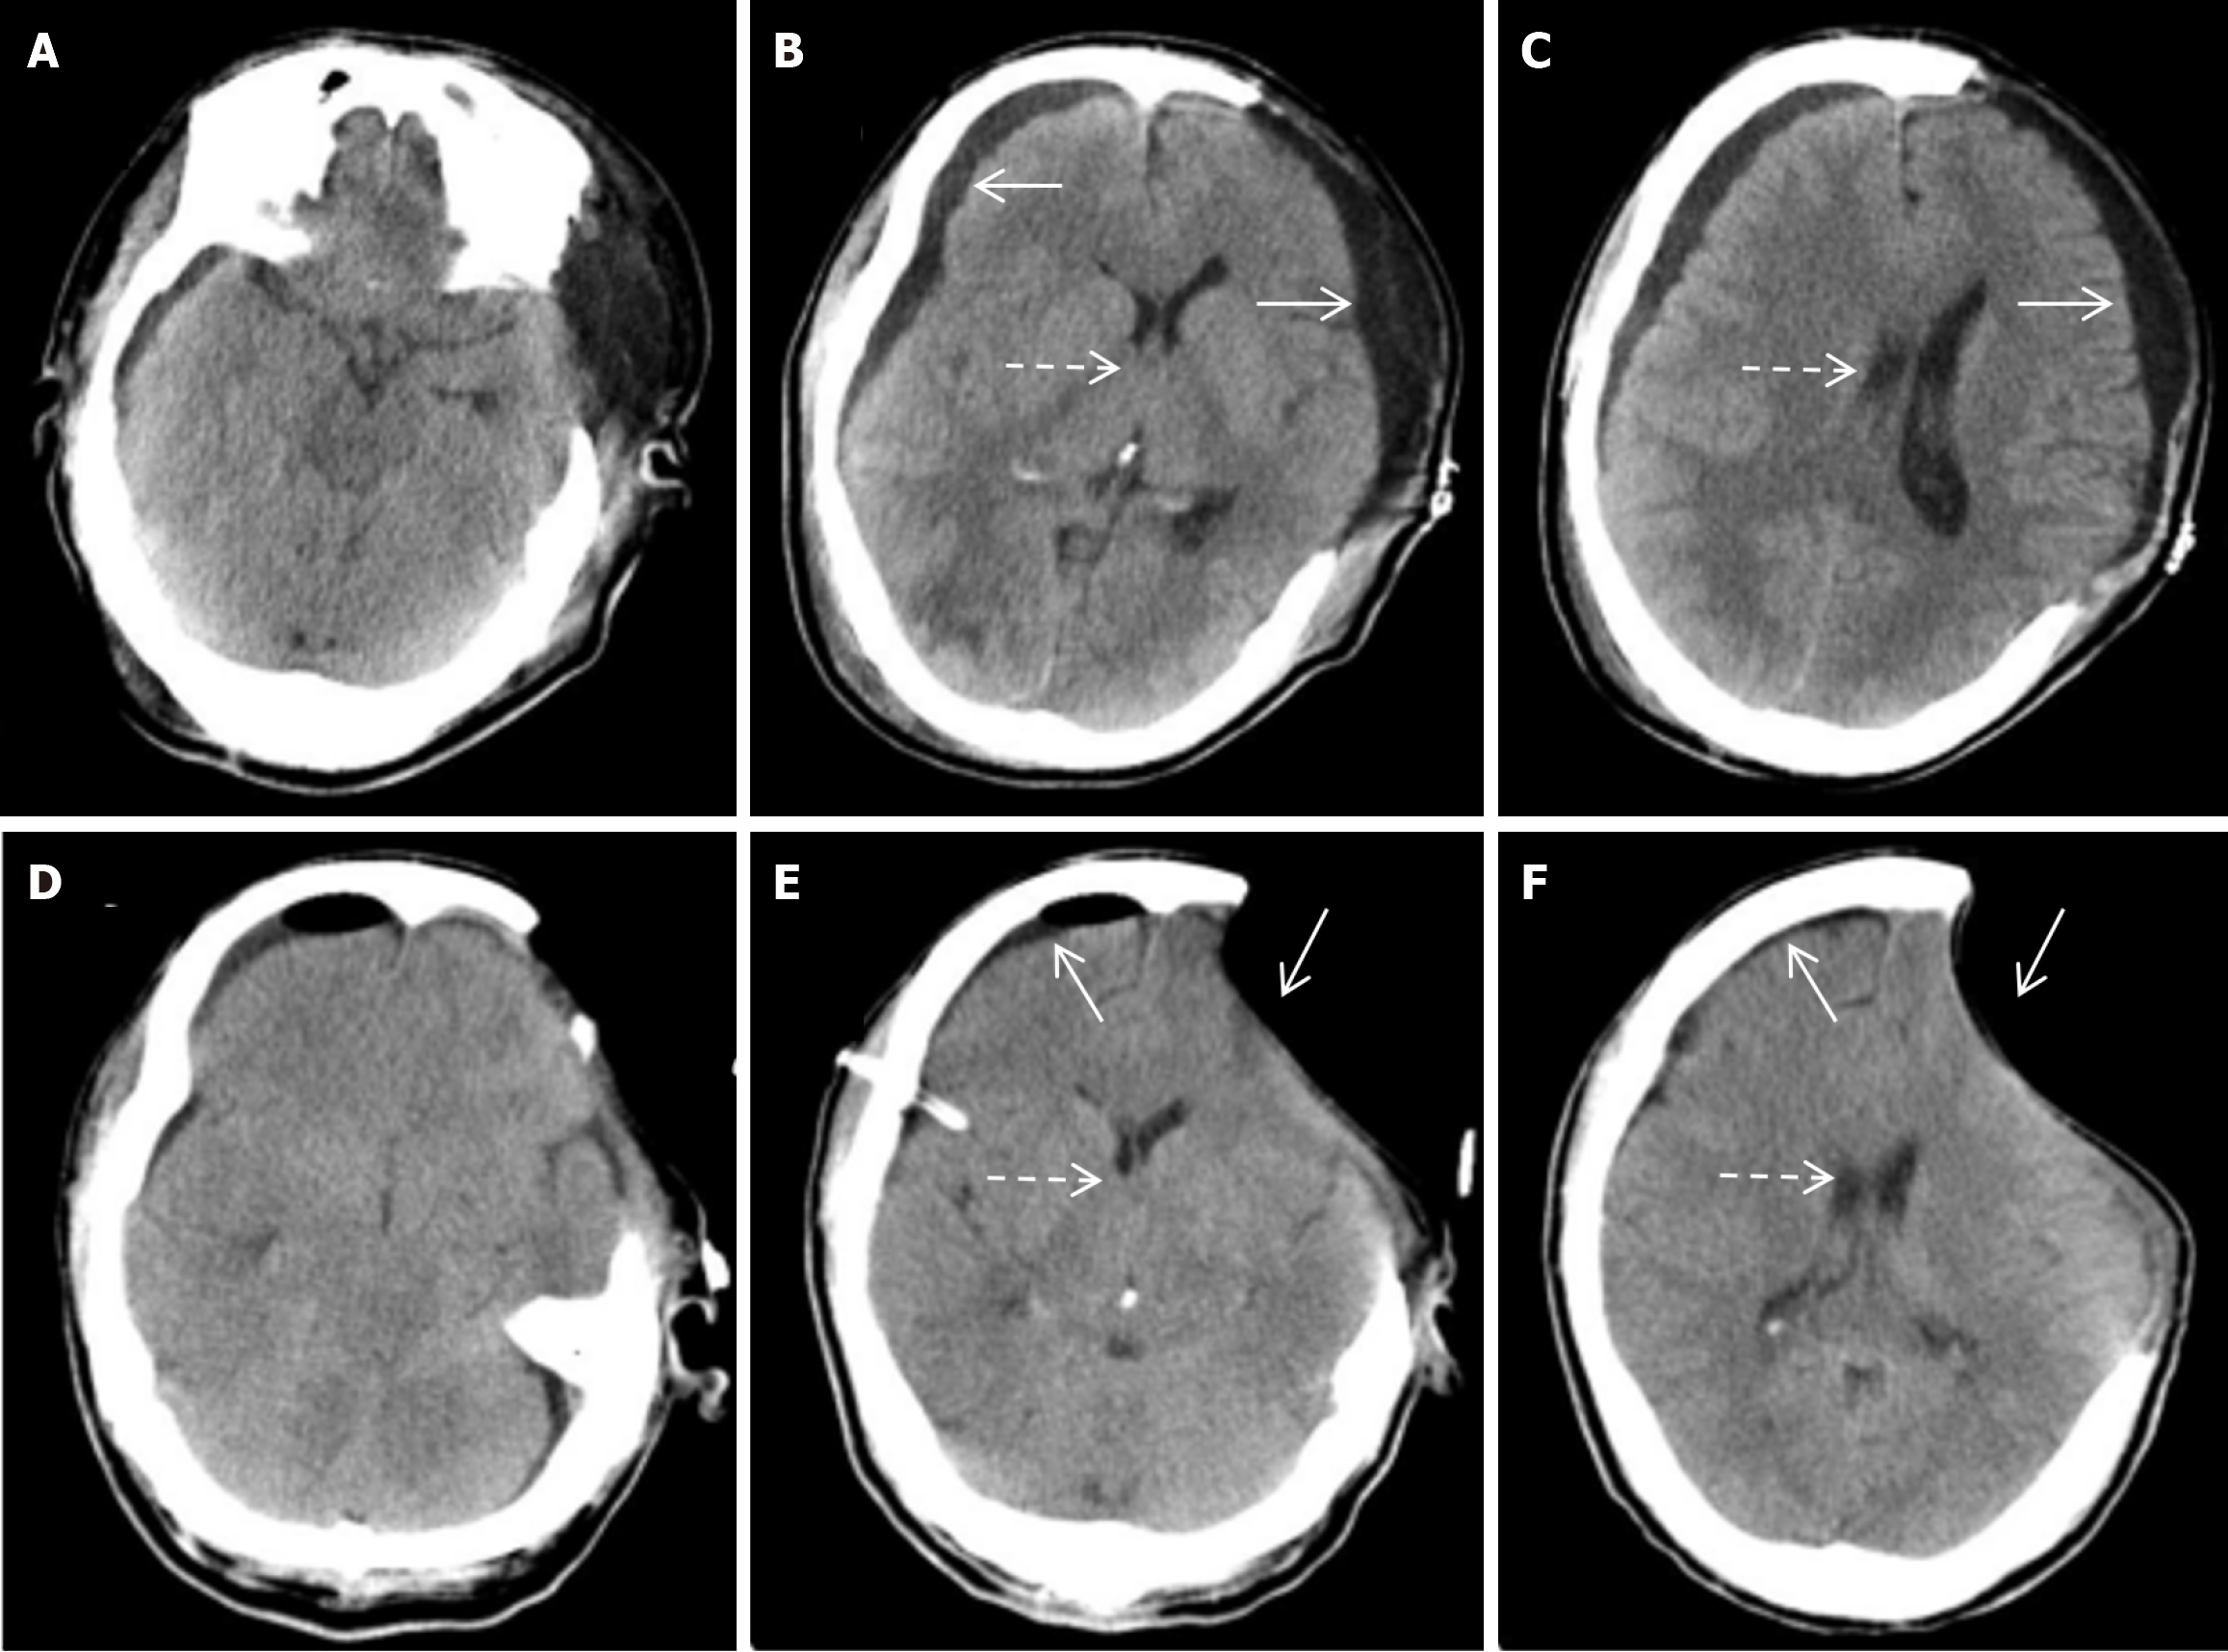
Figure 3 Computed tomography scan tenth day after decompressive craniectomy.
A-C: On the tenth day after decompressive craniectomy, a computed tomography scan was performed again, and an increase in bilateral subdural fluid accumulation was observed compared to before (white solid arrows); On the right side, there is a clear deviation of the midline to the left, and the right lateral ventricle is compressed (white dashed arrows); D-F: After the first subdural puncture drainage surgery, re-examination showed that the bilateral subdural fluid accumulation had basically disappeared (white solid arrows), and the midline was centered with improved compression of the right lateral ventricle (white dashed arrows).
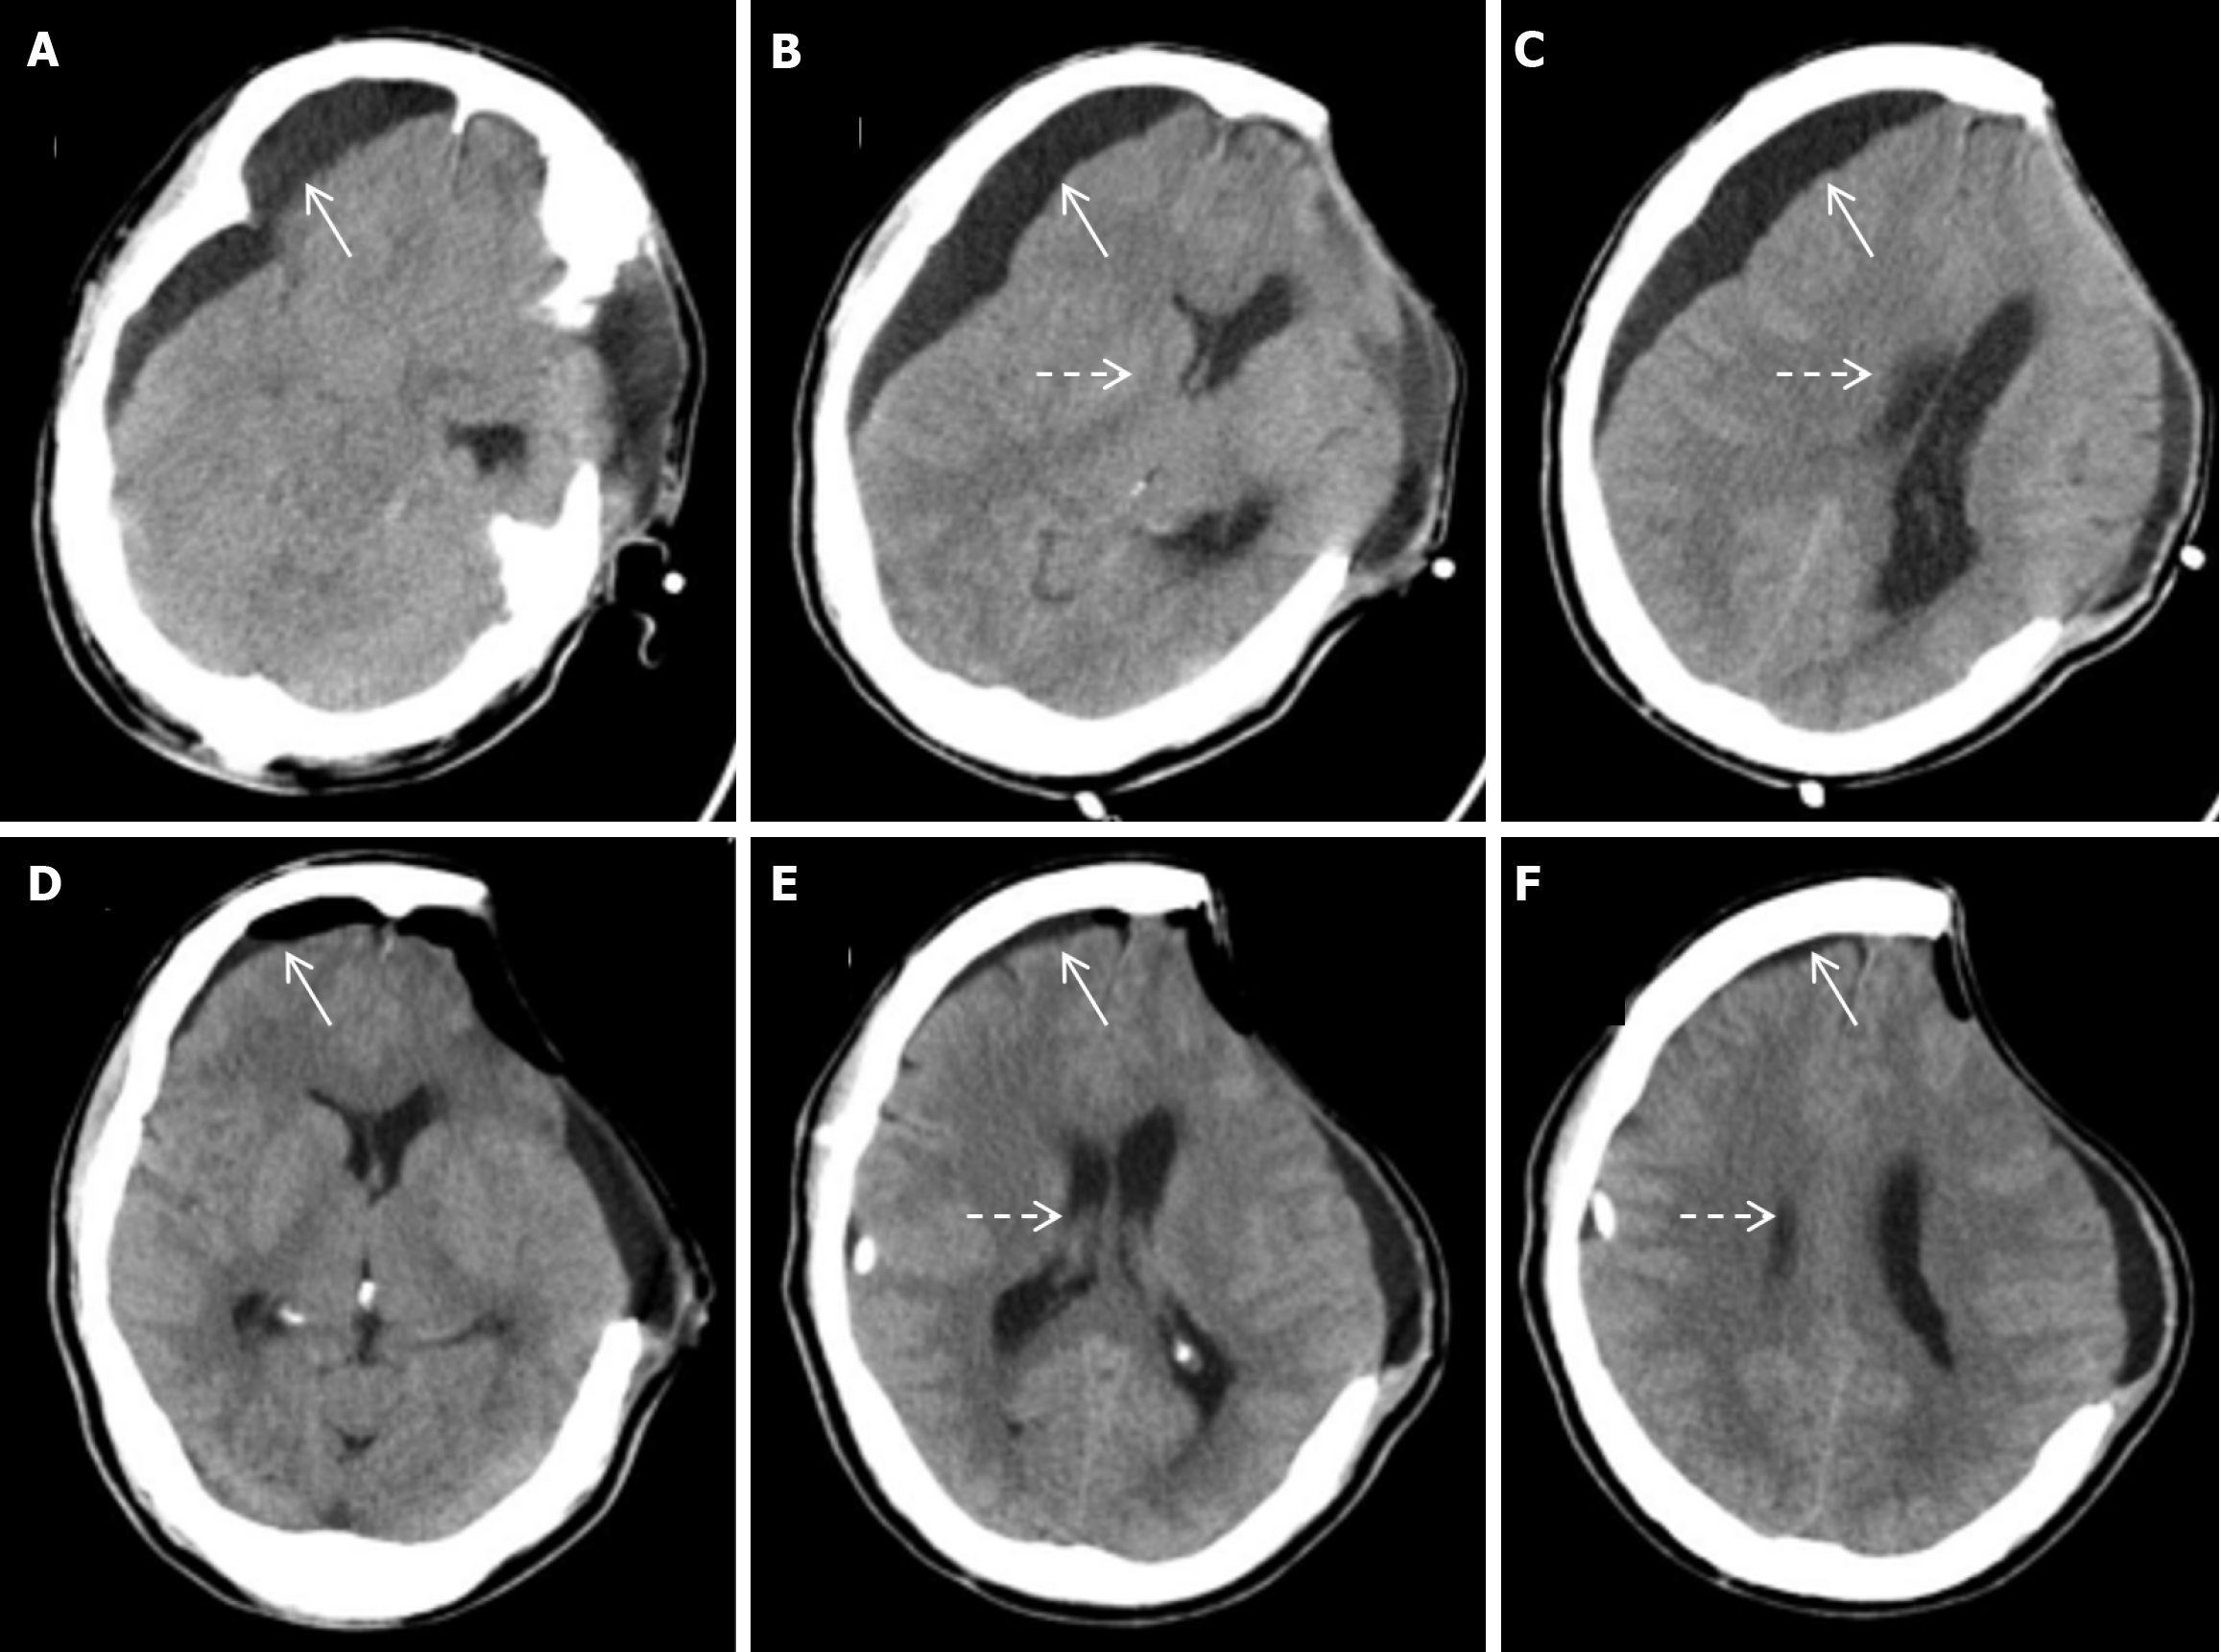
Figure 4 Computed tomography scan twentieth day after decompressive craniectomy.
A-C: On the twentieth day after decompressive craniectomy, a computed tomography scan was performed again, showing a recurrence of subdural fluid accumulation on the right side (solid white arrow), with the midline shifting to the left again and significant compression on the right ventricle (dashed white arrow); D-F: After the second subdural puncture drainage surgery, a 7-day follow-up examination showed that the right-sided subdural effusion had basically disappeared (white solid arrows), the midline was basically centered, and the compression of the right lateral ventricle had improved (white dashed arrows).
Figure 5 Computed tomography scan on day 32 after cranial decompression osteotomy.
A-C: On the 32nd day after decompressive craniectomy, a computed tomography scan was performed again, and it was observed that there was a significant increase in subdural fluid accumulation on the right side compared to before (solid white arrow). The midline shifted again to the left and the right ventricle was significantly compressed (dashed white arrow); D-F: After the third subdural puncture drainage surgery, a 7-day follow-up examination showed that the right-sided subdural effusion had basically disappeared (white solid arrows), the midline was basically centered, and the compression of the right lateral ventricle improved (white dashed arrows represent 3D skull defect protective caps).
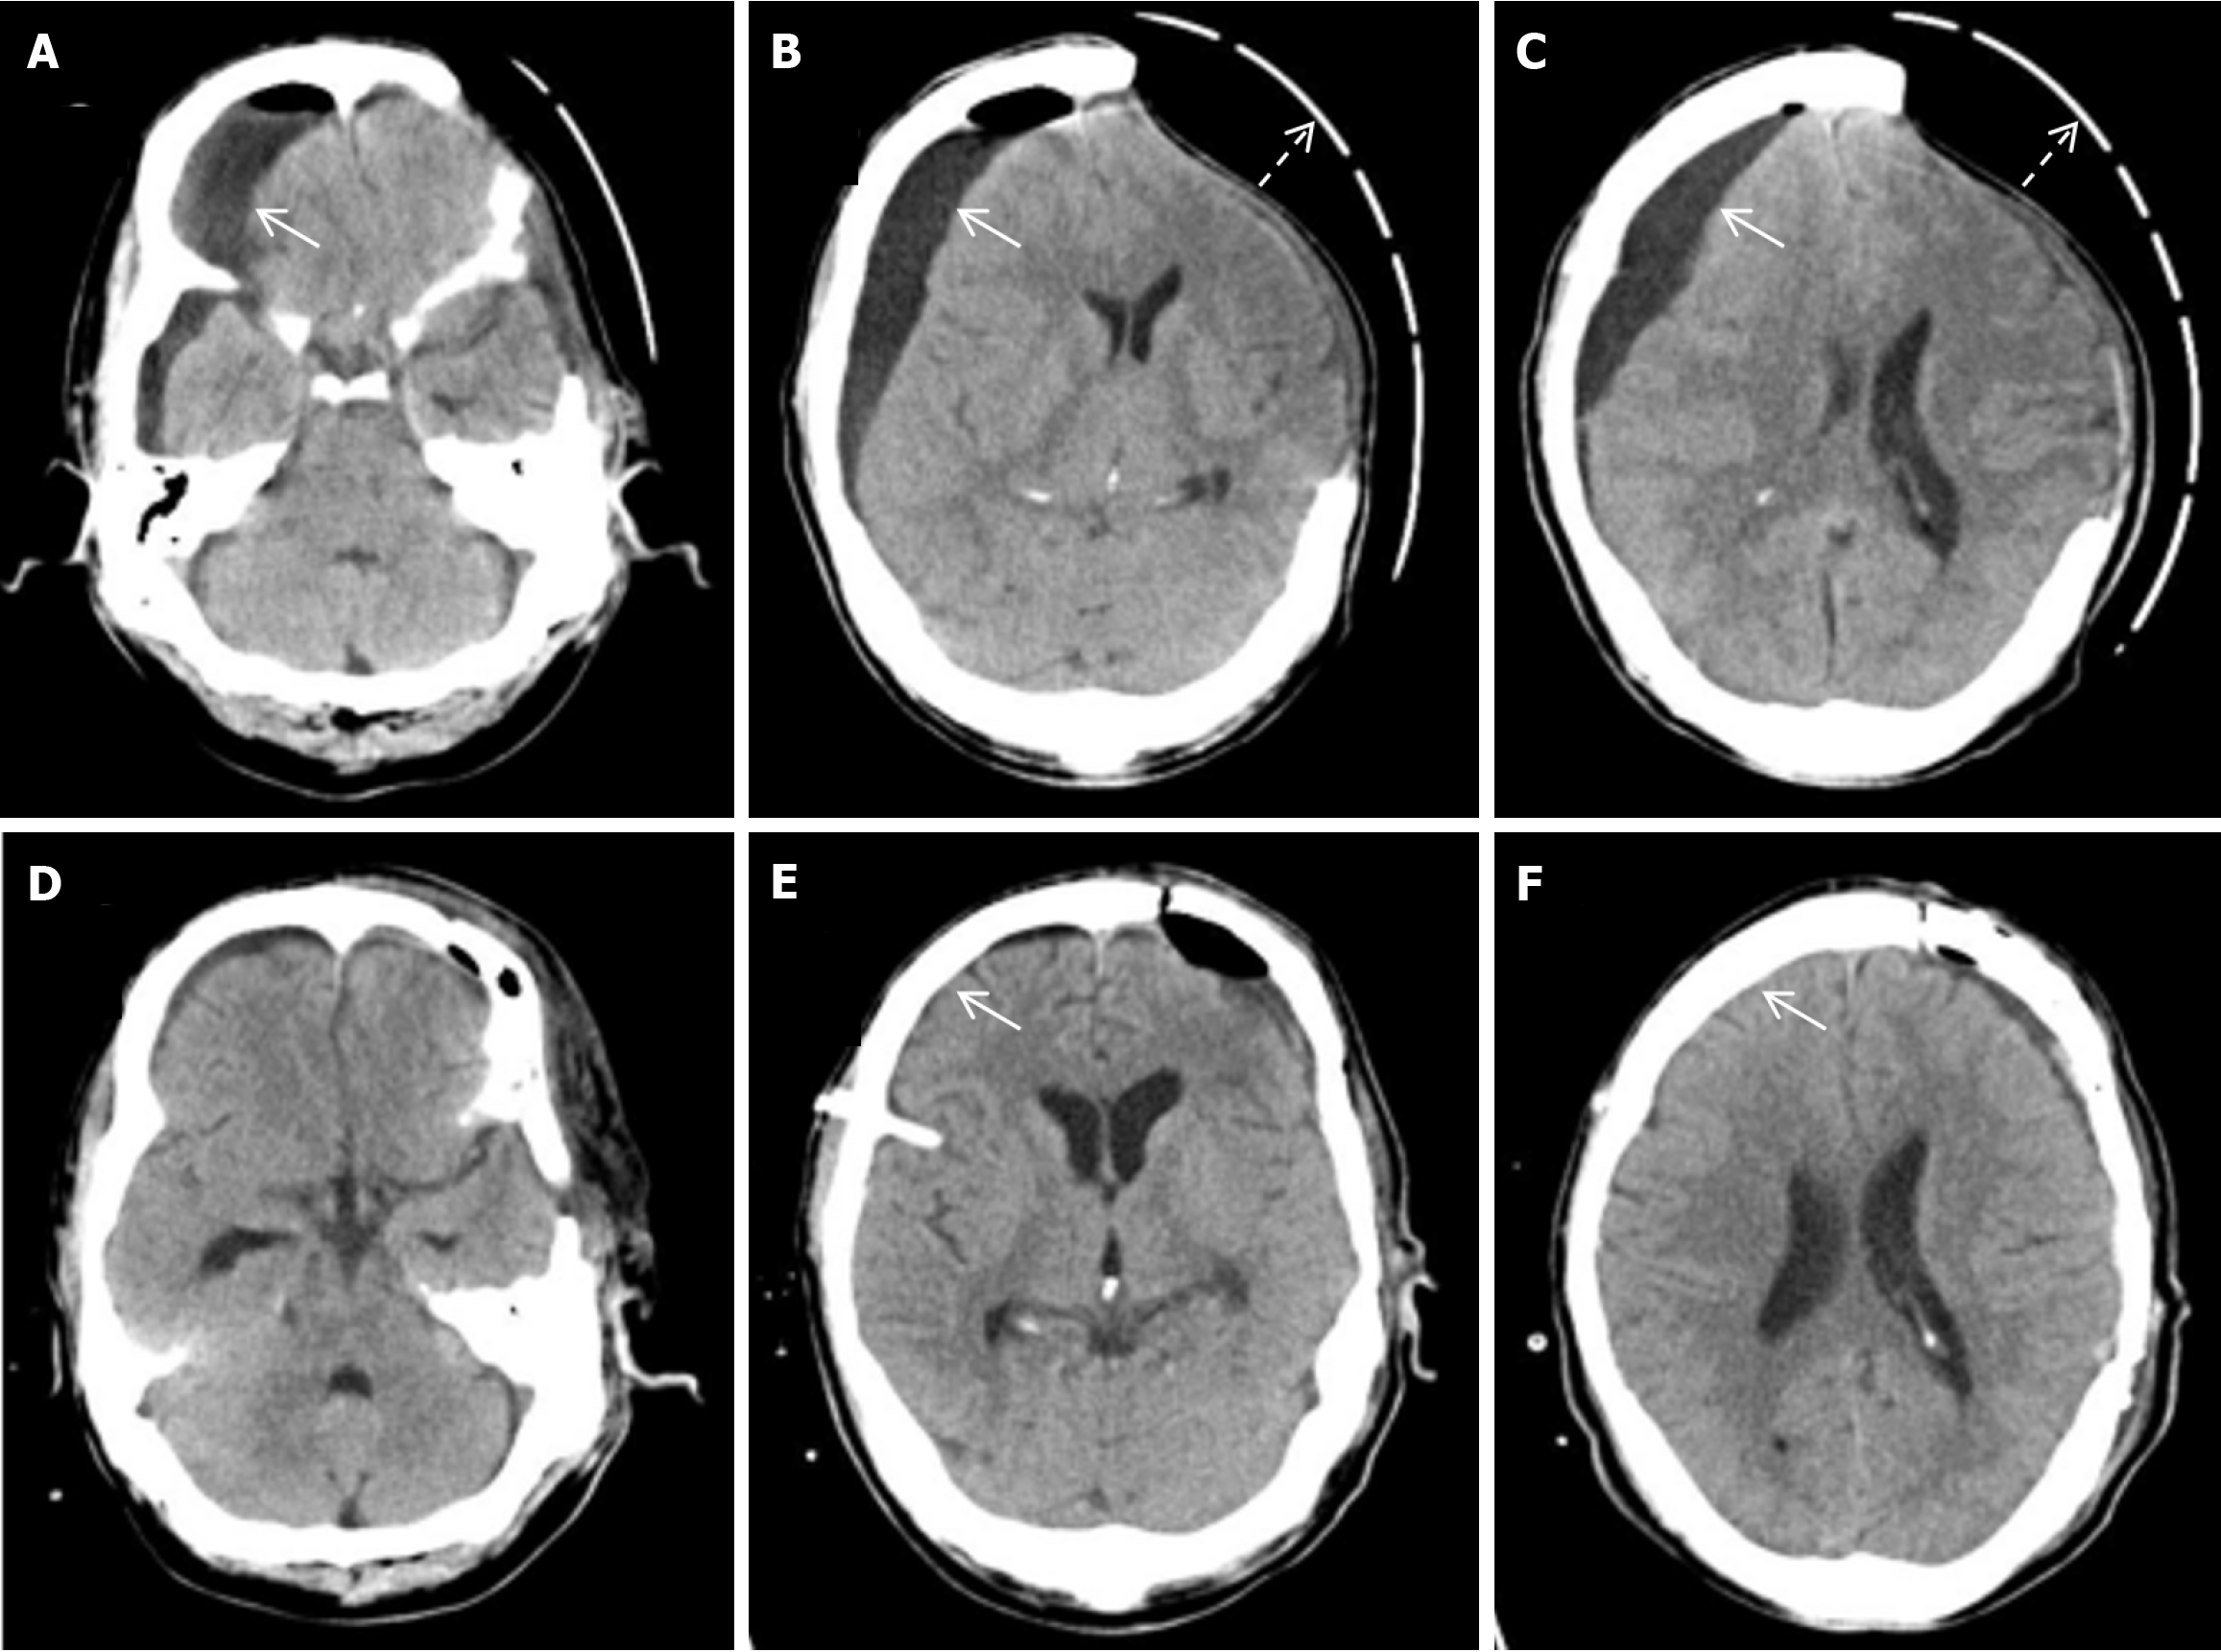
Figure 6 Computed tomography scan on day 53 after cranial decompression osteotomy.
A-C: On the 53rd day after decompressive craniectomy, a computed tomography scan was performed again, and a recurrence of subdural fluid on the right side was observed (white solid arrow), with the midline shifted to the left (white dashed arrow represents the 3D skull defect protective cap); D-F: After skull repair surgery and puncture of the right subdural fluid, the right subdural fluid has basically disappeared (white solid arrows), the midline is centered, and there is no obvious compression on the brain tissue.
- Citation: Lin MJ. Intractable subdural effusion after decompressive craniectomy for traumatic brain injury: A case report. World J Clin Cases 2025; 13(17): 103350
- URL: https://www.wjgnet.com/2307-8960/full/v13/i17/103350.htm
- DOI: https://dx.doi.org/10.12998/wjcc.v13.i17.103350


