Copyright
©The Author(s) 2025.
World J Clin Cases. Jun 6, 2025; 13(16): 102853
Published online Jun 6, 2025. doi: 10.12998/wjcc.v13.i16.102853
Published online Jun 6, 2025. doi: 10.12998/wjcc.v13.i16.102853
Figure 1 PRISMA flow diagram.
uRDN: Ultrasound renal denervation.
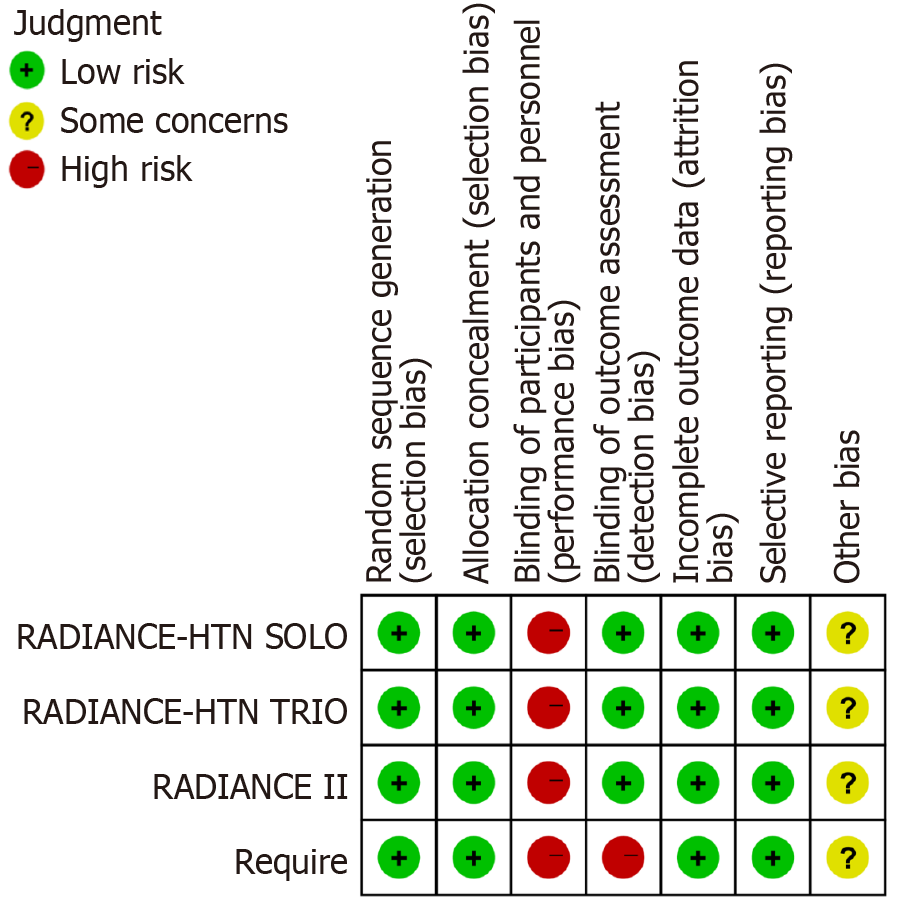
Figure 2
Bias risk assessment of the included studies.
Figure 3 Forest plot for mean changes of blood pressure in ultrasound renal denervation and sham group.
A: Comparison of daytime ambulatory systolic blood pressure (SBP) between the two groups; B: Comparison of office SBP between the two groups; C: Comparison of home SBP between the two groups; D: Comparison of 24-hour ambulatory SBP and nighttime SBP between the two groups. BP: Blood pressure; uRDN: Ultrasound renal denervation; CI: Confidence interval; SBP: Systolic blood pressure.
- Citation: Ou YC, Peng XY, Yang JX, Chen BY, Chen PF, Liu M. Efficacy of catheter-based ultrasound renal denervation in the treatment of hypertension. World J Clin Cases 2025; 13(16): 102853
- URL: https://www.wjgnet.com/2307-8960/full/v13/i16/102853.htm
- DOI: https://dx.doi.org/10.12998/wjcc.v13.i16.102853


