Copyright
©The Author(s) 2024.
World J Clin Cases. Mar 26, 2024; 12(9): 1660-1668
Published online Mar 26, 2024. doi: 10.12998/wjcc.v12.i9.1660
Published online Mar 26, 2024. doi: 10.12998/wjcc.v12.i9.1660
Figure 1 T helper 1/T helper 2 cytokine levels at admission and 5 d later.
A: Interleukin 2 (IL-2) is shown for this patient, 7 Salmonella enterica serovar typhimurium (S. typhimurium)-infected controls, and 3 Epstein-Barr virus-hemophagocytic lymphohistiocytosis (EBV-HLH) controls; B: IL-4 is shown for the patient and controls; C: IL-6 is shown for the patient and controls; D: IL-10 is shown for the patient and controls; E: Tumor necrosis factor-alpha (TNF-α) is shown for the patient and controls; F: Interferon-gamma (IFN-γ) is shown for the patient and controls.
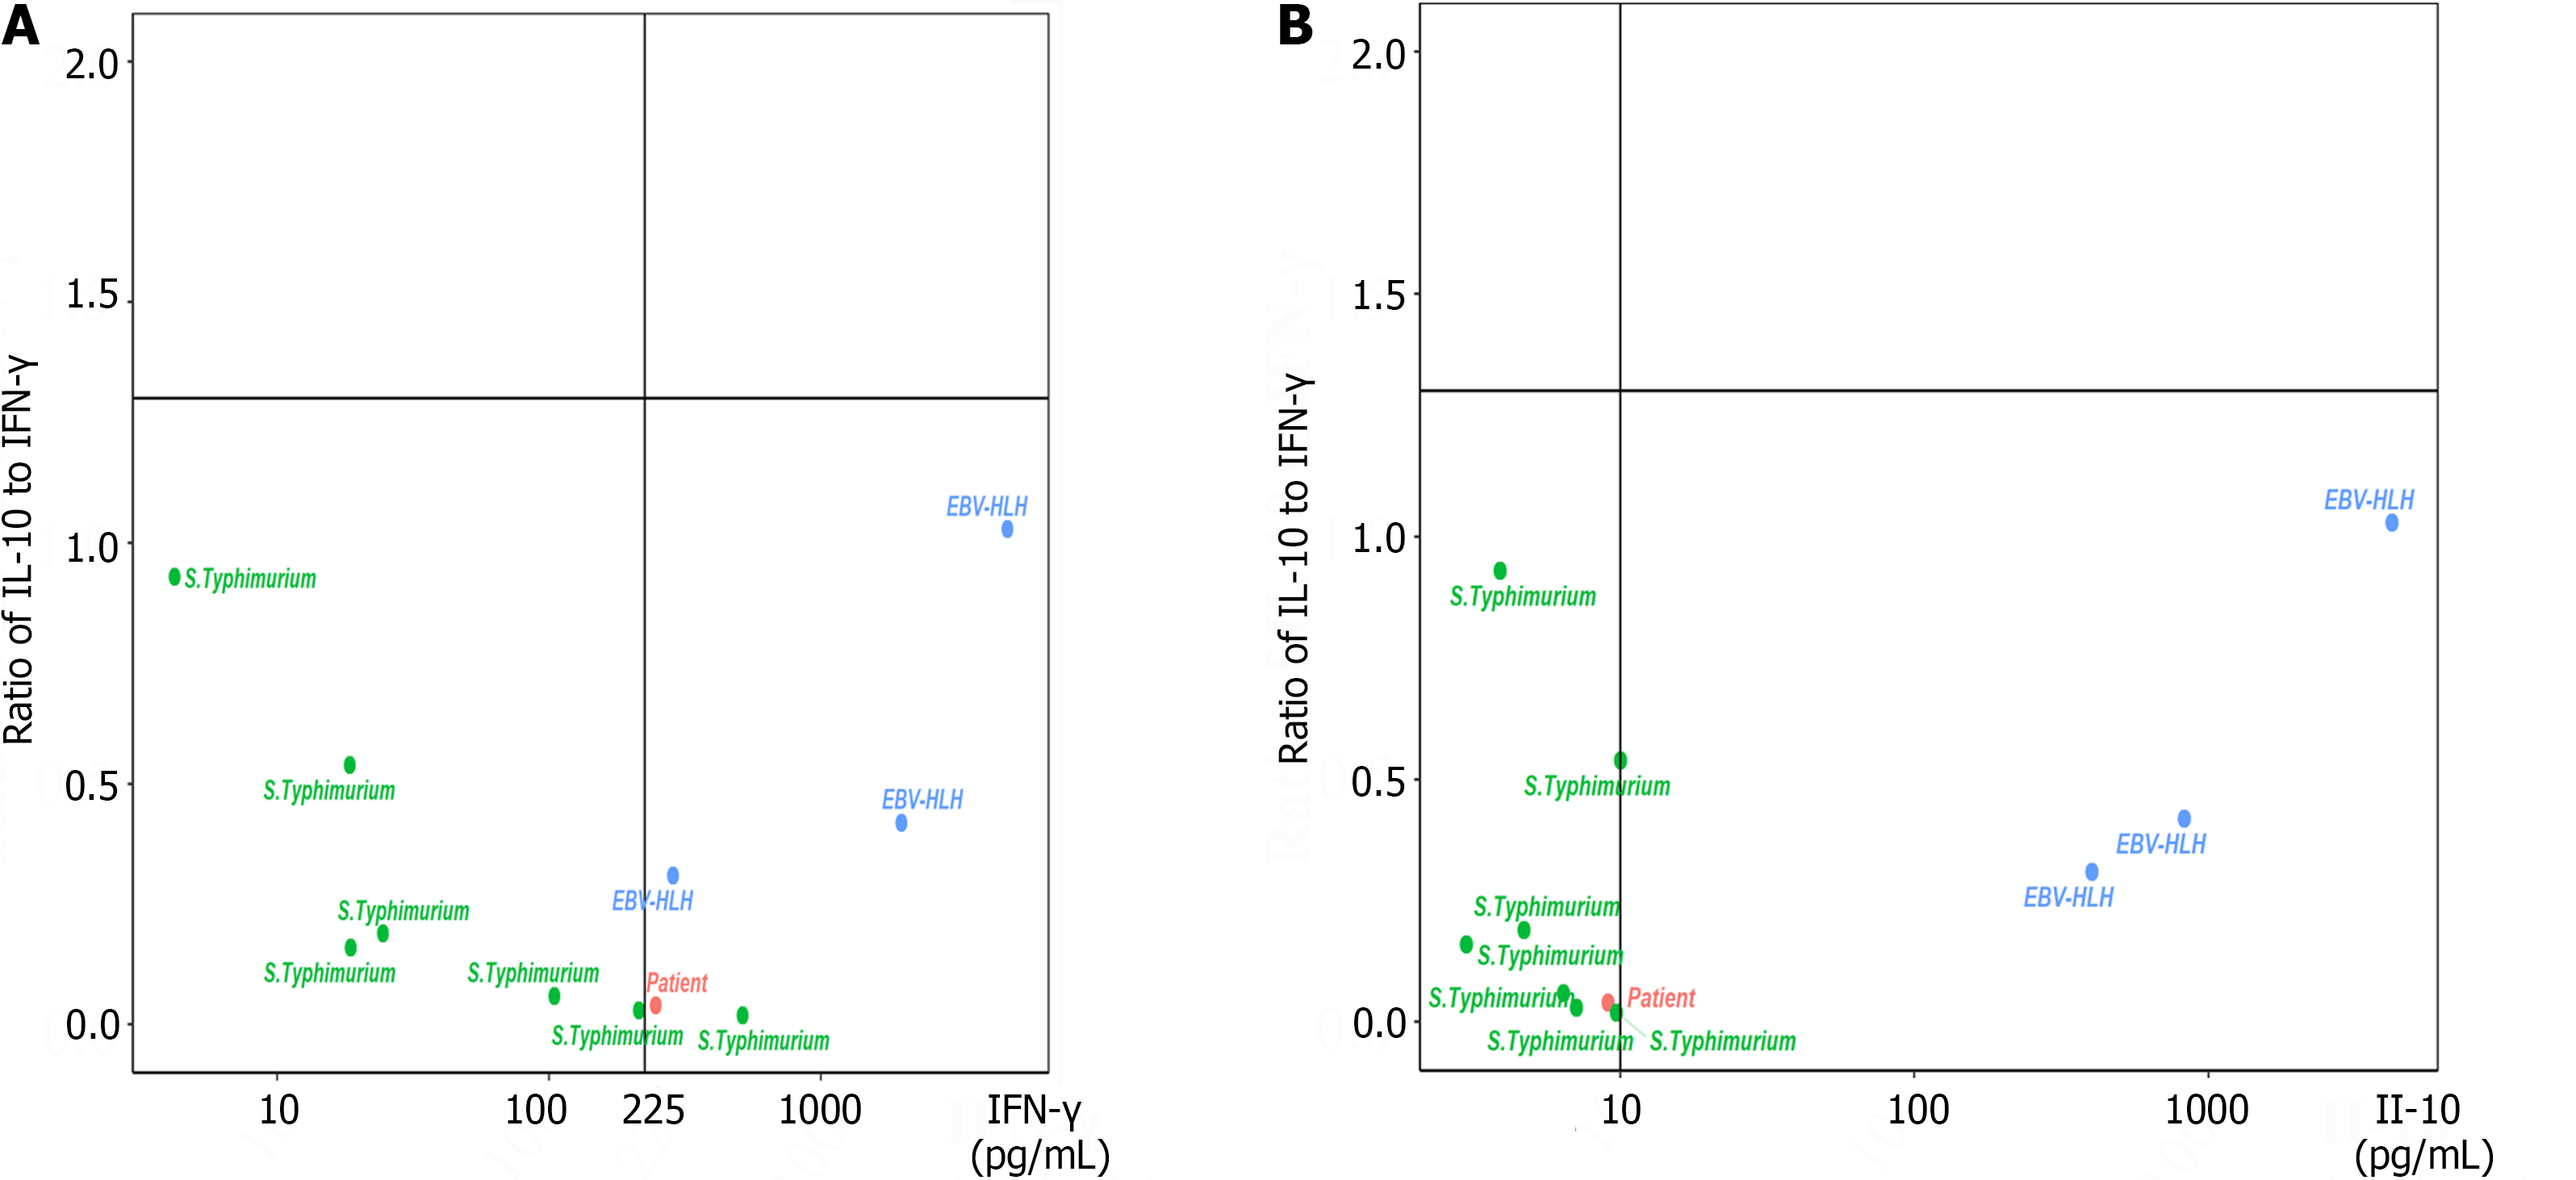
Figure 2 Four-quadrant models for differentiating secondary hemophagocytic lymphohistiocytosis patients with different features.
A: Distribution of the patients, 7 controls infected with Salmonella enteric serovar typhimurium (S. typhimurium), and 3 Epstein-Barr virus-hemophagocytic lymphohistiocytosis (EBV-HLH) patients according to a four-quadrant diagram based on the ratio of interleukin-10 (IL-10) to interferon gamma (IFN-γ) > 1.33 or ≤ 1.33 and IFN-γ level > 225 pg/mL or ≤ 225 pg/mL; B: Distribution of the patients, 7 controls infected with S. typhimurium, and 3 EBV-HLH patients according to a four-quadrant diagram based on the ratio of IL-10 to IFN-γ > 1.33 or ≤ 1.33 and IL-10 level > 10 pg/mL or ≤ 10 pg/mL.
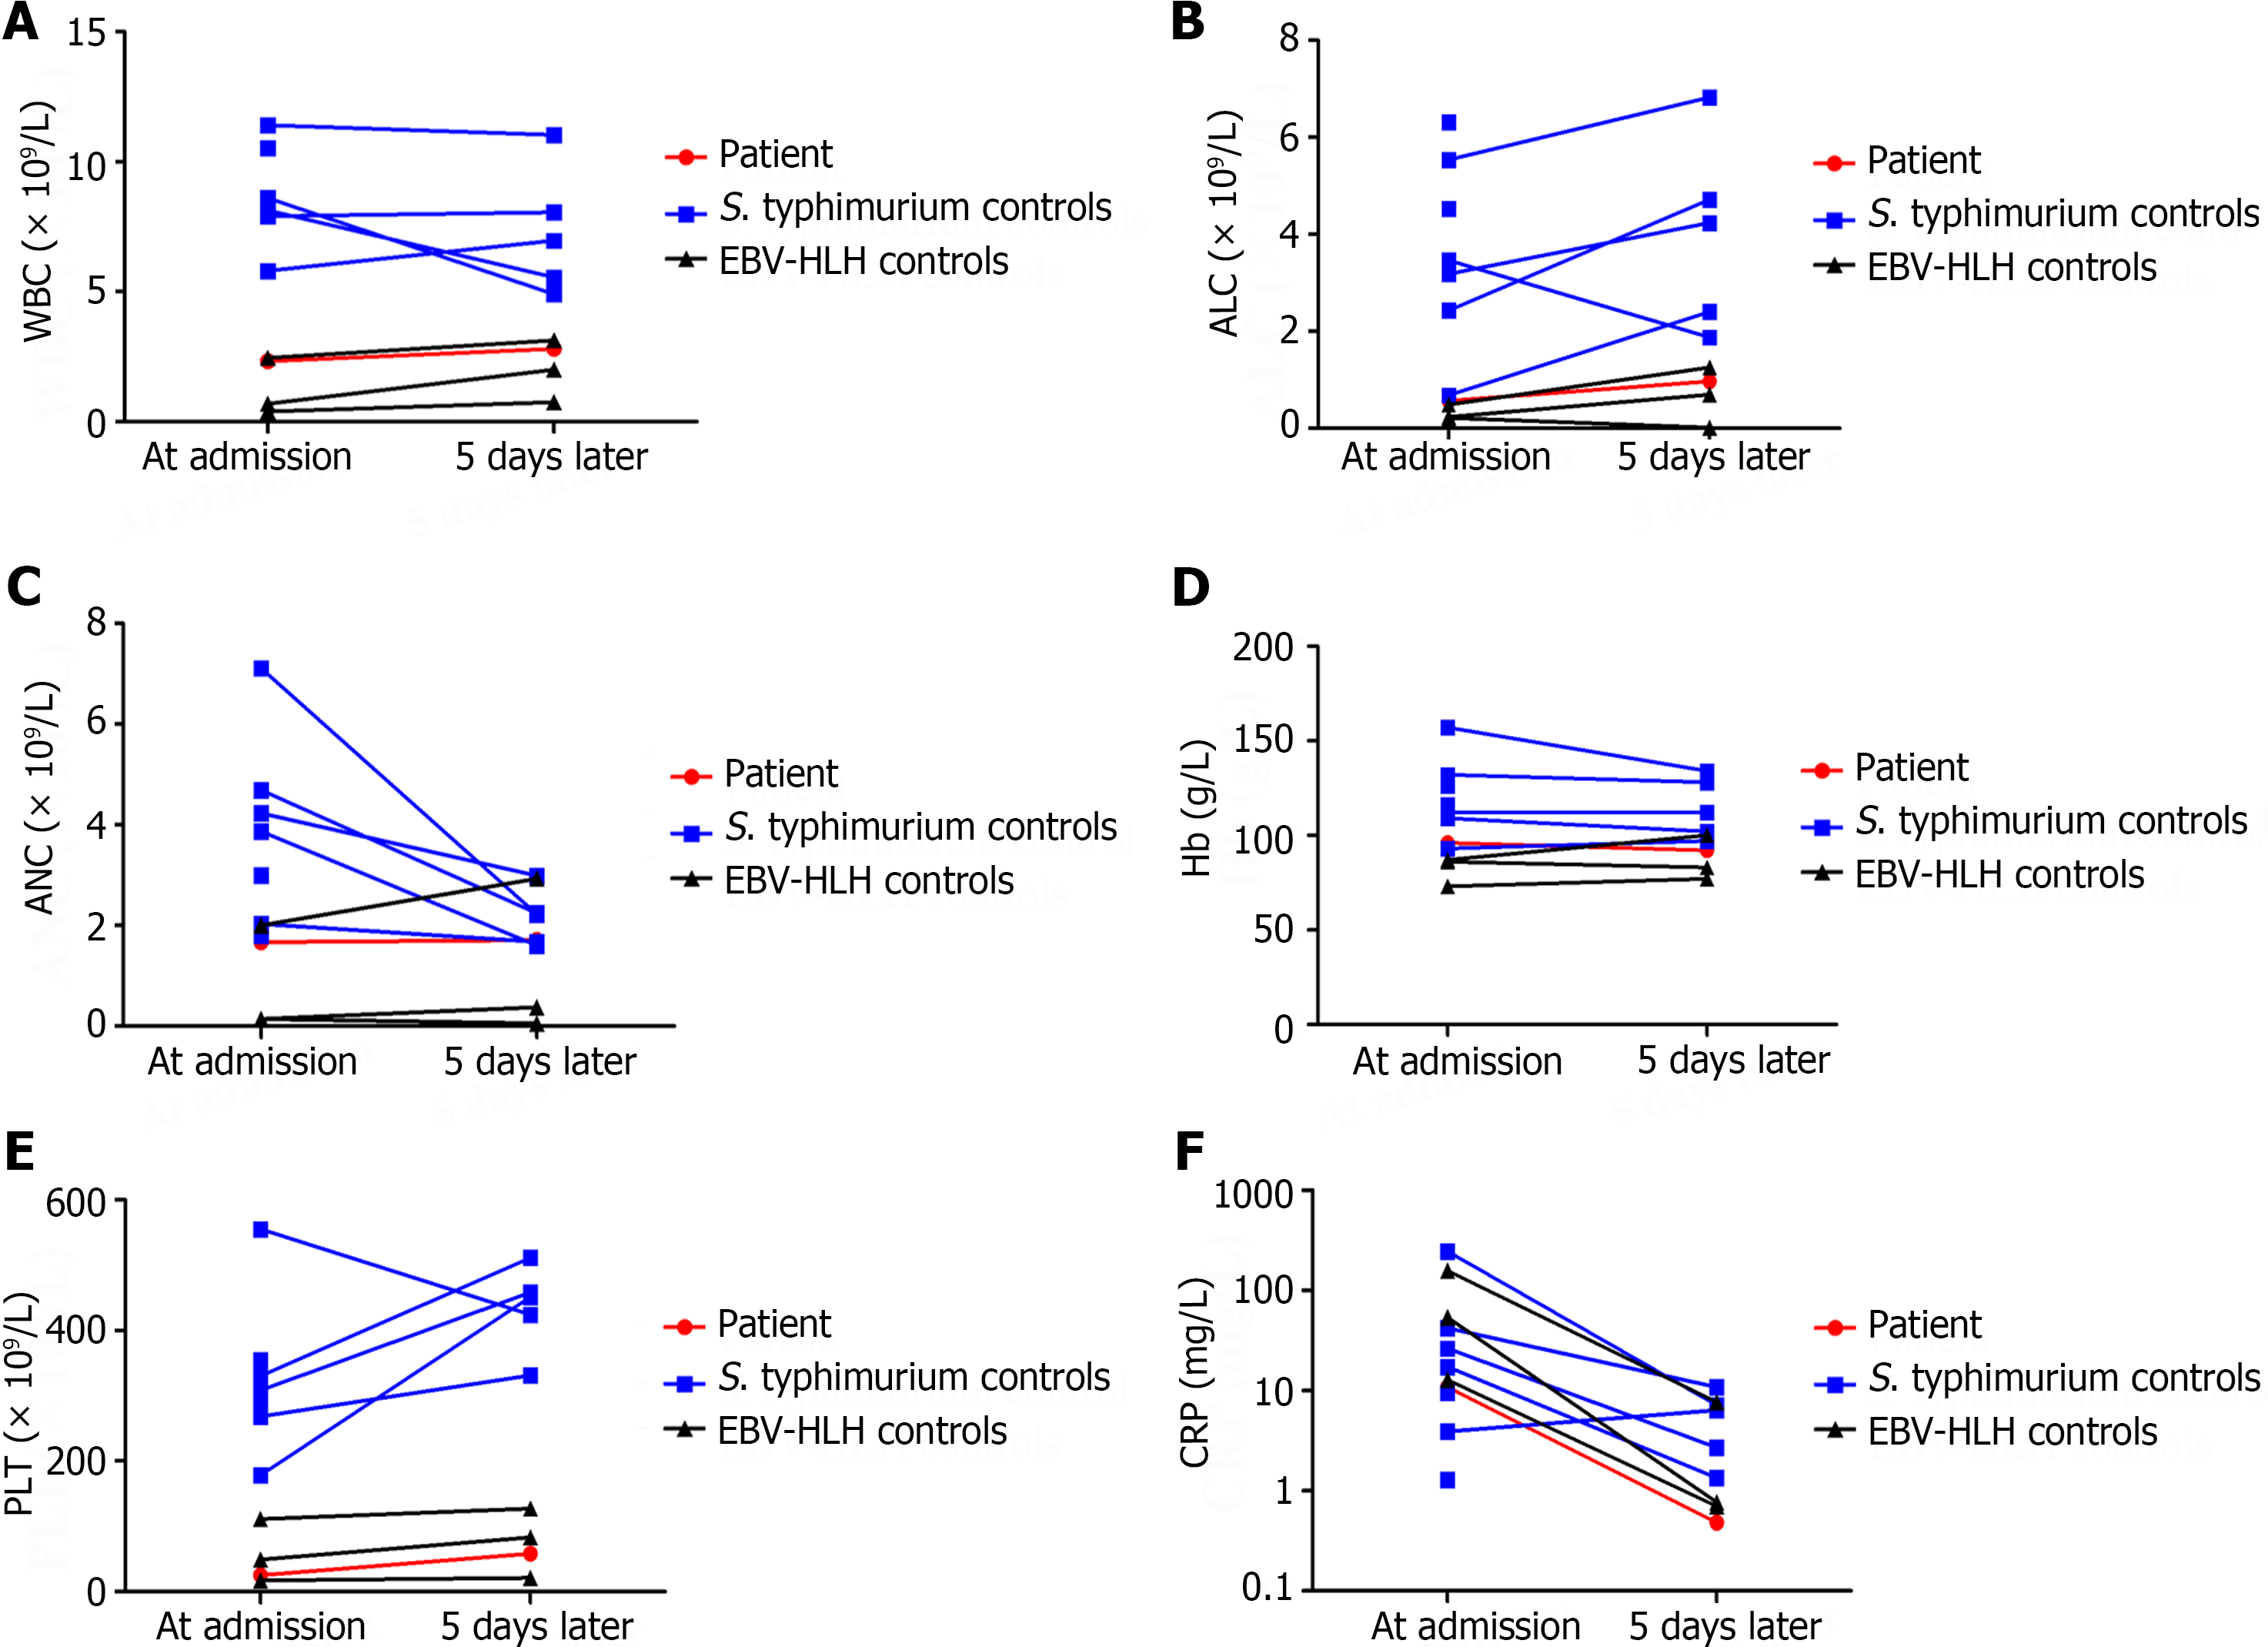
Figure 3 Complete blood count at admission and 5 d later.
A: White blood cell (WBC) count of the patient, 7 Salmonella enteric serovar typhimurium (S. typhimurium)-infected controls, and 3 Epstein-Barr virus-hemophagocytic lymphohistiocytosis (EBV-HLH) controls; B: Absolute lymphocyte count (ALC) of the patient and controls; C: Absolute neutrophil count (ANC) of the patient and controls; D: Hemoglobin (Hb) of the patient and controls; E: Platelet (PLT) count of the patient and controls; F: C-reactive protein (CRP) of the patient and controls.
- Citation: Chen YY, Xu XZ, Xu XJ. Low interleukin-10 level indicates a good prognosis in Salmonella enterica serovar typhimurium-induced pediatric hemophagocytic lymphohistiocytosis: A case report. World J Clin Cases 2024; 12(9): 1660-1668
- URL: https://www.wjgnet.com/2307-8960/full/v12/i9/1660.htm
- DOI: https://dx.doi.org/10.12998/wjcc.v12.i9.1660


