Copyright
©The Author(s) 2024.
World J Clin Cases. Mar 16, 2024; 12(8): 1395-1405
Published online Mar 16, 2024. doi: 10.12998/wjcc.v12.i8.1395
Published online Mar 16, 2024. doi: 10.12998/wjcc.v12.i8.1395
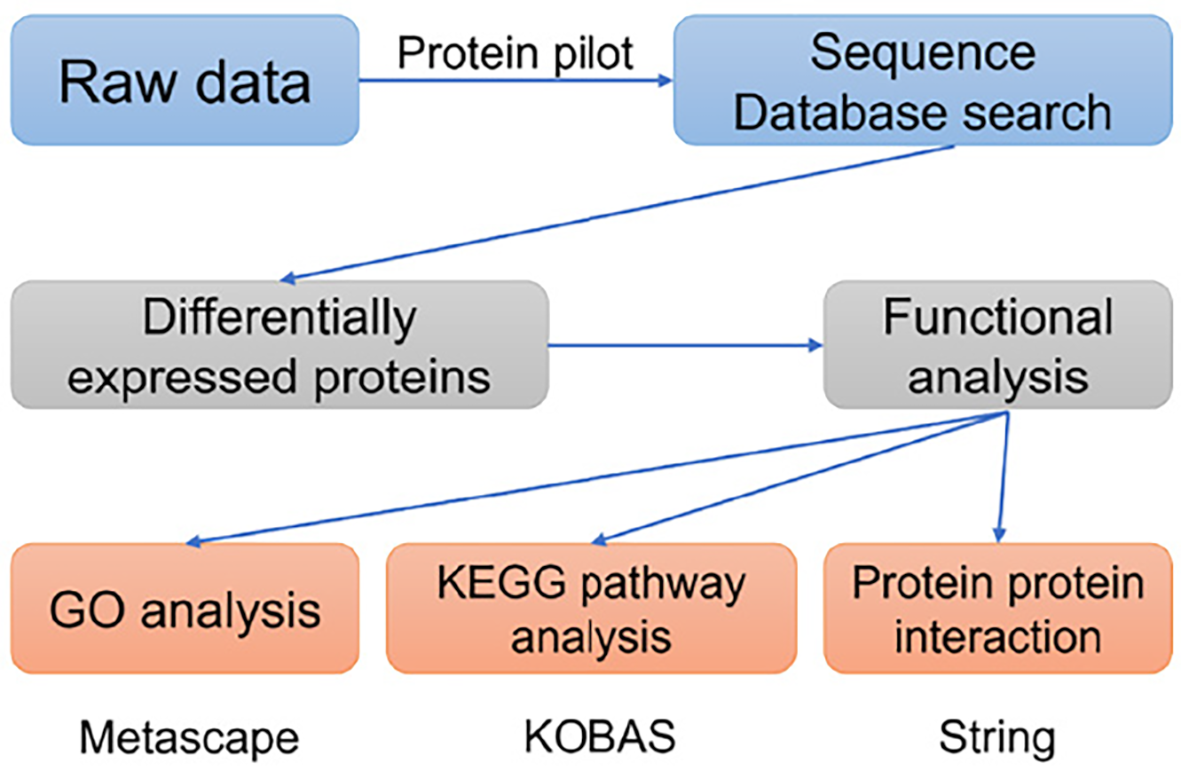
Figure 1 Flowchart of the data analysis procedure.
GO: Gene Ontology; KEGG: Kyoto Encyclopedia of Genes and Genomes.
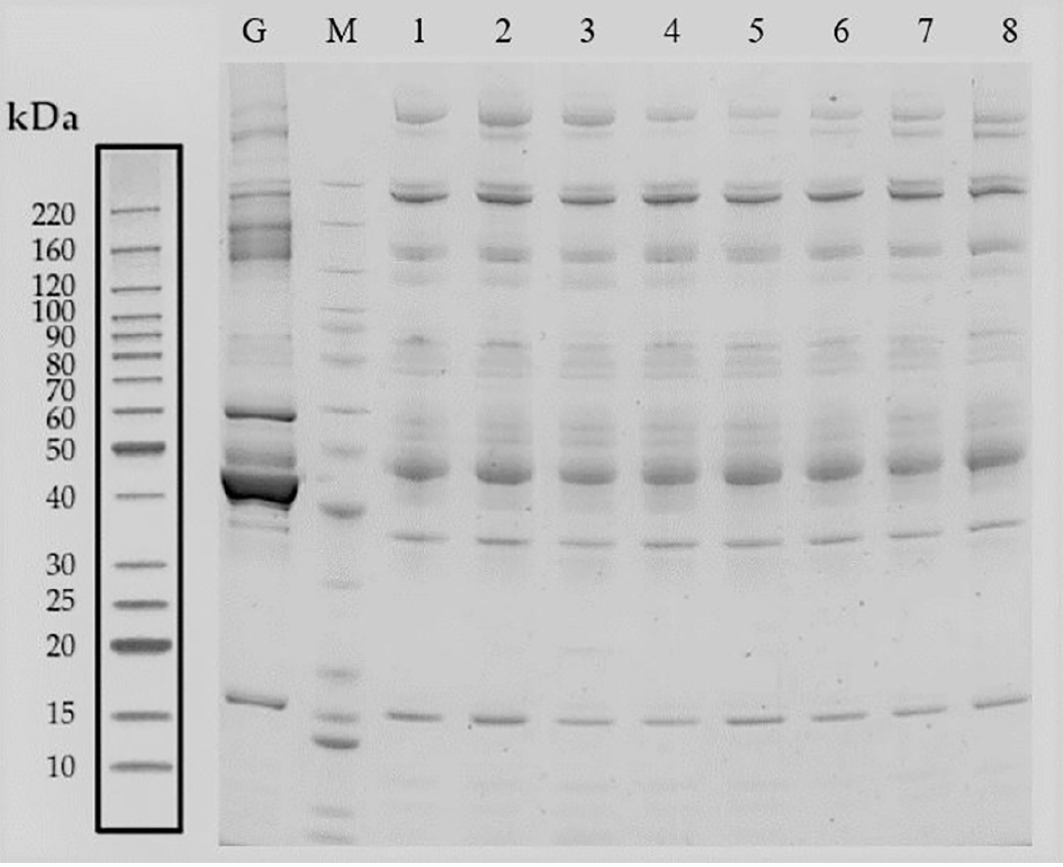
Figure 2 Remove of high-abundance protein.
Lane G is the original sample from the gestational diabetes mellitus (GDM) group. Lane M contains markers. Lanes 1-4 are from serum samples obtained from the GDM group after removing the highly abundant proteins, whereas lanes 5-8 are from the control group after removing the highly abundant proteins.
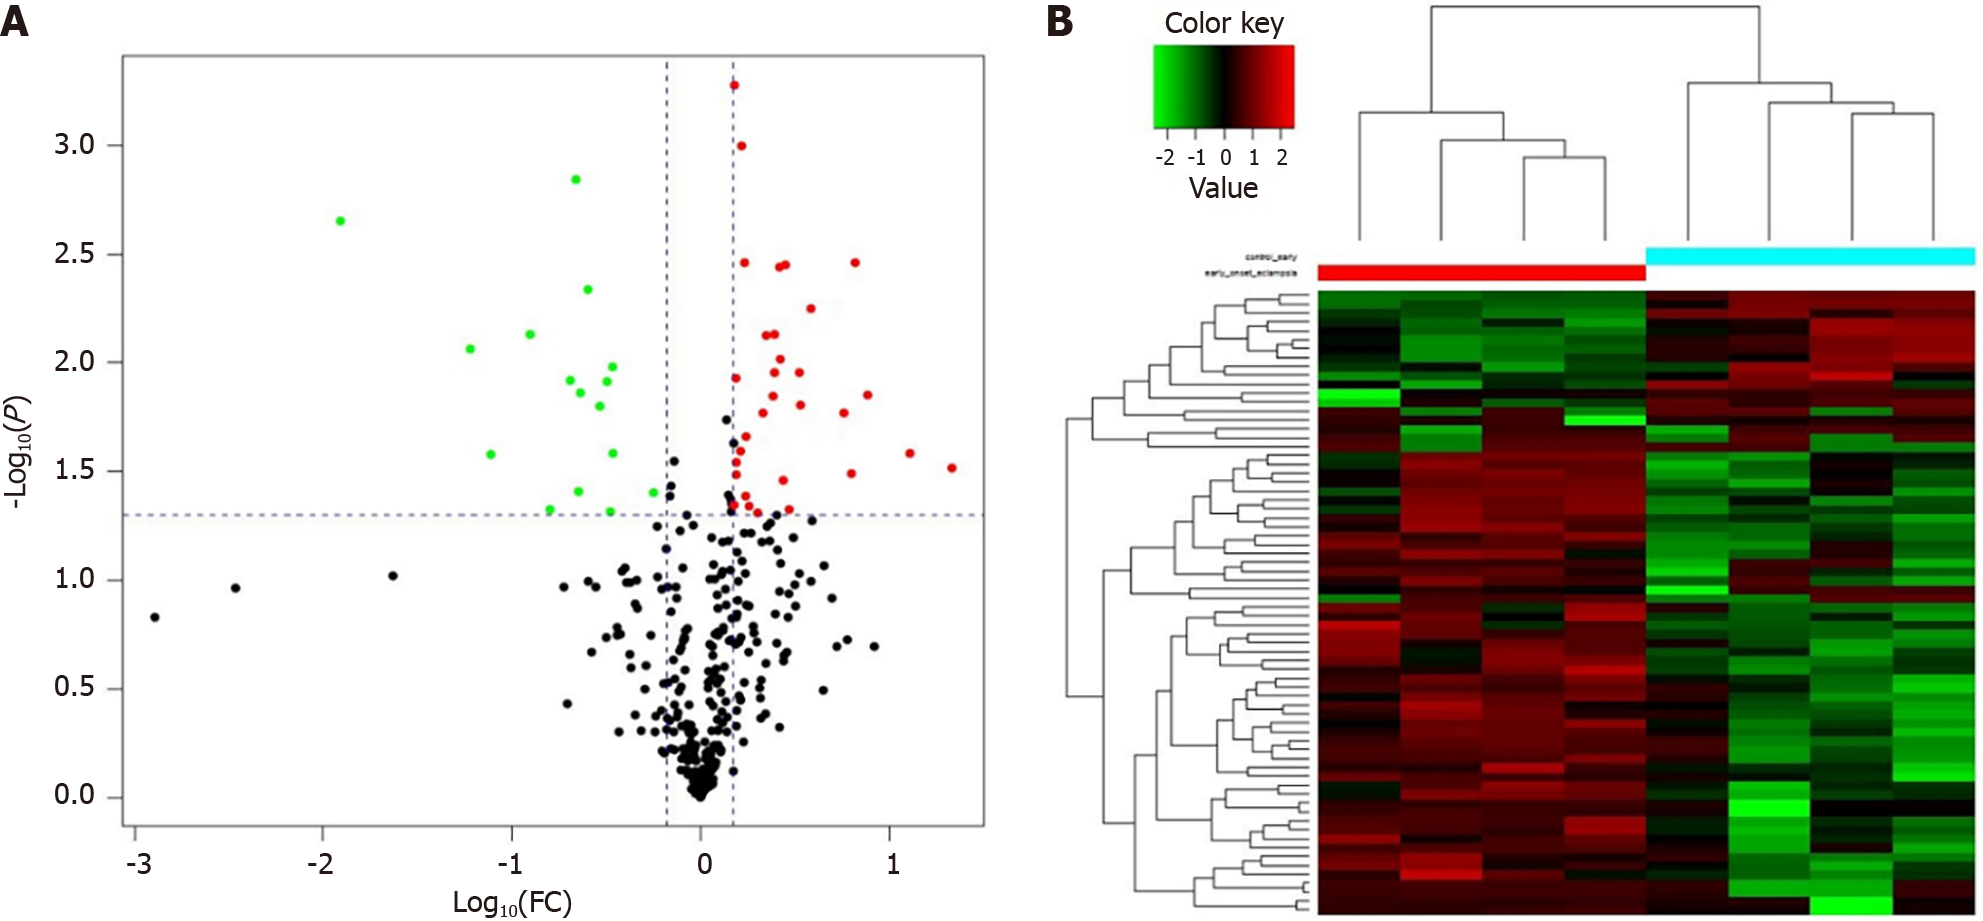
Figure 3 Differential protein expression.
A: Volcano plots with red dots on the right-hand side indicating upregulation, green dots on the left-hand side indicating downregulation, and black dots indicating no significant change in protein expression levels based on the criteria of an absolute log10 fold change (FC; i.e., > 1.2 difference) and P < 0.05 between gestational diabetes mellitus and its control group; B: Clustergram for the expression of the differentially expressed proteins between gestational diabetes mellitus and control.
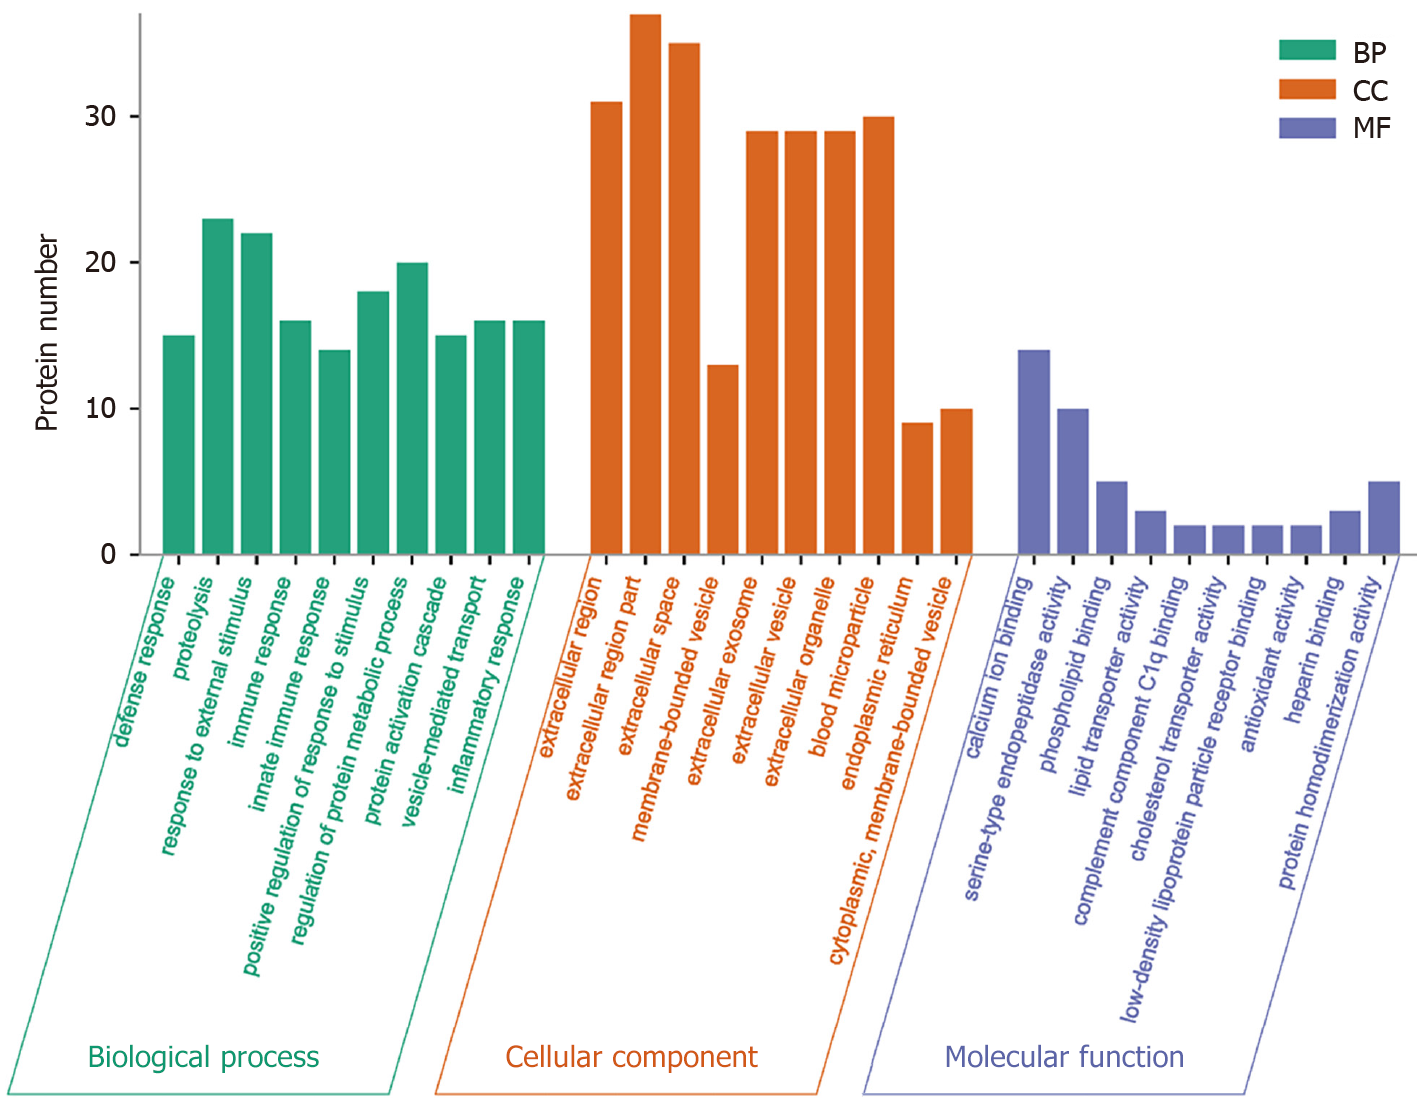
Figure 4 Gene ontology functional annotation.
The upregulated and downregulated proteins in the three categories of biological process, cellular component, and molecular function in the gestational diabetes mellitus group vs its control group. CC: Cell composition; MF: Molecular function; BP: Biological process.
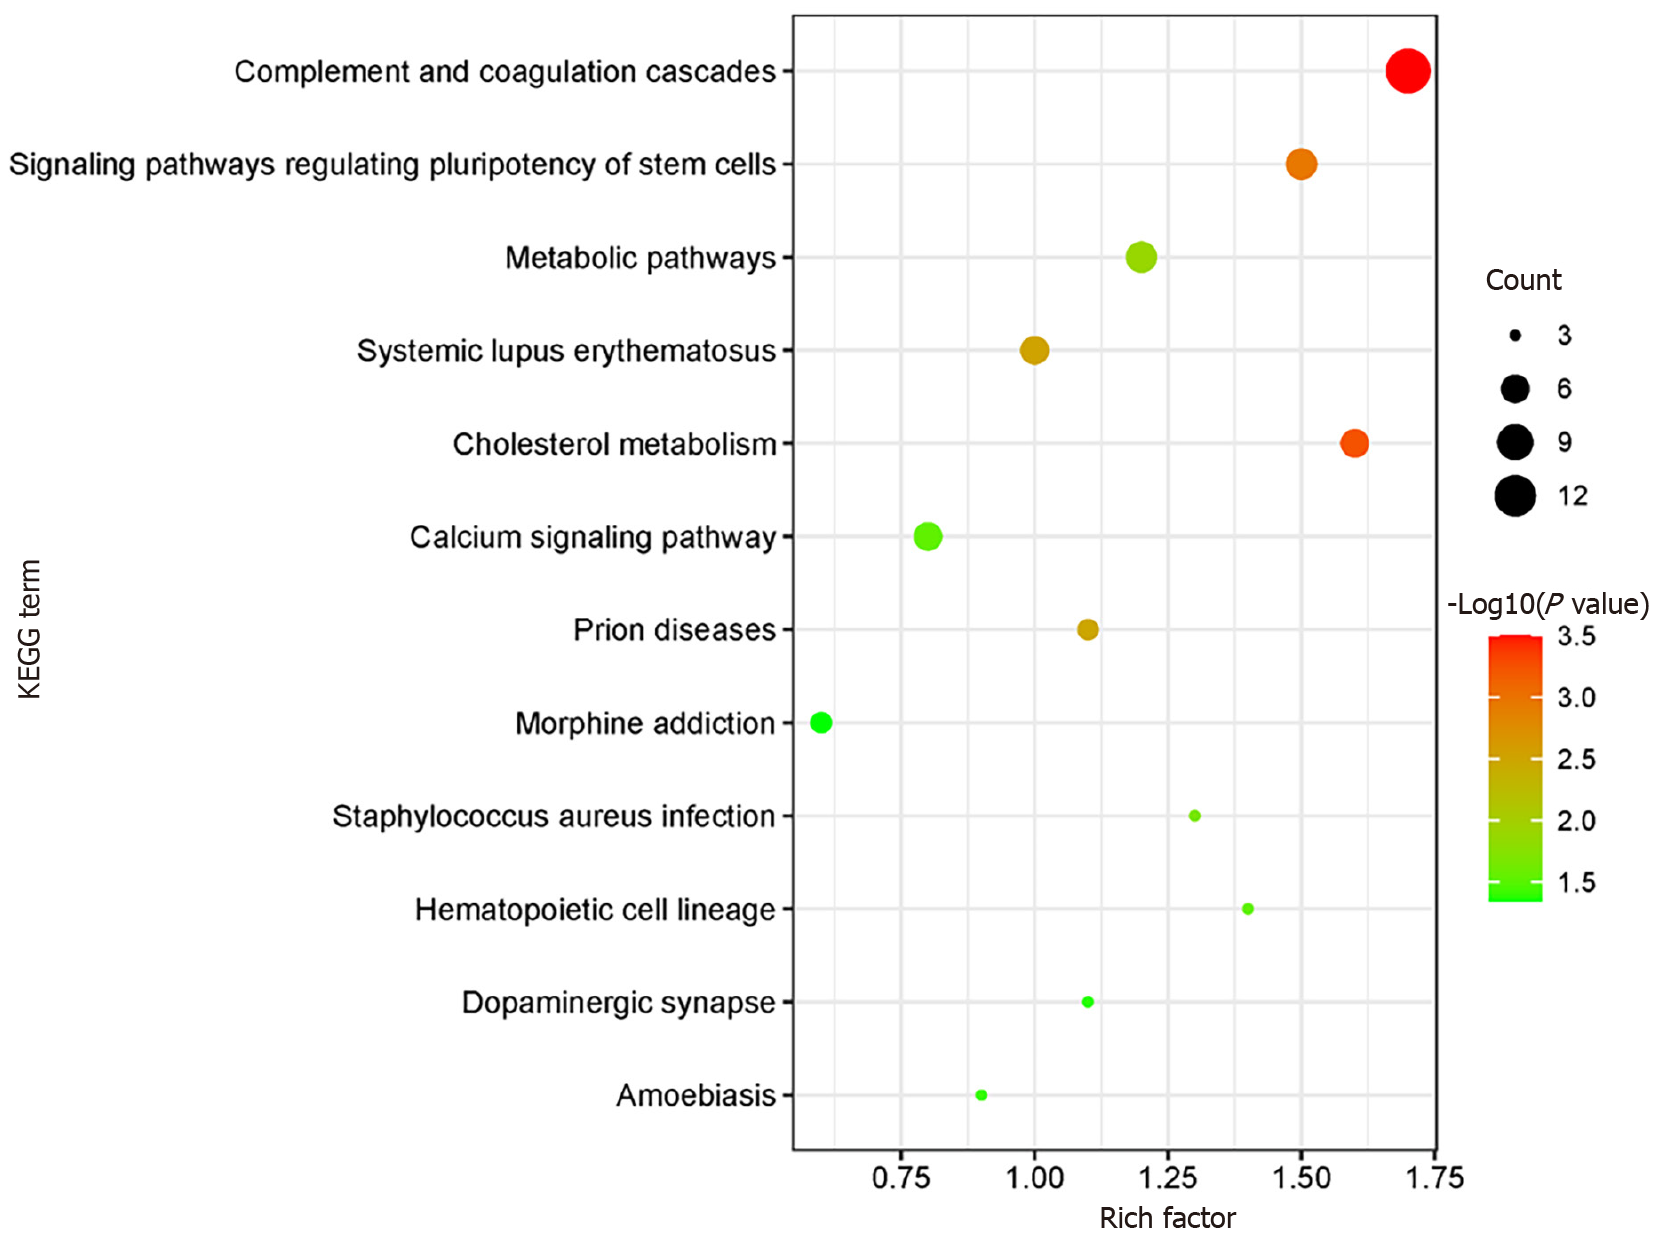
Figure 5 Kyoto Encyclopedia of Genes and Genomes pathway enrichment.
Kyoto Encyclopedia of Genes and Genomes pathways enriched for the upregulated and downregulated proteins and the associated protein numbers in gestational diabetes mellitus vs its control. KEGG: Kyoto Encyclopedia of Genes and Genomes.
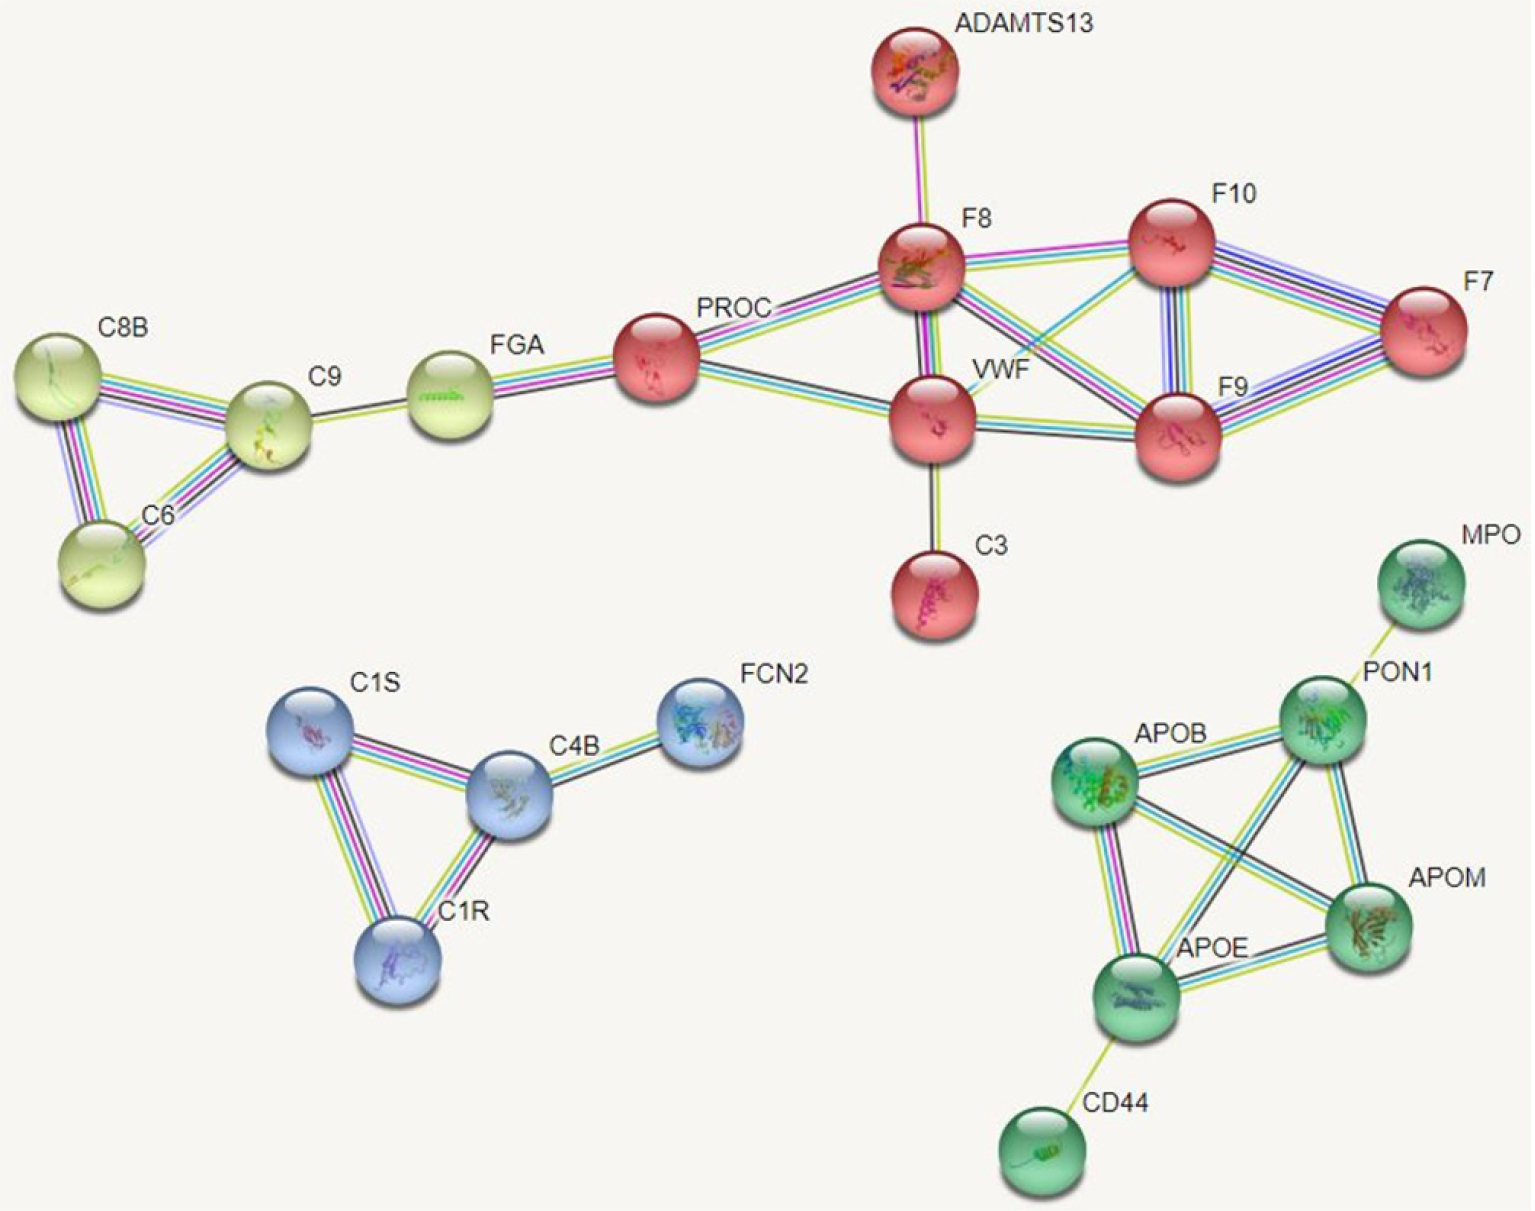
Figure 6 Protein interaction network.
Protein interaction network of differentially expressed proteins was constructed and the core proteins were clustered with different colors clustering was performed.
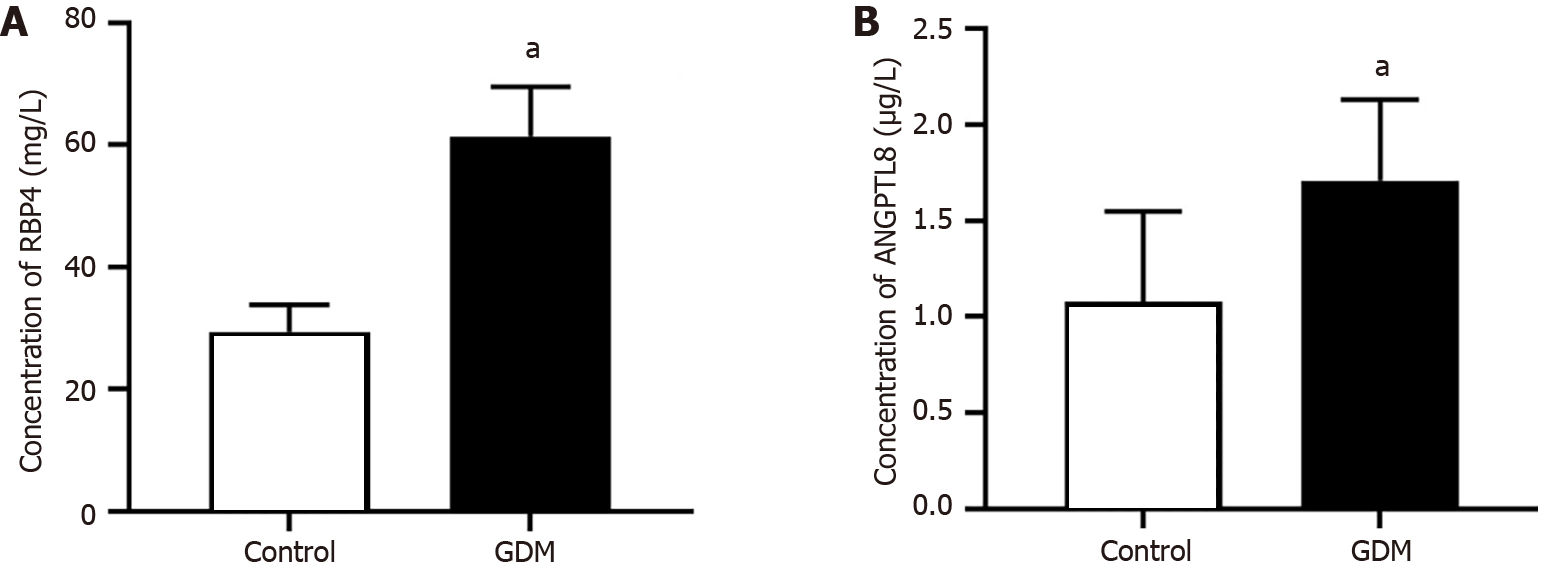
Figure 7 Protein level of RBP4 and ANGPTL8 in serum.
A and B: Concentration of RBP4 (A) and ANGPTL8 (B) in the patient serum in control and gestational diabetes mellitus (GDM) groups. Values are shown as the mean ± SEM (n = 20); aP < 0.05 for Control vs GDM. GDM: Gestational diabetes mellitus.
- Citation: Cao WL, Yu CP, Zhang LL. Serum proteins differentially expressed in gestational diabetes mellitus assessed using isobaric tag for relative and absolute quantitation proteomics. World J Clin Cases 2024; 12(8): 1395-1405
- URL: https://www.wjgnet.com/2307-8960/full/v12/i8/1395.htm
- DOI: https://dx.doi.org/10.12998/wjcc.v12.i8.1395


