Copyright
©The Author(s) 2024.
World J Clin Cases. Feb 26, 2024; 12(6): 1120-1129
Published online Feb 26, 2024. doi: 10.12998/wjcc.v12.i6.1120
Published online Feb 26, 2024. doi: 10.12998/wjcc.v12.i6.1120
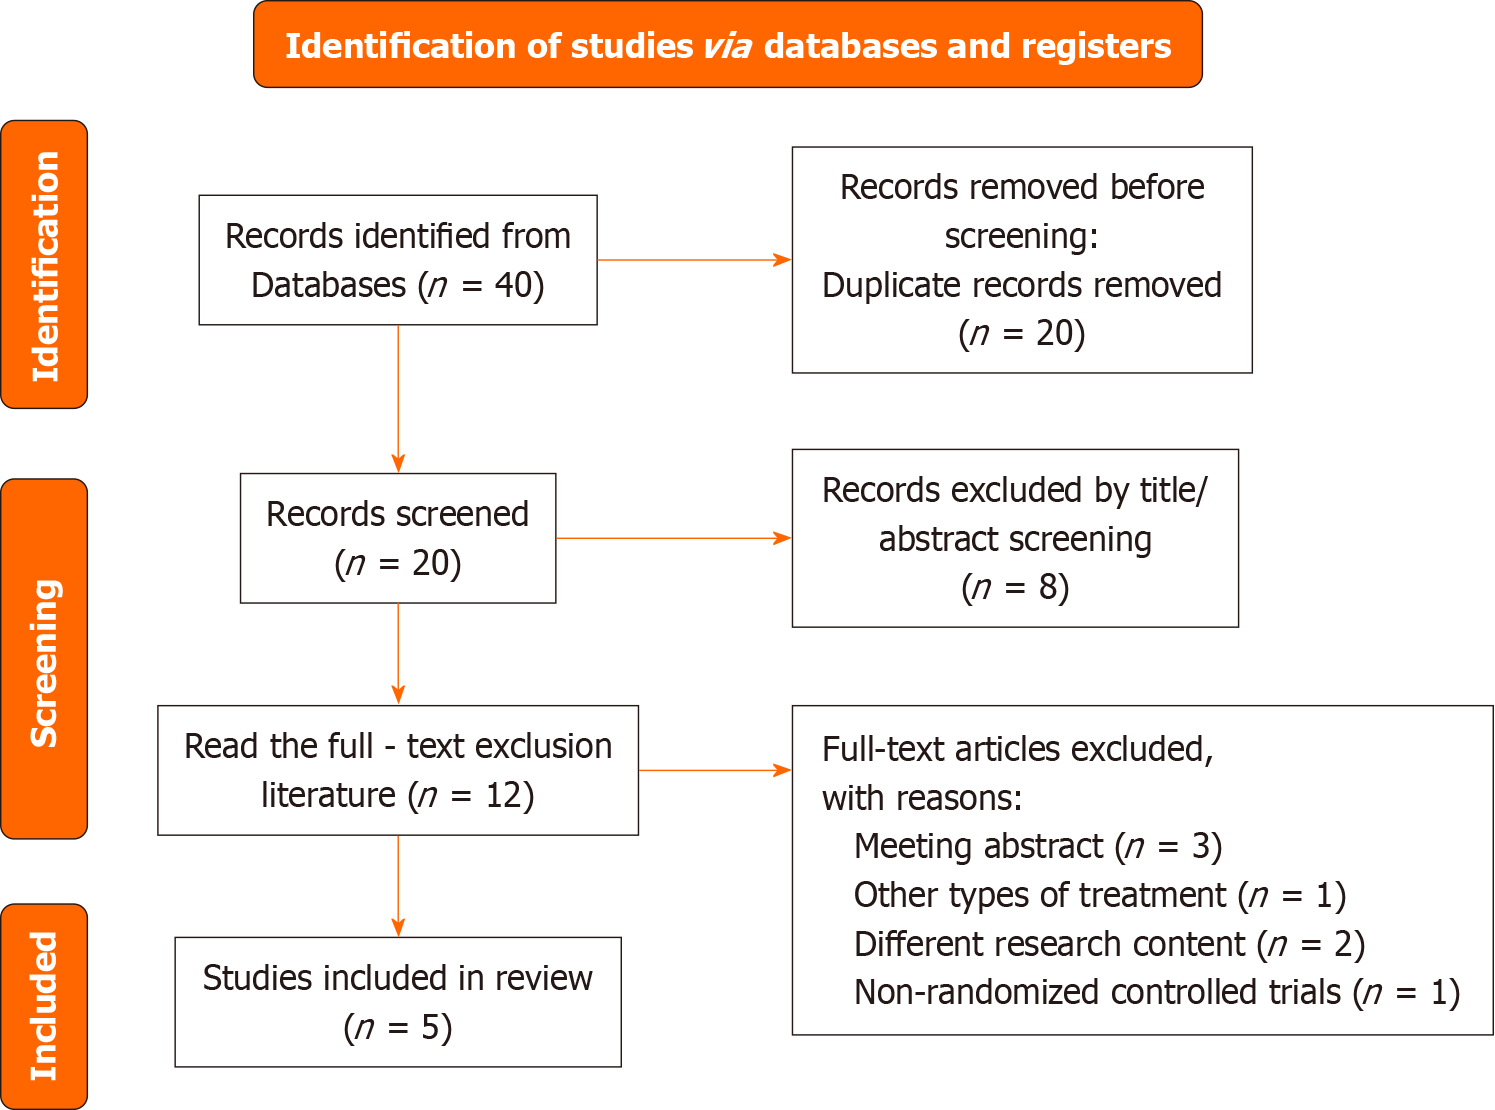
Figure 1 Flow diagram of study searching and selection process.
Figure 2 The risk of bias graph of included studies.
The five studies showed a low bias risk for they assessed randomized sequence generation (100%), blinding of participants (100%), blinding of outcome (80%), selective reporting (100%), and others (60%).
Figure 3 The risk of bias summary of included studies.
Three of the five studies exhibit high quality according to the assessment result.
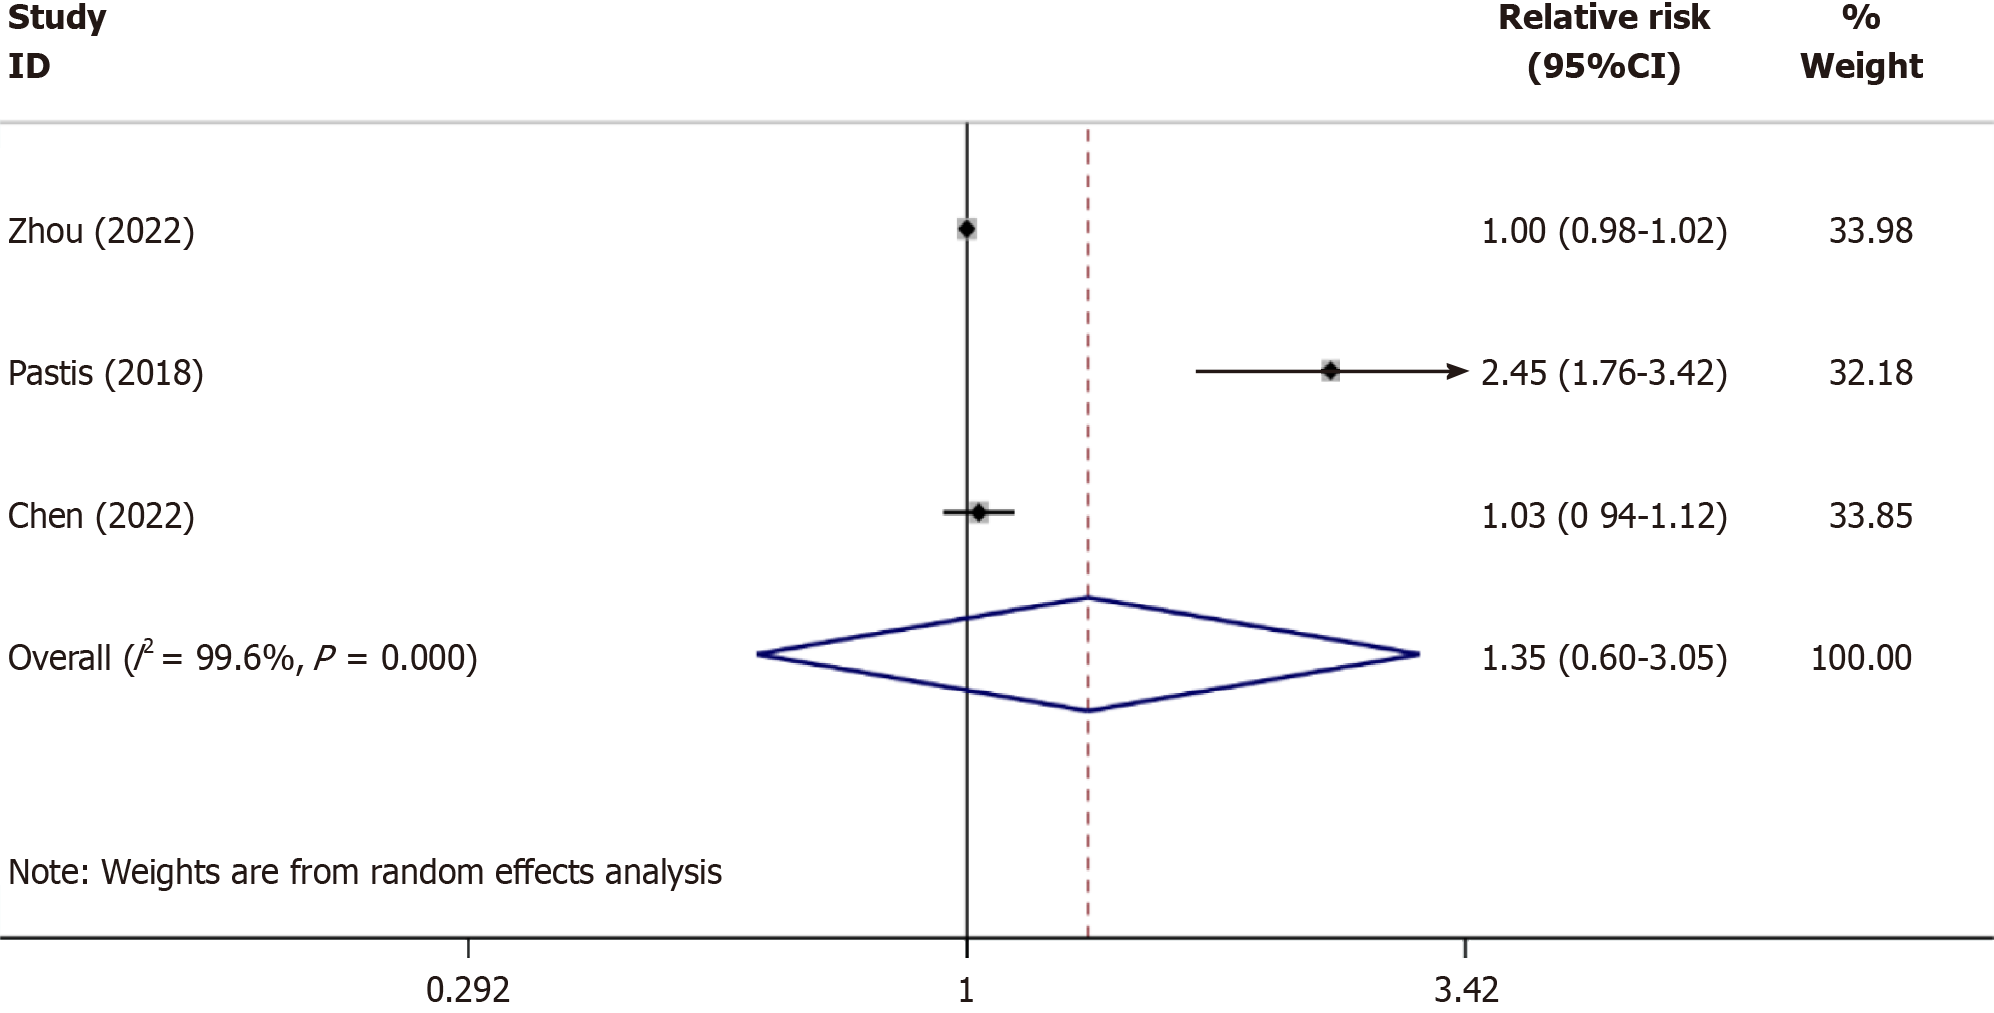
Figure 4 Comparison of the sedation success of remimazolam with conventional sedatives.
A total of three studies investigated the sedation success of remimazolam vs conventional sedatives, and pooled analyses showed equal sedation success.
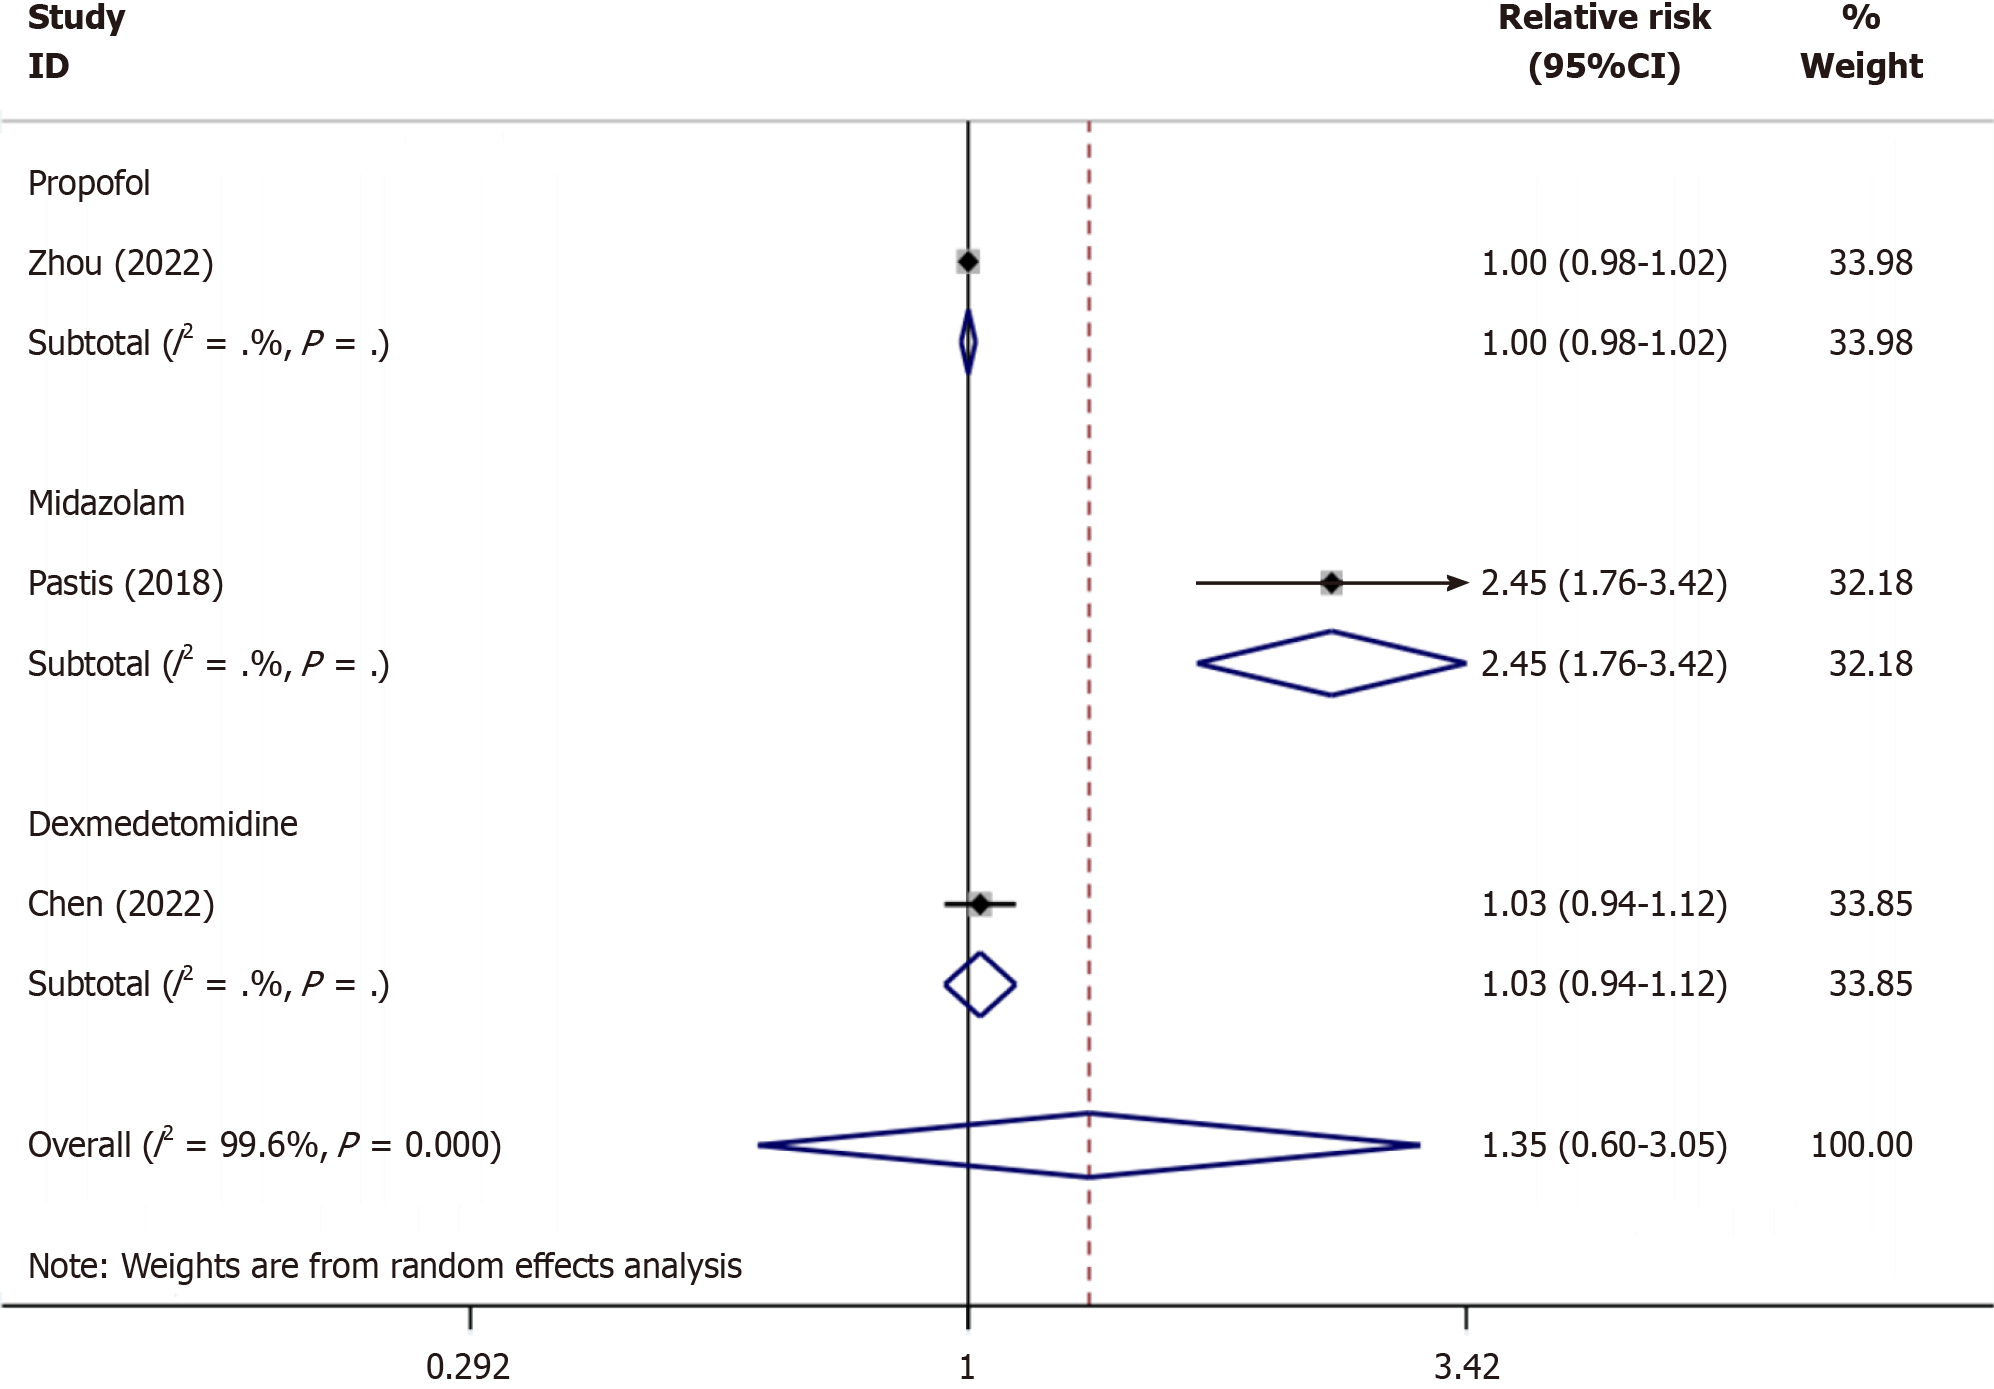
Figure 5 Subgroup analysis of the sedation success of remimazolam compared with propofol, midazolam, and dexmedetomidine.
The results showed that there was no significant difference in sedation success between remimazolam and propofol, remimazolam sedation success was higher than midazolam, and there was no significant difference in sedation success between remimazolam and dexmedetomidine.
- Citation: Zhou Y, Zhao C, Tang YX, Liu JT. Efficacy and safety of remimazolam in bronchoscopic sedation: A meta-analysis. World J Clin Cases 2024; 12(6): 1120-1129
- URL: https://www.wjgnet.com/2307-8960/full/v12/i6/1120.htm
- DOI: https://dx.doi.org/10.12998/wjcc.v12.i6.1120


