Copyright
©The Author(s) 2024.
World J Clin Cases. Feb 26, 2024; 12(6): 1063-1075
Published online Feb 26, 2024. doi: 10.12998/wjcc.v12.i6.1063
Published online Feb 26, 2024. doi: 10.12998/wjcc.v12.i6.1063
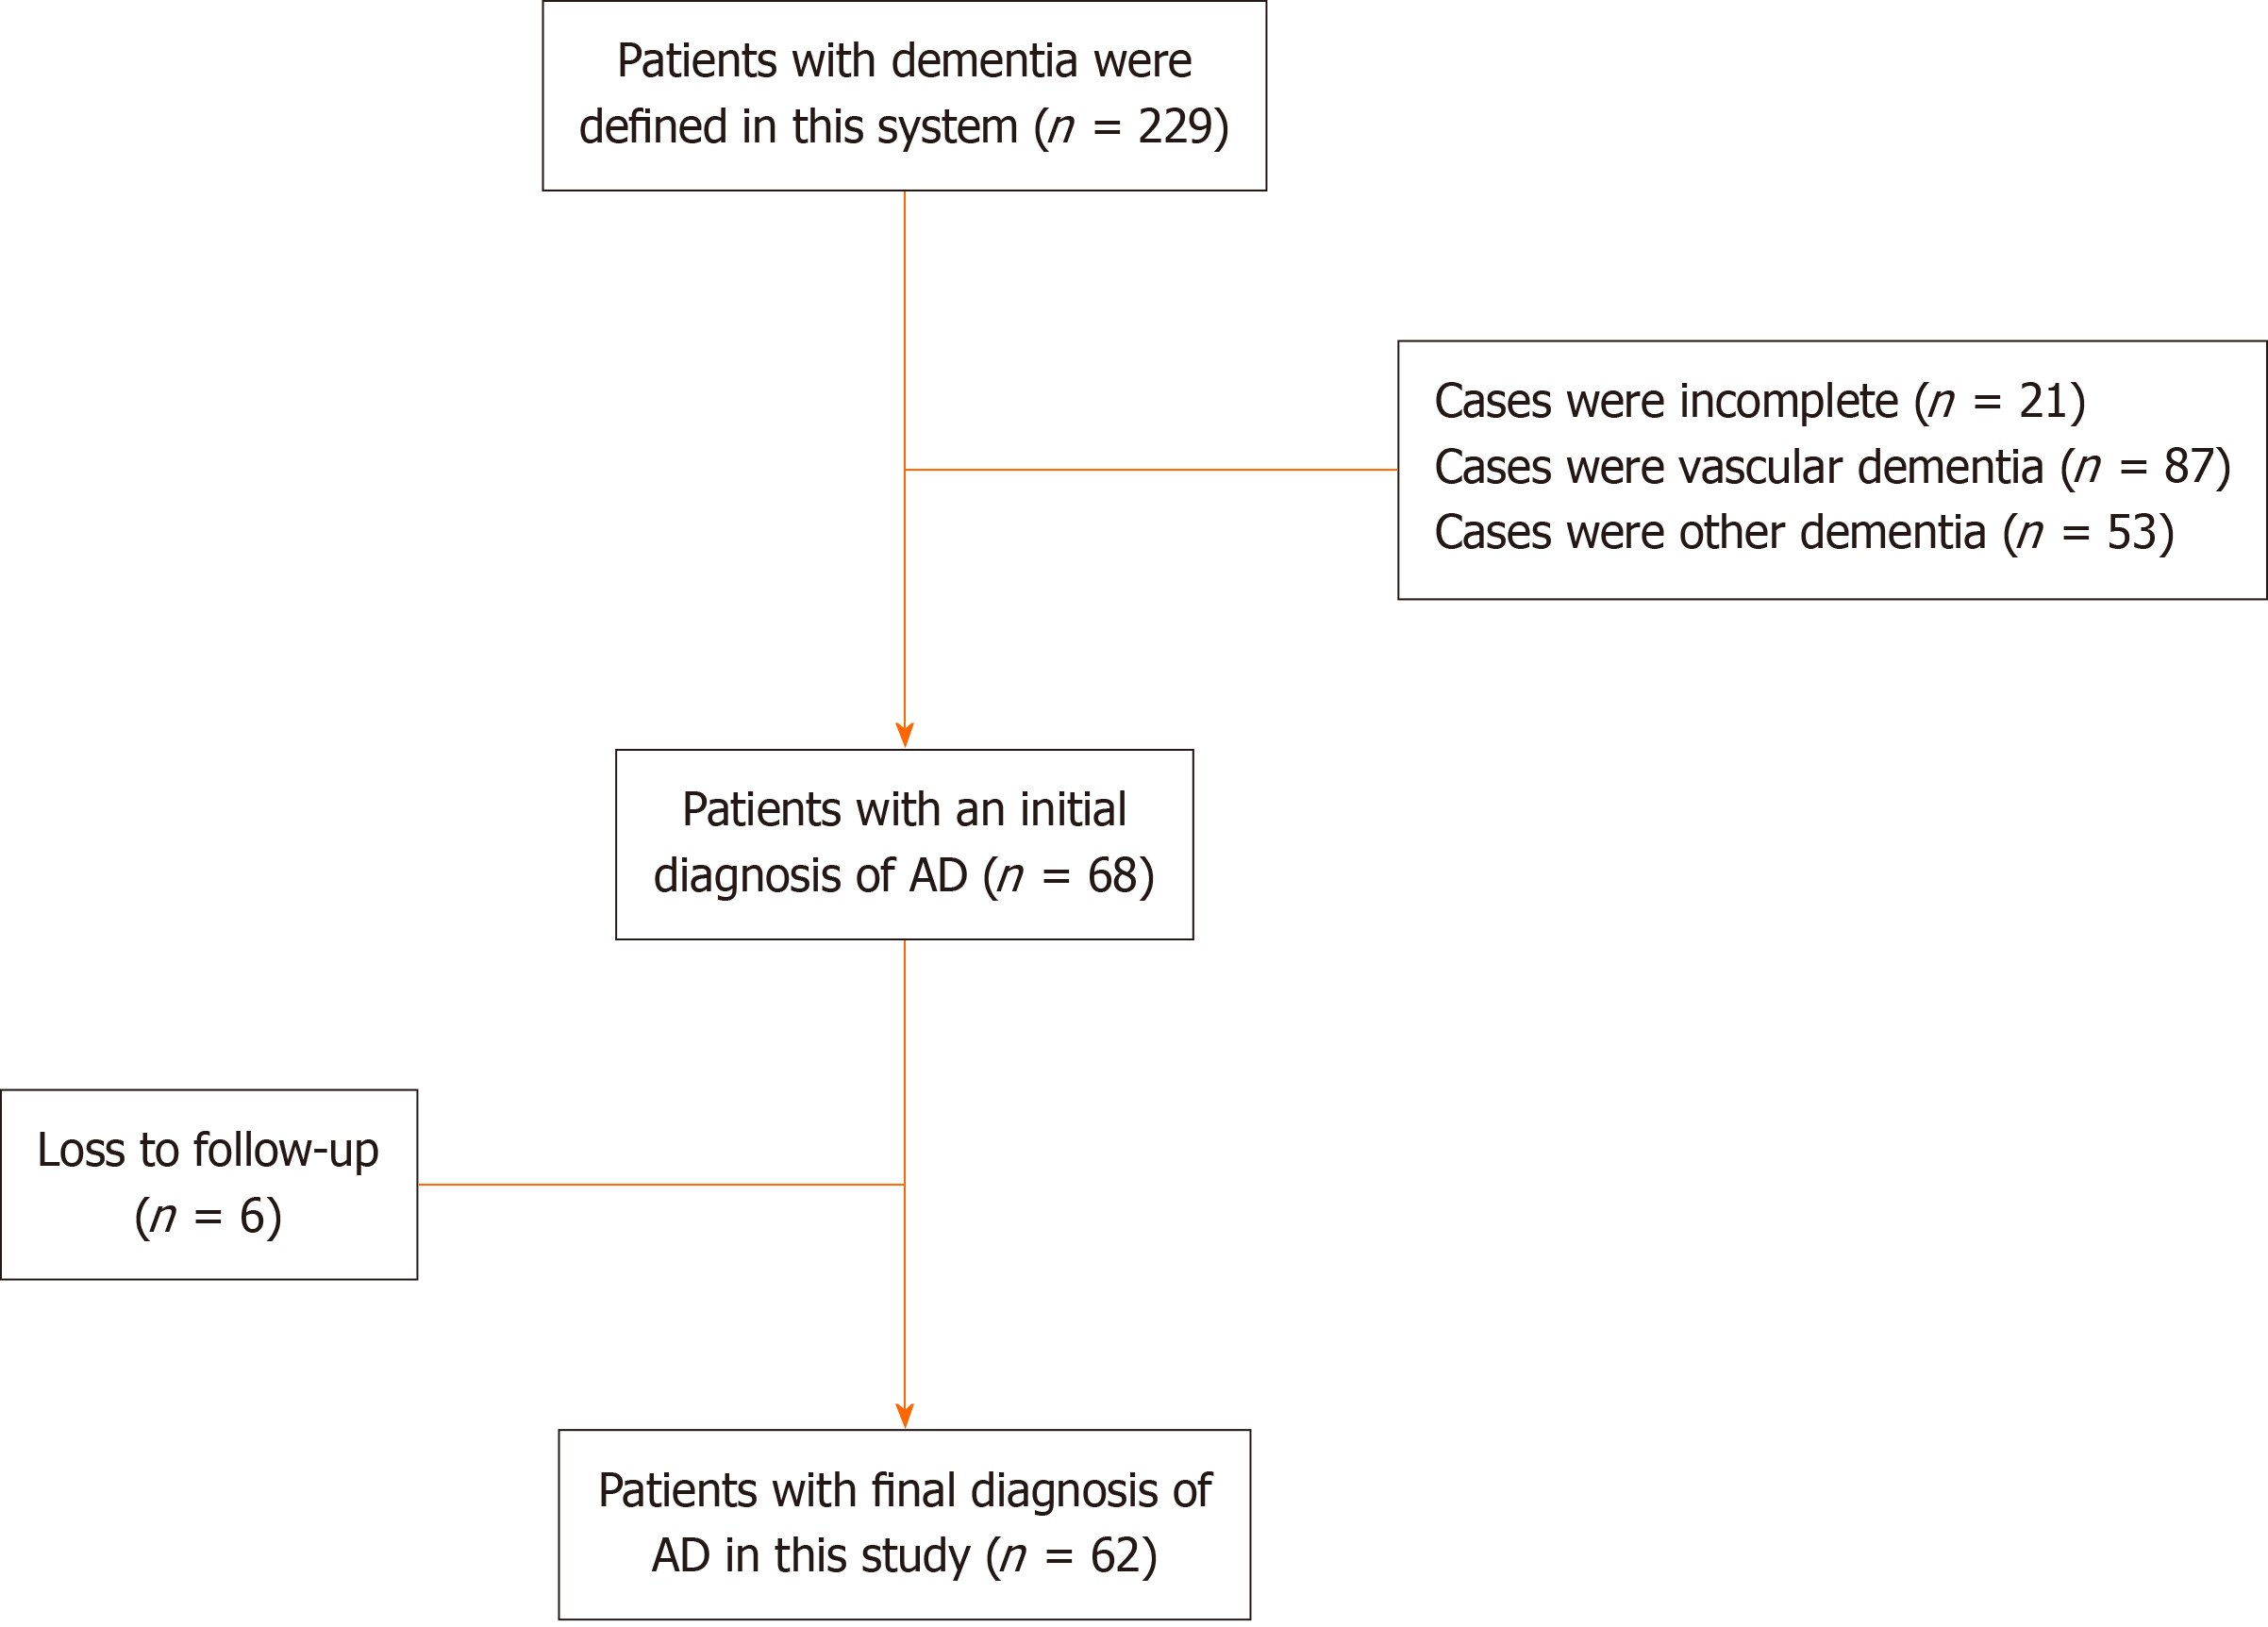
Figure 1 Flowchart of the study.
AD: Alzheimer’s disease.
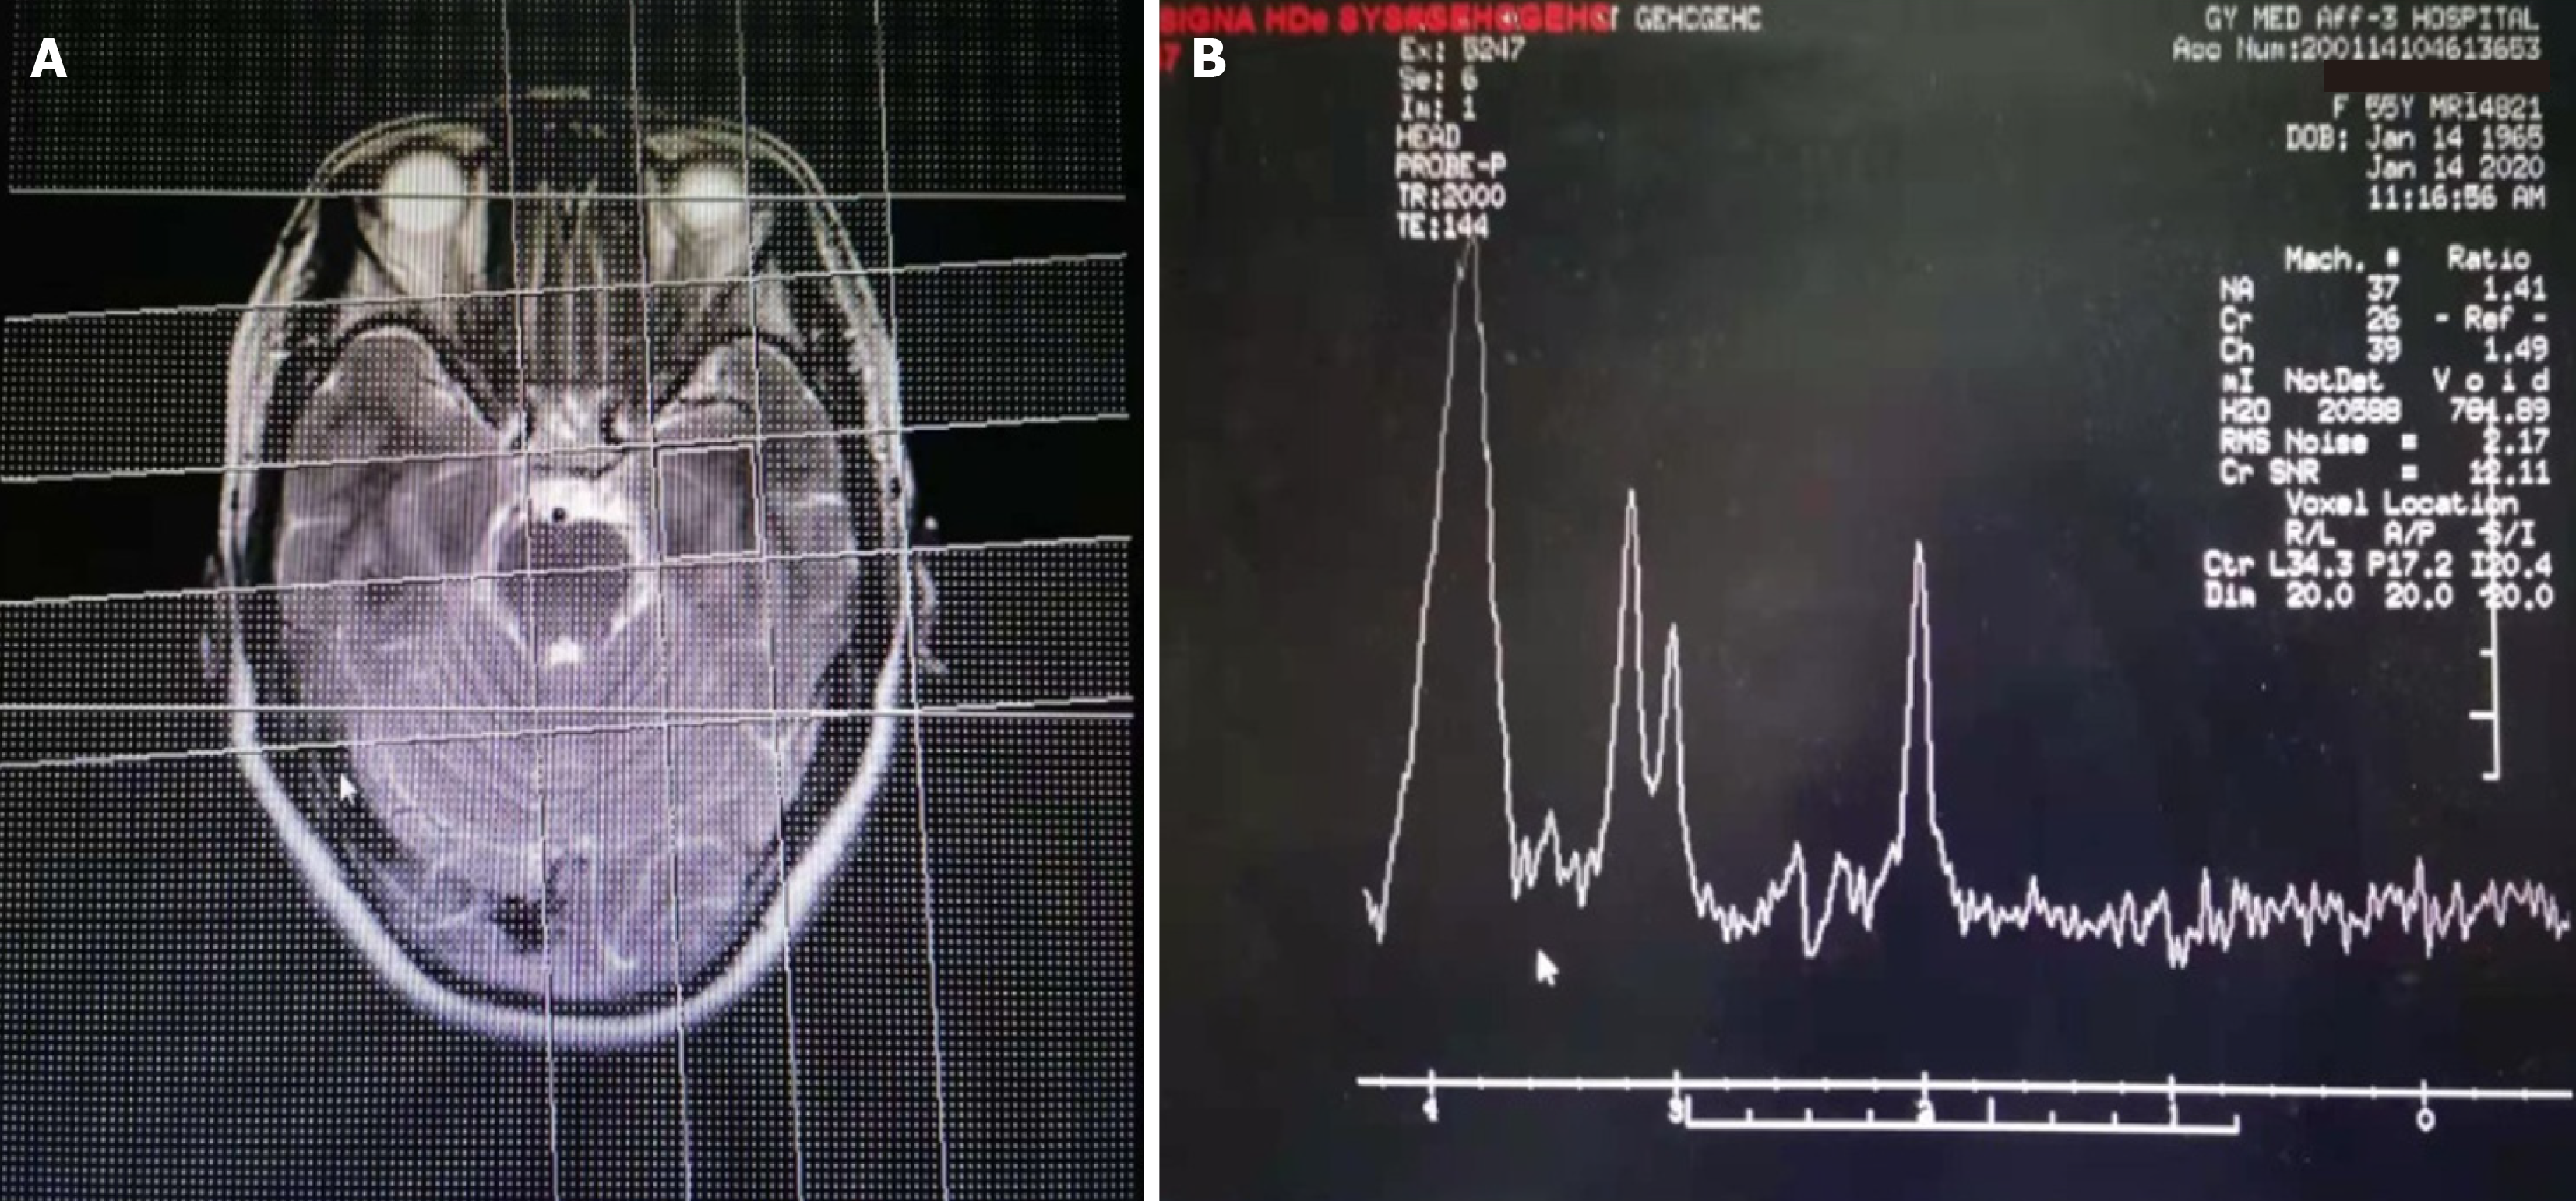
Figure 2 Magnetic resonance imaging and corresponding magnetic spectroscopy images of an Alzheimer’s disease patient.
The patient was a 55-year-old female with a 4-year course of disease and a Mini Mental State Examination Scale score of 14 points. A: Magnetic resonance imaging images (axial view) of the patient showed mild degeneration and atrophy in the hippocampus, deepening of multiple cerebral sulcus, suggesting mild brain atrophy; B: The corresponding magnetic spectroscopy pictures of the patient showed N-acetylaspartate 37mmol/L, creatine 26 mmol/L, and choline 39 mmol/L, indicating that there was a metabolic disorder of brain neurotransmitters.
Figure 3 Lymphocyte subsets in the blood of Alzheimer’s disease patients were detected by flow cytometry.
A: T cell was detected by using Anti-human CD3e-PE (ebioscience); B: B cells were detected by using Anti-Human CD19-PerCP (BioLegend); C: Natural killer cells were detected by using anti-human CD56-APC (ebioscience). NK: Natural killer.
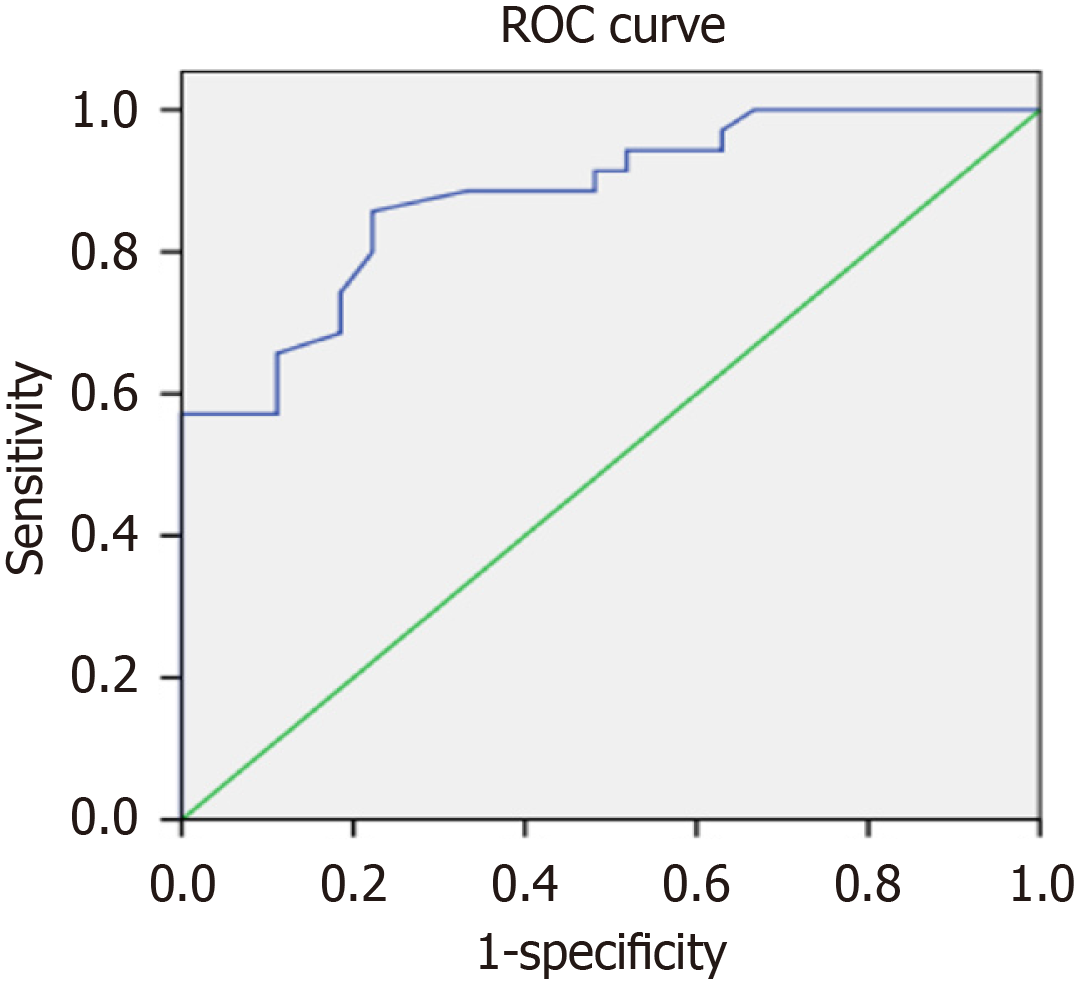
Figure 4 Receptor working curve of the predictive value of N-acetylaspartate/creatine ratio of magnetic spectroscopy for poor prognosis of Alzheimer’s disease.
ROC: Receptor working curve.
- Citation: Bai H, Zeng HM, Zhang QF, Hu YZ, Deng FF. Correlative factors of poor prognosis and abnormal cellular immune function in patients with Alzheimer’s disease. World J Clin Cases 2024; 12(6): 1063-1075
- URL: https://www.wjgnet.com/2307-8960/full/v12/i6/1063.htm
- DOI: https://dx.doi.org/10.12998/wjcc.v12.i6.1063


