Copyright
©The Author(s) 2024.
World J Clin Cases. Feb 16, 2024; 12(5): 980-987
Published online Feb 16, 2024. doi: 10.12998/wjcc.v12.i5.980
Published online Feb 16, 2024. doi: 10.12998/wjcc.v12.i5.980
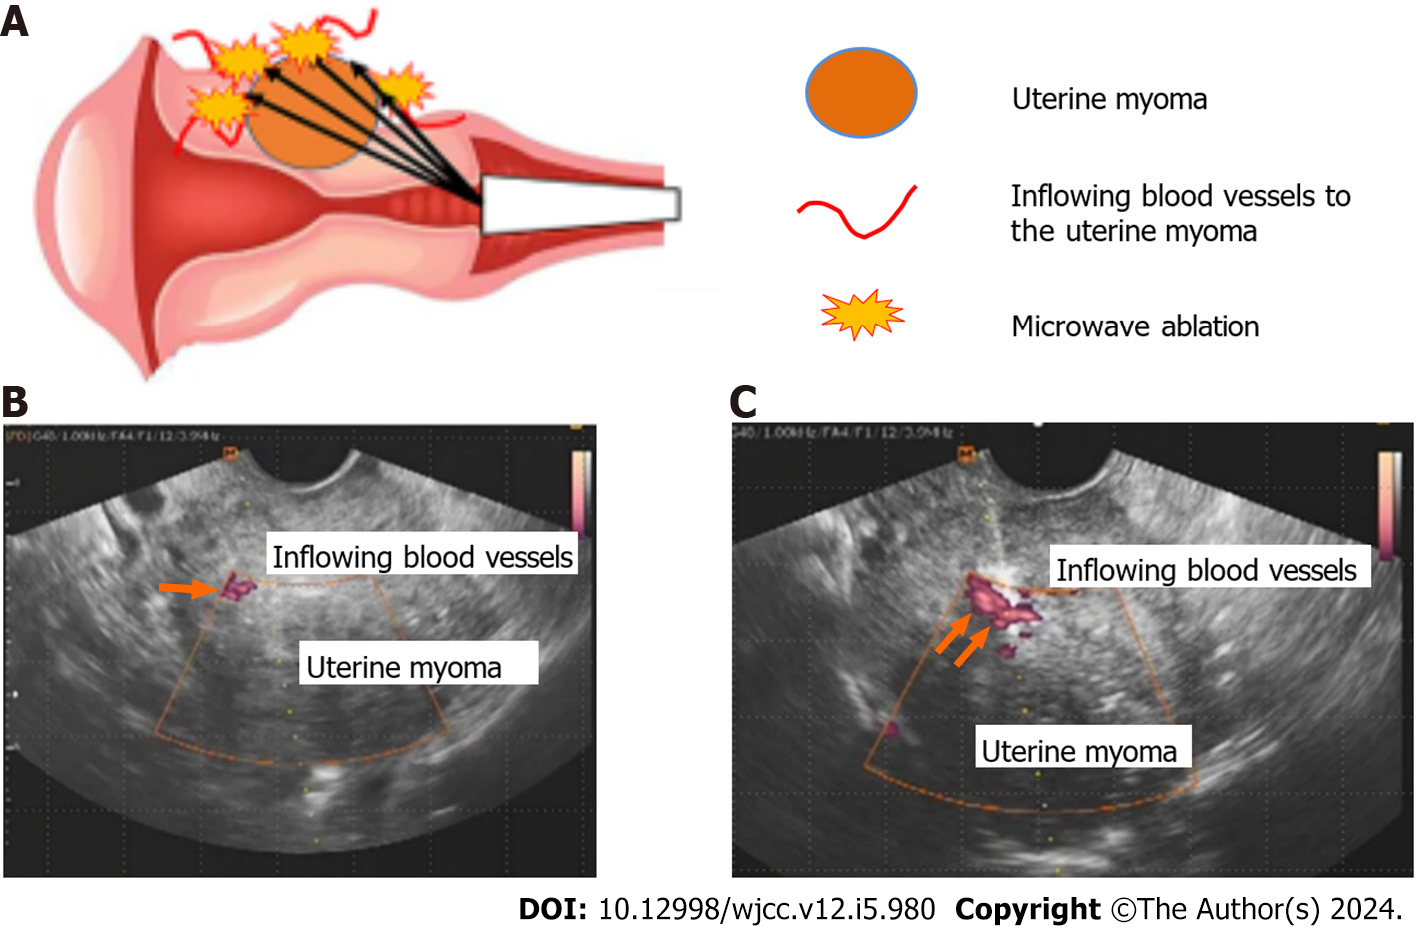
Figure 1 Transvaginal ultrasound tomography.
A: The schema for this procedure. Transvaginal ultrasound tomography was used to identify the feeding vessels of the uterine myomas via the color Doppler method. Using a needle-shaped deep coagulation electrode, the feeding vessels were directly ablated with microwaves at 2.45 GHz; B: Intraoperative transvaginal ultrasound tomography. Transvaginal ultrasound tomography using the color Doppler method was performed to identify the feeding vessels to the uterine myomas (arrow); C: A transvaginal ultrasound-guided microwave ablation of the feeding vessels to the uterine myomas using a needle-shaped deep coagulation electrode is depicted as a hyperechoic area (arrows).
Figure 2 Magnetic resonance imaging examination of the pelvis of before the procedure.
Magnetic resonance imaging examination of the pelvis of before the procedure. A: Case 1; Sagittal T2-weighted image showed a 65 mm solid mass; B: Case 2; Sagittal T2-weighted image showed a 35 mm solid mass; C: Case 3; Sagittal T2-weighted image showed a 22 mm and 15 mm solid mass.
Figure 3 Magnetic resonance imaging examination of the pelvis of post the procedure.
A: Case 1; The uterine myoma [International Federation of Gynecology and Obstetrics (FIGO) classification system 5] reduced from 65 mm to 27 mm by postoperative month 3; B: Case 2; The uterine myomas (FIGO classification system 5) reduced from 35 mm to 20 mm by postoperative month 3; C: Case 3; The uterine myomas (FIGO classification system 5) reduced from 22 mm and 15 mm to 15 mm and 13 mm by postoperative month 3.s
- Citation: Kakinuma T, Kakinuma K, Okamoto R, Yanagida K, Ohwada M, Takeshima N. Abnormal uterine bleeding successfully treated via ultrasound-guided microwave ablation of uterine myoma lesions: Three case reports. World J Clin Cases 2024; 12(5): 980-987
- URL: https://www.wjgnet.com/2307-8960/full/v12/i5/980.htm
- DOI: https://dx.doi.org/10.12998/wjcc.v12.i5.980


