Copyright
©The Author(s) 2024.
World J Clin Cases. Feb 16, 2024; 12(5): 891-902
Published online Feb 16, 2024. doi: 10.12998/wjcc.v12.i5.891
Published online Feb 16, 2024. doi: 10.12998/wjcc.v12.i5.891
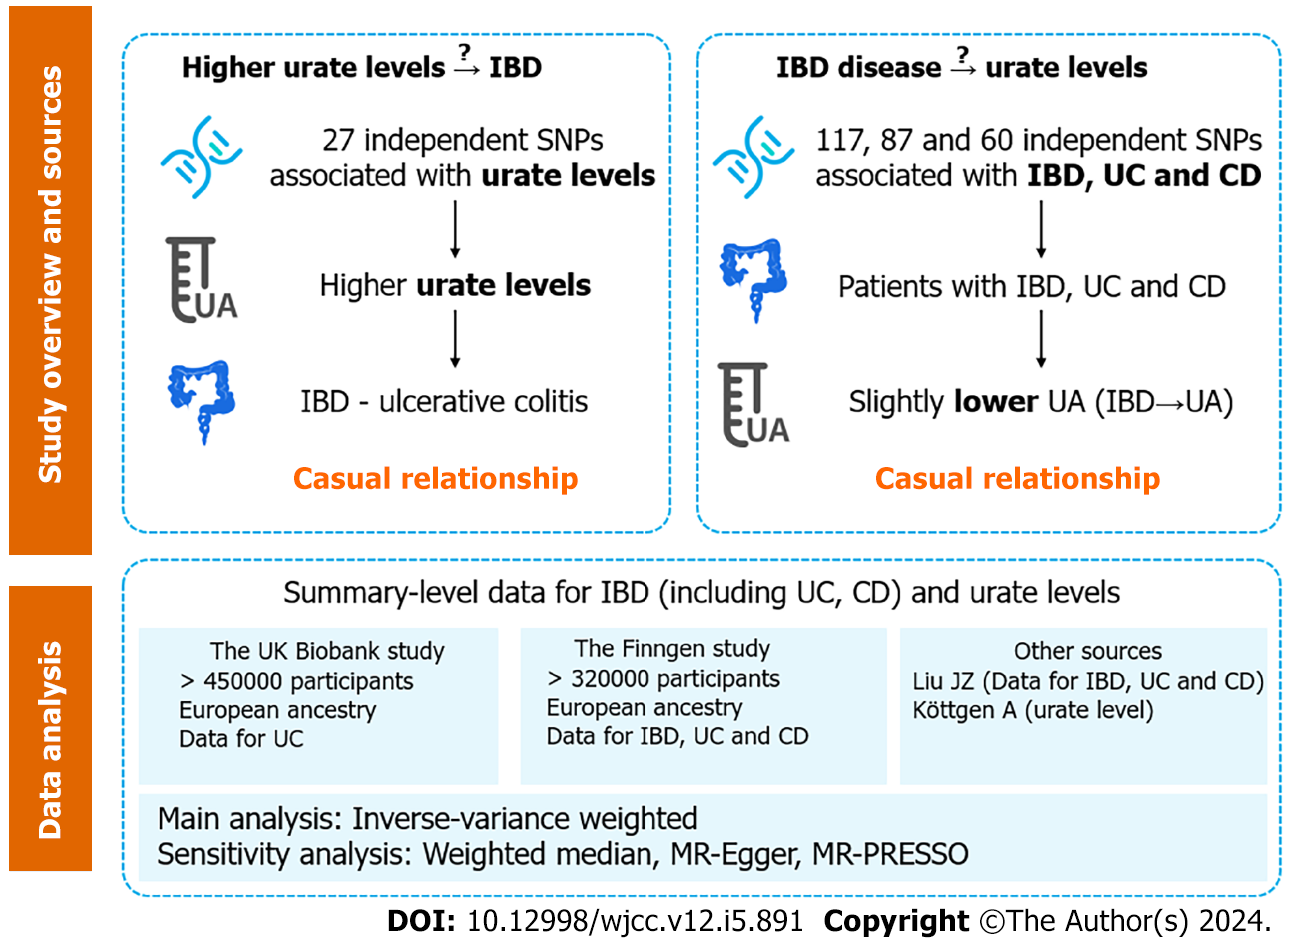
Figure 1 Overview of study design.
IBD: Inflammatory bowel disease; SNP: Single-nucleotide polymorphisms; UC: Ulcerative colitis; CD: Crohn’s disease; UA: Ursolic acid; MR: Mendelian randomization.
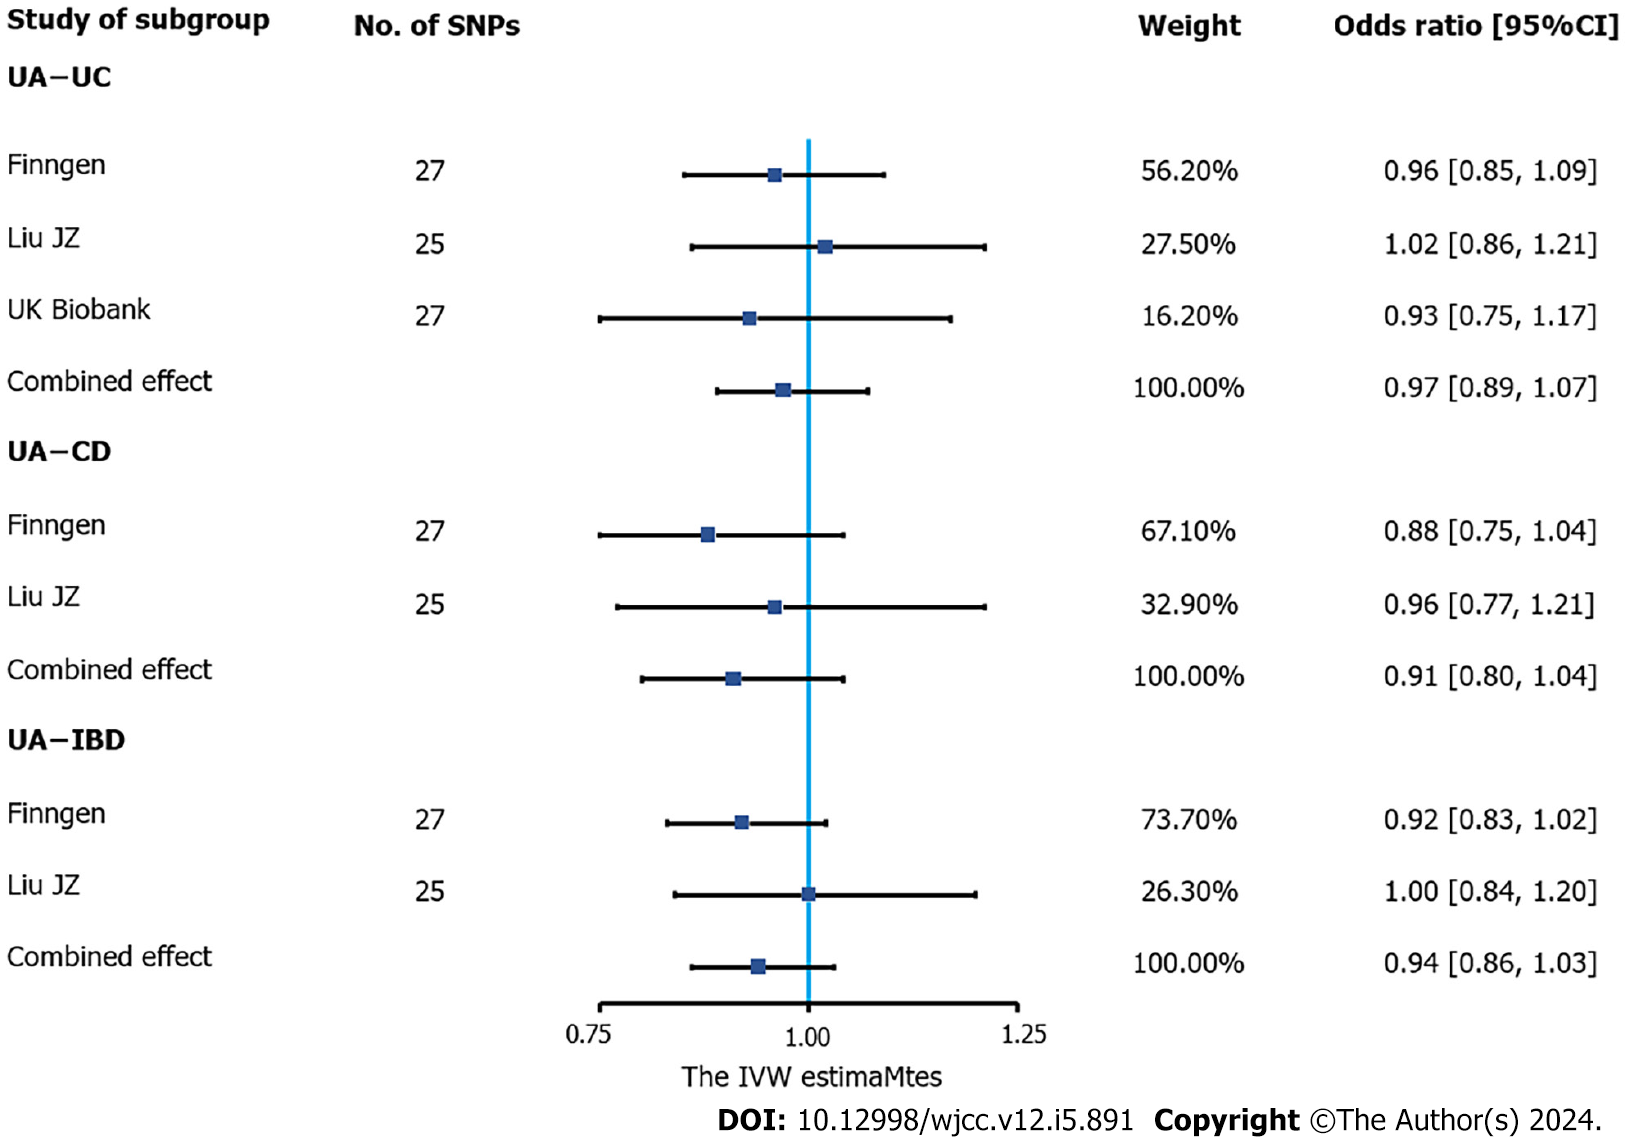
Figure 2 Association of urate levels and inflammatory bowel disease in Mendelian randomization analyses (inverse-variance weighted estimate).
Estimated odds ratios (OR) represent the effect of per log-OR increase in urate levels on inflammatory bowel disease (IBD), using inverse-variance weighted analysis, per outcome database separately. The meta-analyses combined the three databases (genome-wide association studies meta-analysis by Liu et al[19] and the FinnGen and UK Biobank databases) for UC and the former two databases for IBD and Crohn’s disease (UK Biobank data were not available) using a fixed-effects model. IBD: Inflammatory bowel disease; UA: Ursolic acid; UC: Ulcerative colitis; SNP: Single-nucleotide polymorphisms; CD: Crohn’s disease; CI: Confidence interval; IVW: Inverse-variance weighted.
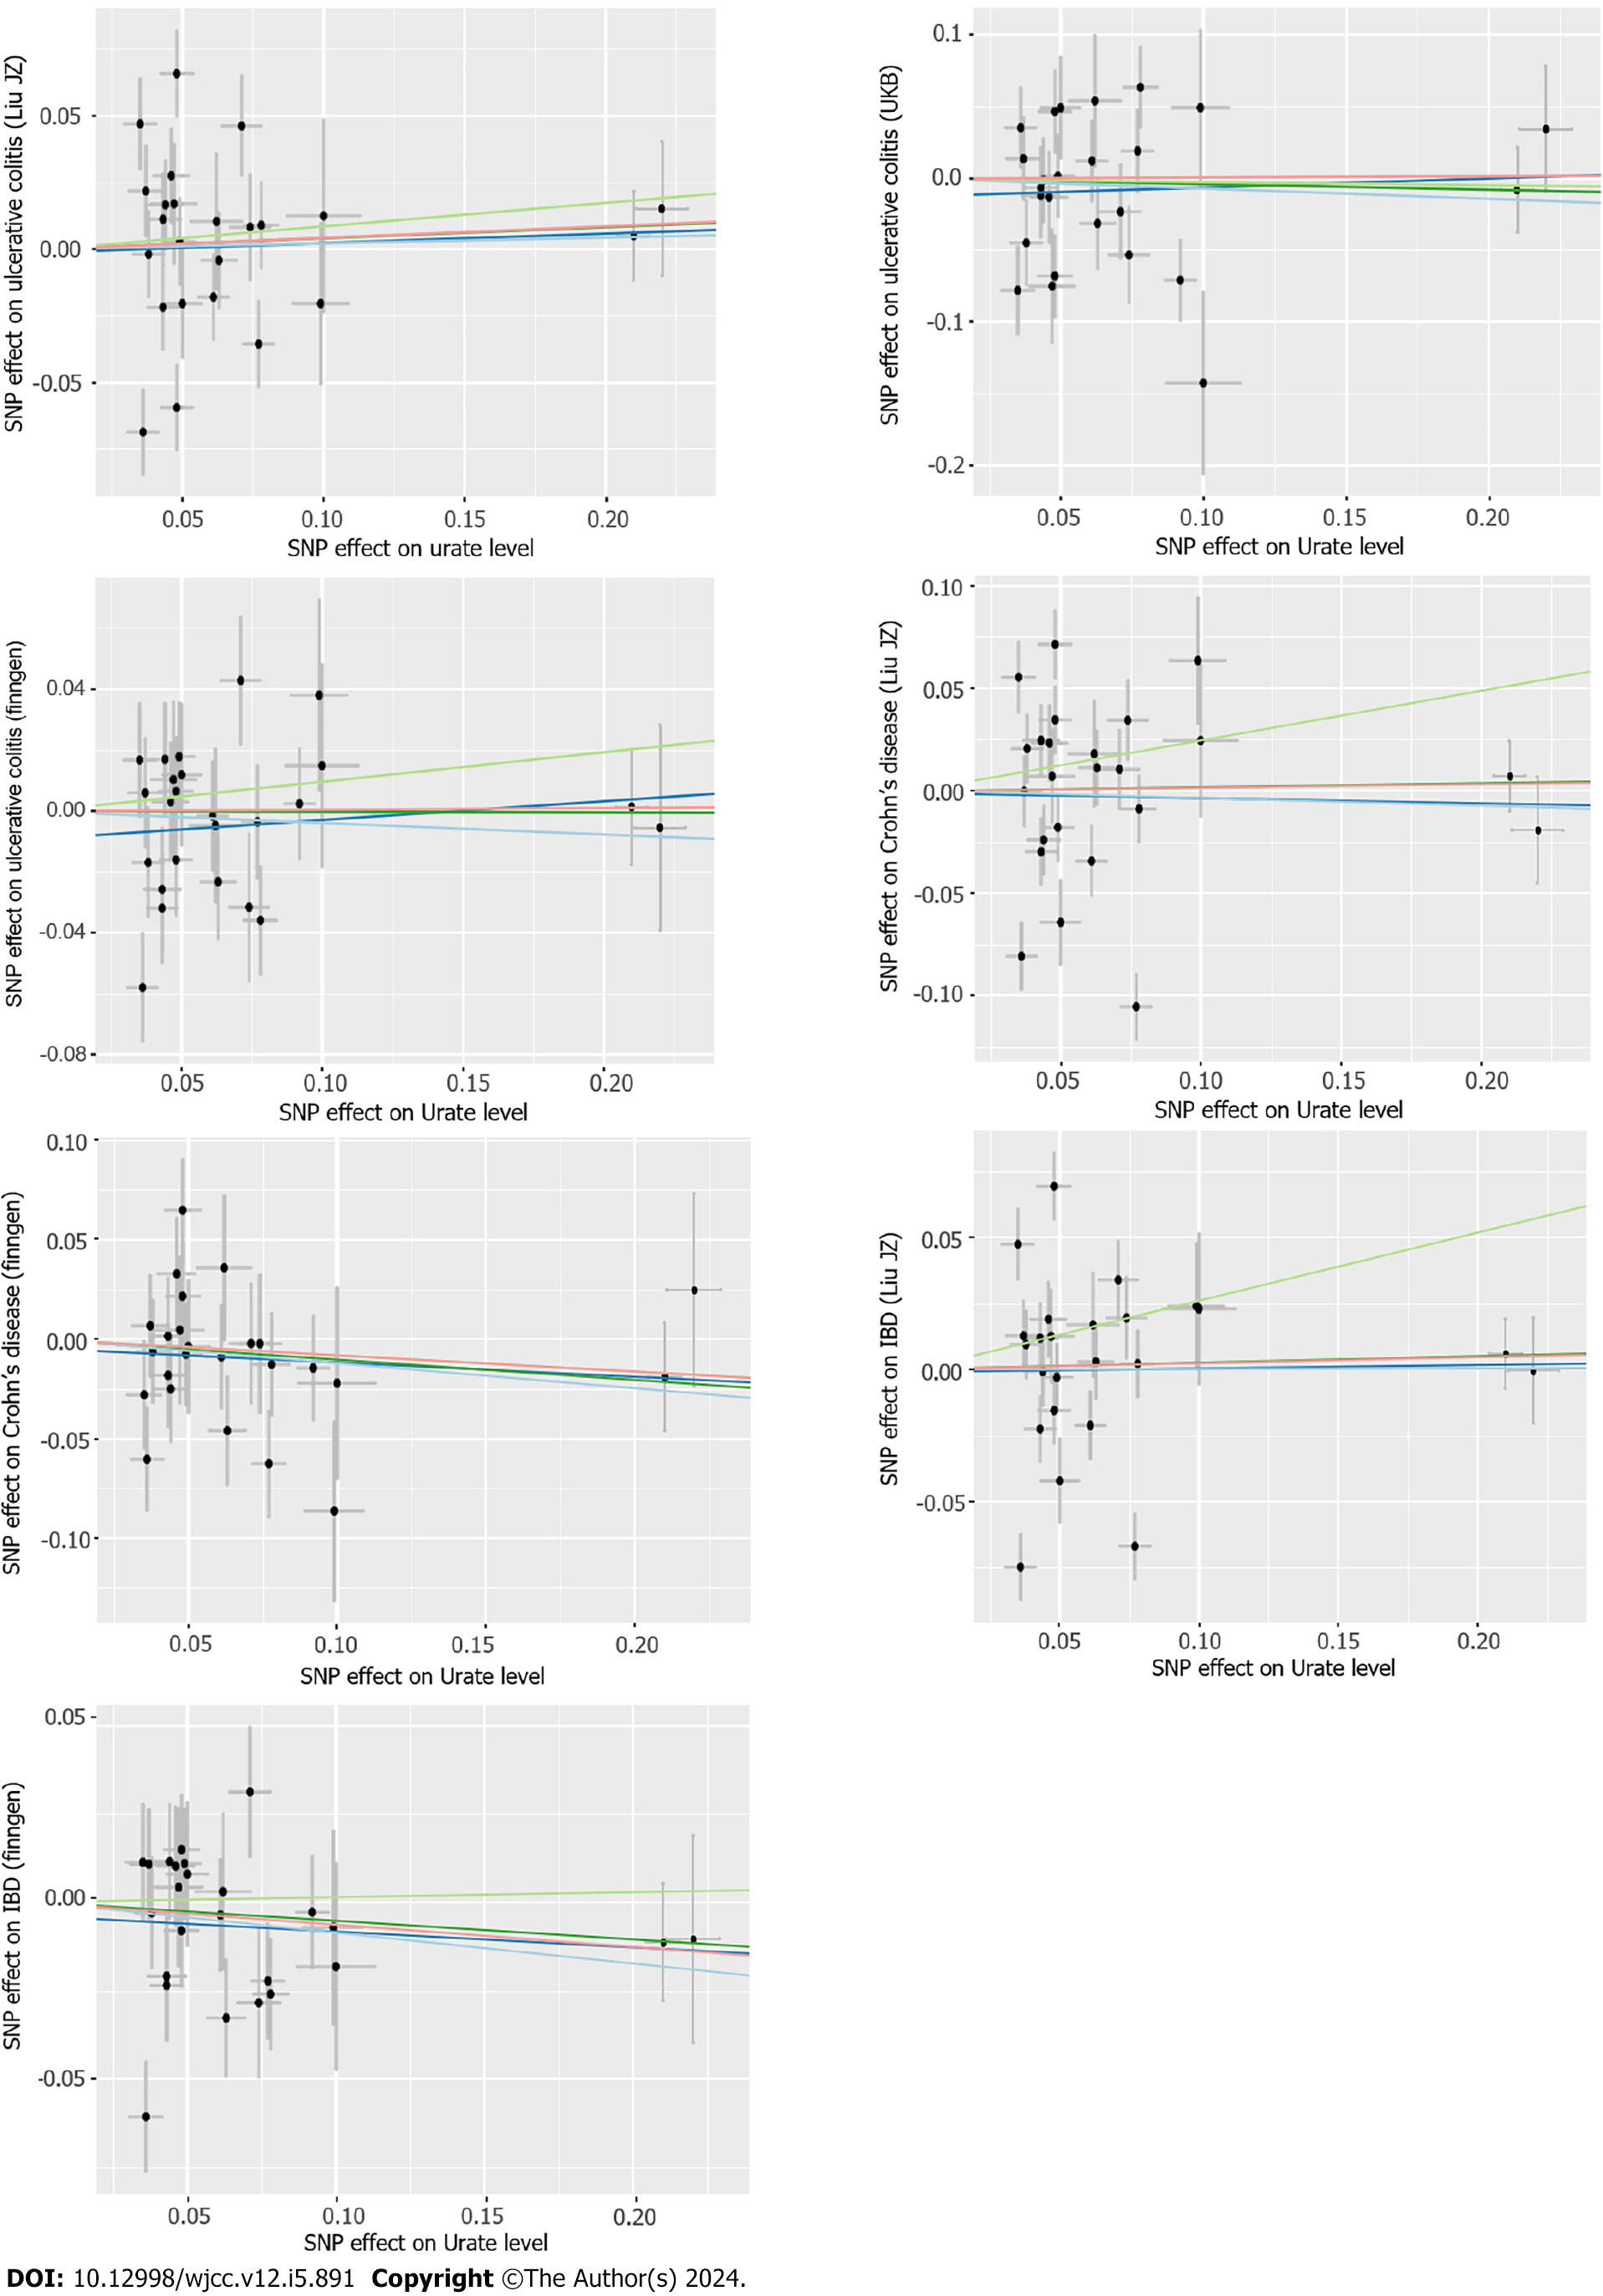
Figure 3 Scatter plot of Mendelian randomization analyses from urate levels to inflammatory bowel disease in each database.
The X-axes indicate the single-nucleotide polymorphisms (SNPs) of urate levels, while the Y-axes indicate the SNPs of inflammatory bowel disease from different outcome databases. The black dots represent the genetic instruments included in the current Mendelian randomization (MR) analyses. The five colors represent five different genetic estimates: Red: Inverse-variance weighted; Blue: Weighted-median estimator; Green: MR Egger. IBD: Inflammatory bowel disease; SNP: Single-nucleotide polymorphisms.
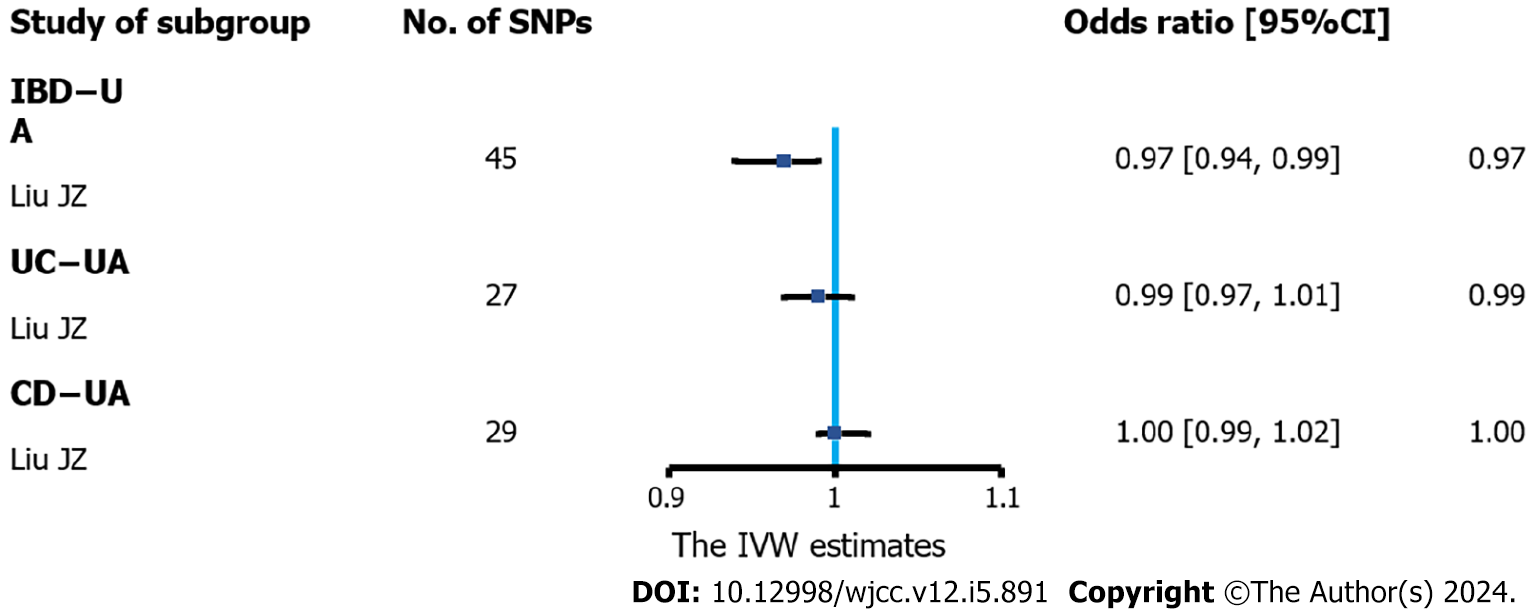
Figure 4 Association of inflammatory bowel disease and urate levels in Mendelian randomization analyses (inverse-variance weighted estimate).
Estimated odds ratio (OR) represent the effect of per log-OR increase in inflammatory bowel disease on urate levels, using inverse-variance weighted analysis with a fixed-effects model. IBD: Inflammatory bowel disease; UC: Ulcerative colitis; CD: Crohn’s disease; CI: Confidence interval; SNP: Single-nucleotide polymorphisms; UA: Ursolic acid; IVW: Inverse-variance weighted.
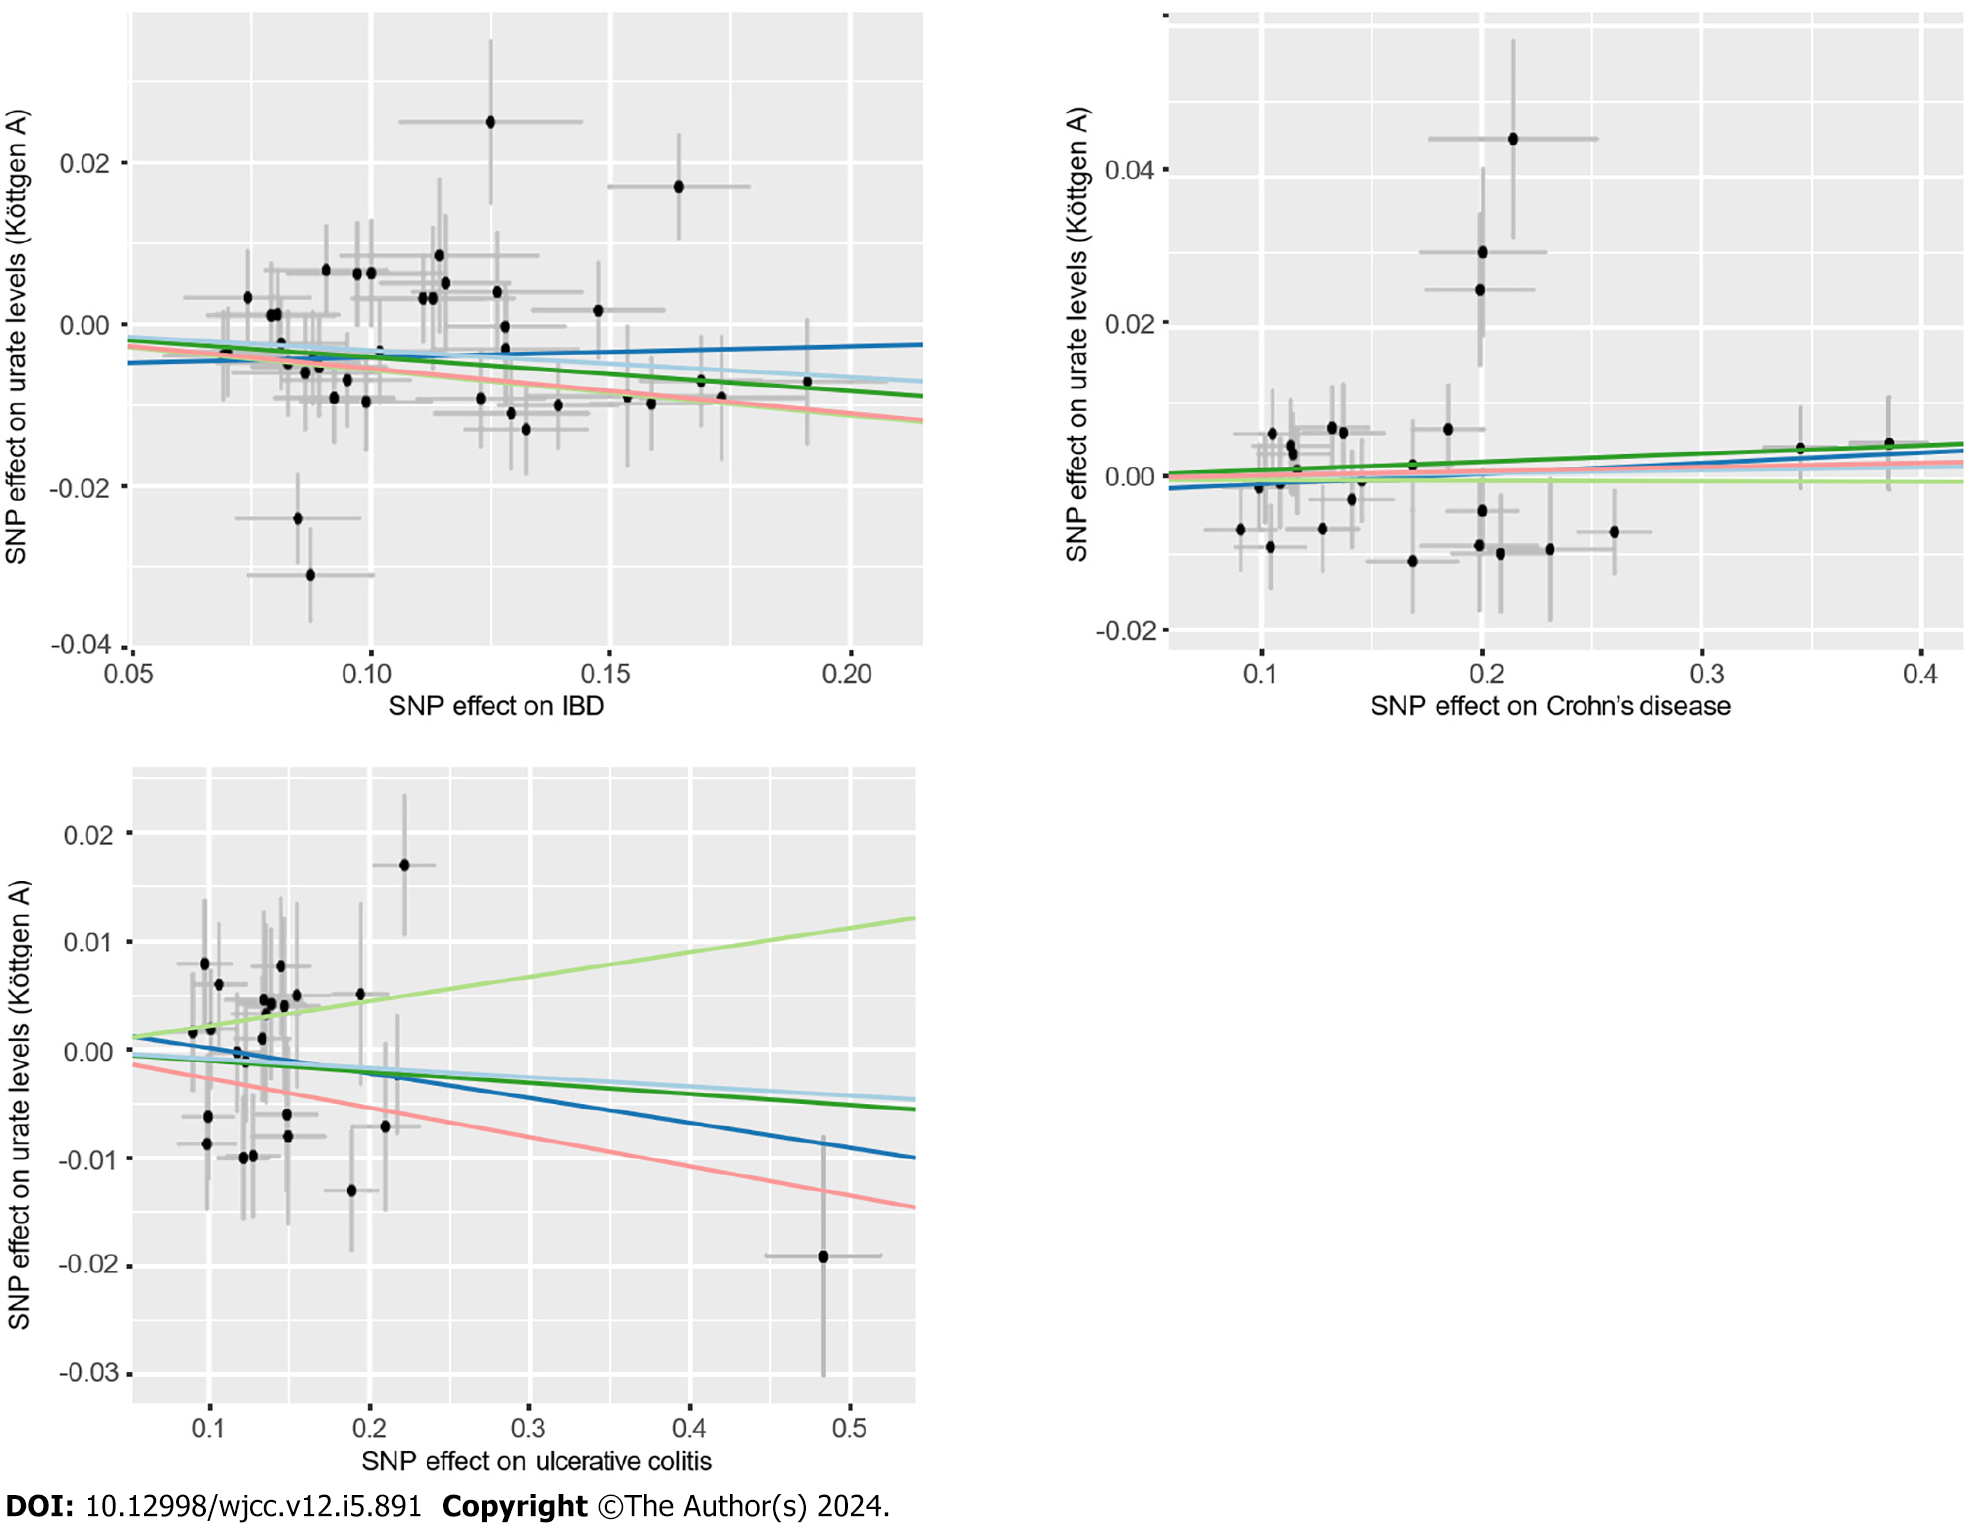
Figure 5 Scatter plot of the association of inflammatory bowel disease with urate levels.
The detailed description is the same as in Figure 3. IBD: Inflammatory bowel disease; SNP: Single-nucleotide polymorphisms.
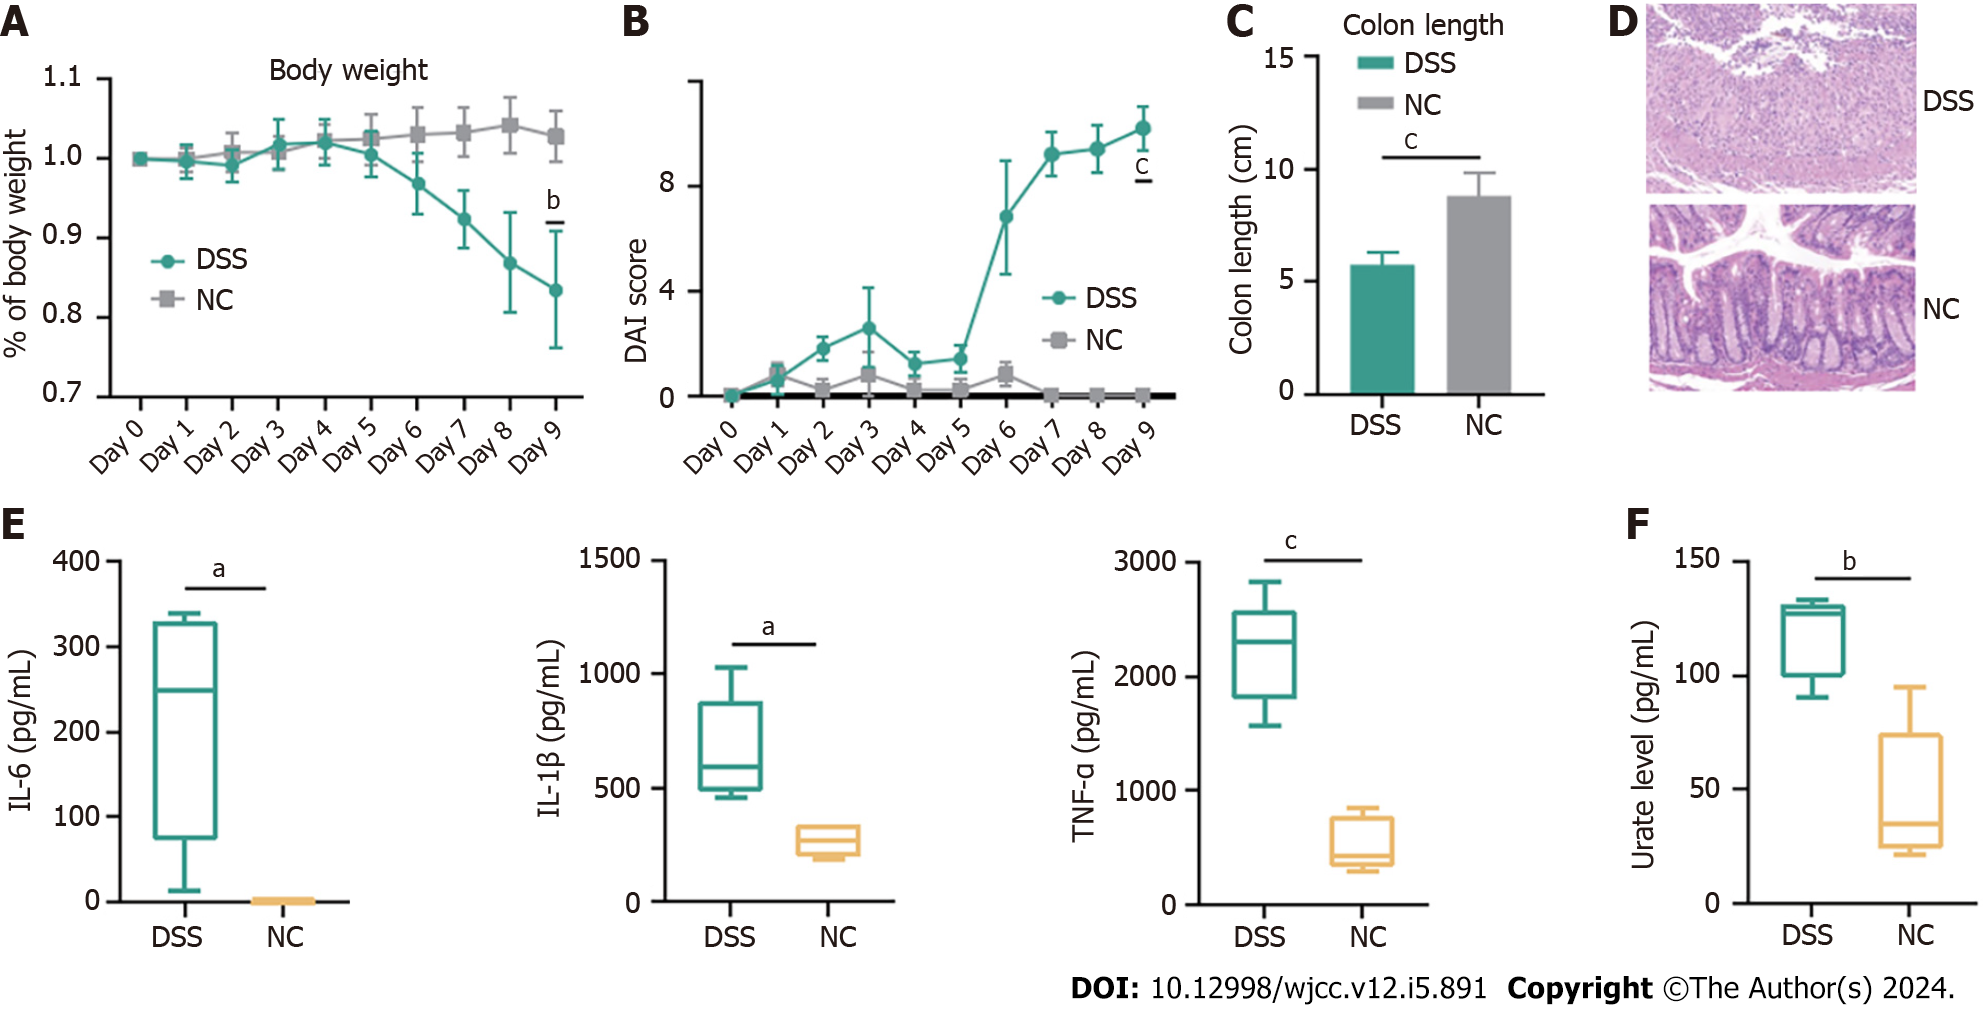
Figure 6 Dextran sulfate sodium contributed to increase of inflammation in inflammatory bowel disease mice.
C57BL/6 mice were administered dextran sulfate sodium (DSS) (2%) for 7 d (and a control group was provided with water only for comparison) and 2 d for water. A-E: DSS group (n = 5) exhibited a significant aggravation of inflammatory bowel disease-associated changes in of body weight (A), disease activity index (B), colon length (C), inflammatory infiltration (D) and increased levels of interleukin (IL)-6, IL-1β and tumor necrosis factor-α (E); F: Compared with control group (n = 5), DSS group demonstrated increased levels of urate levels. DSS: Dextran sulfate sodium; NC: Control group; IL: Interleukin; TNF: Tumor necrosis factor; DAI: Disease activity index. aP < 0.05; bP < 0.01; cP < 0.001.
- Citation: Zhang S, Fang X, Kang L, Sui XY, Liu M, Luo YJ, Fu S, Li ZS, Zhao SB, Bai Y. Serum urate is associated with an increased risk of inflammatory bowel disease: A bidirectional Mendelian randomization study. World J Clin Cases 2024; 12(5): 891-902
- URL: https://www.wjgnet.com/2307-8960/full/v12/i5/891.htm
- DOI: https://dx.doi.org/10.12998/wjcc.v12.i5.891


