Copyright
©The Author(s) 2024.
World J Clin Cases. Feb 16, 2024; 12(5): 1010-1017
Published online Feb 16, 2024. doi: 10.12998/wjcc.v12.i5.1010
Published online Feb 16, 2024. doi: 10.12998/wjcc.v12.i5.1010
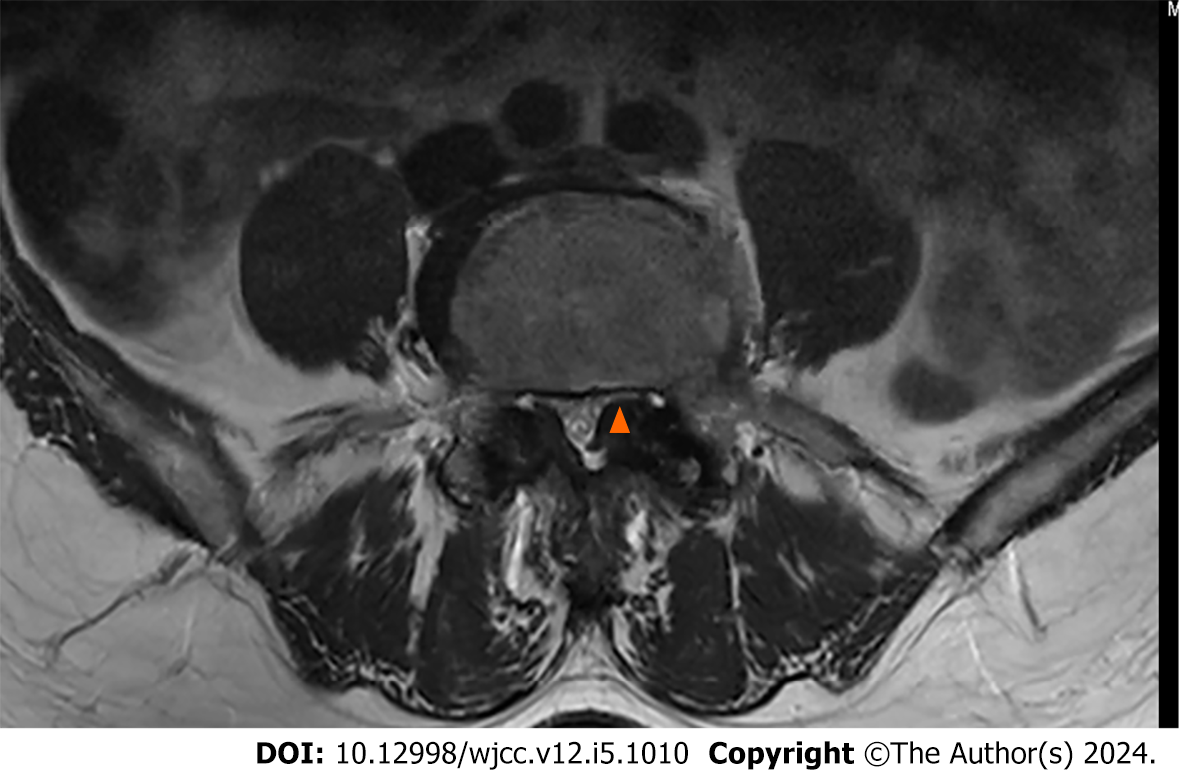
Figure 1 Preoperative magnetic resonance imaging shows lateral recess stenosis at L4–5 (asterisk).
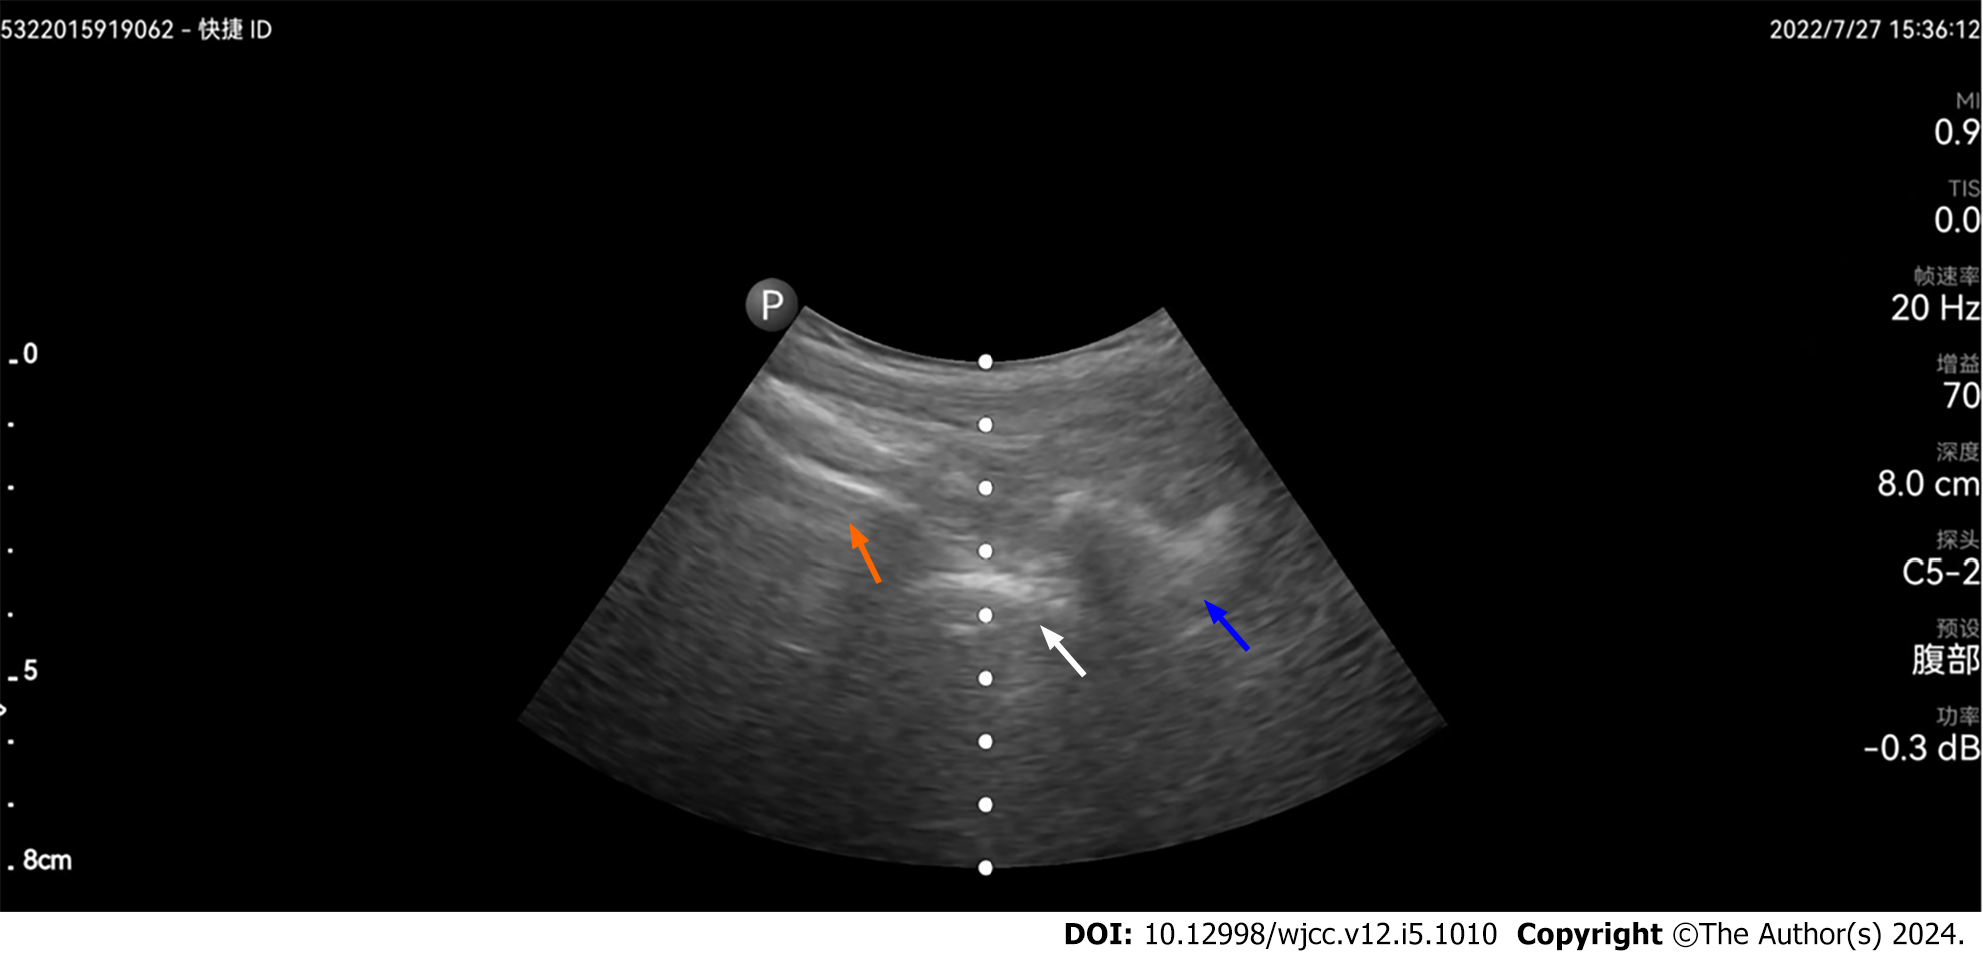
Figure 2 Ultrasound imaging shows the lumbosacral junction at L5–S1 (orange arrow) and the articular process of L5 (white arrow) and L4 (blue arrow) on paramedian sagittal scanning.
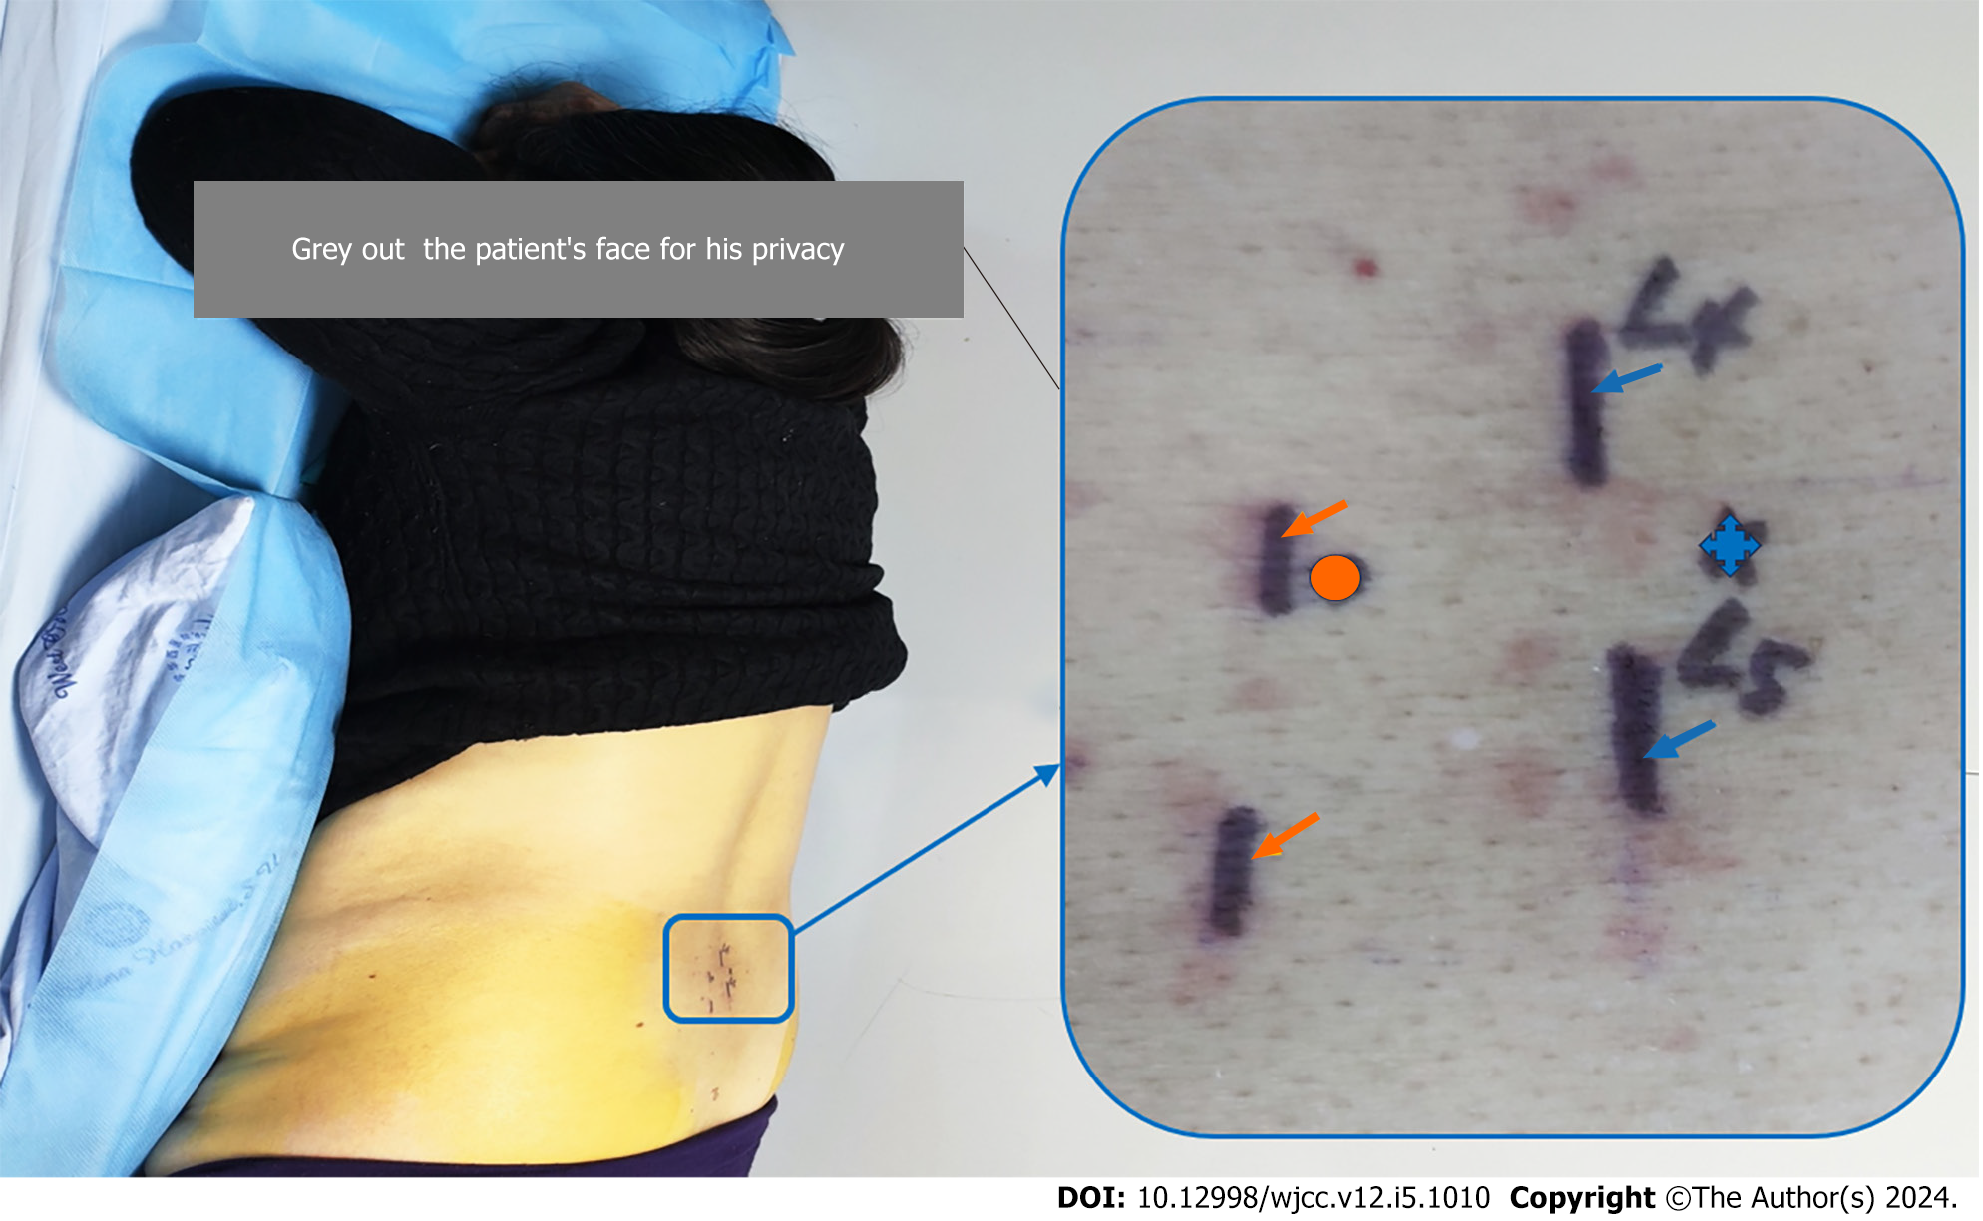
Figure 3 The position of patient on the bed during the procedure and the area of the procedure is marked and zoomed in to show a clearer picture, including spinal process of L4 and L5 (blue arrow), articular process of L4 and L5 (orange arrow), puncture site (blue asterisk) and body surface projection of target site (orange circle).
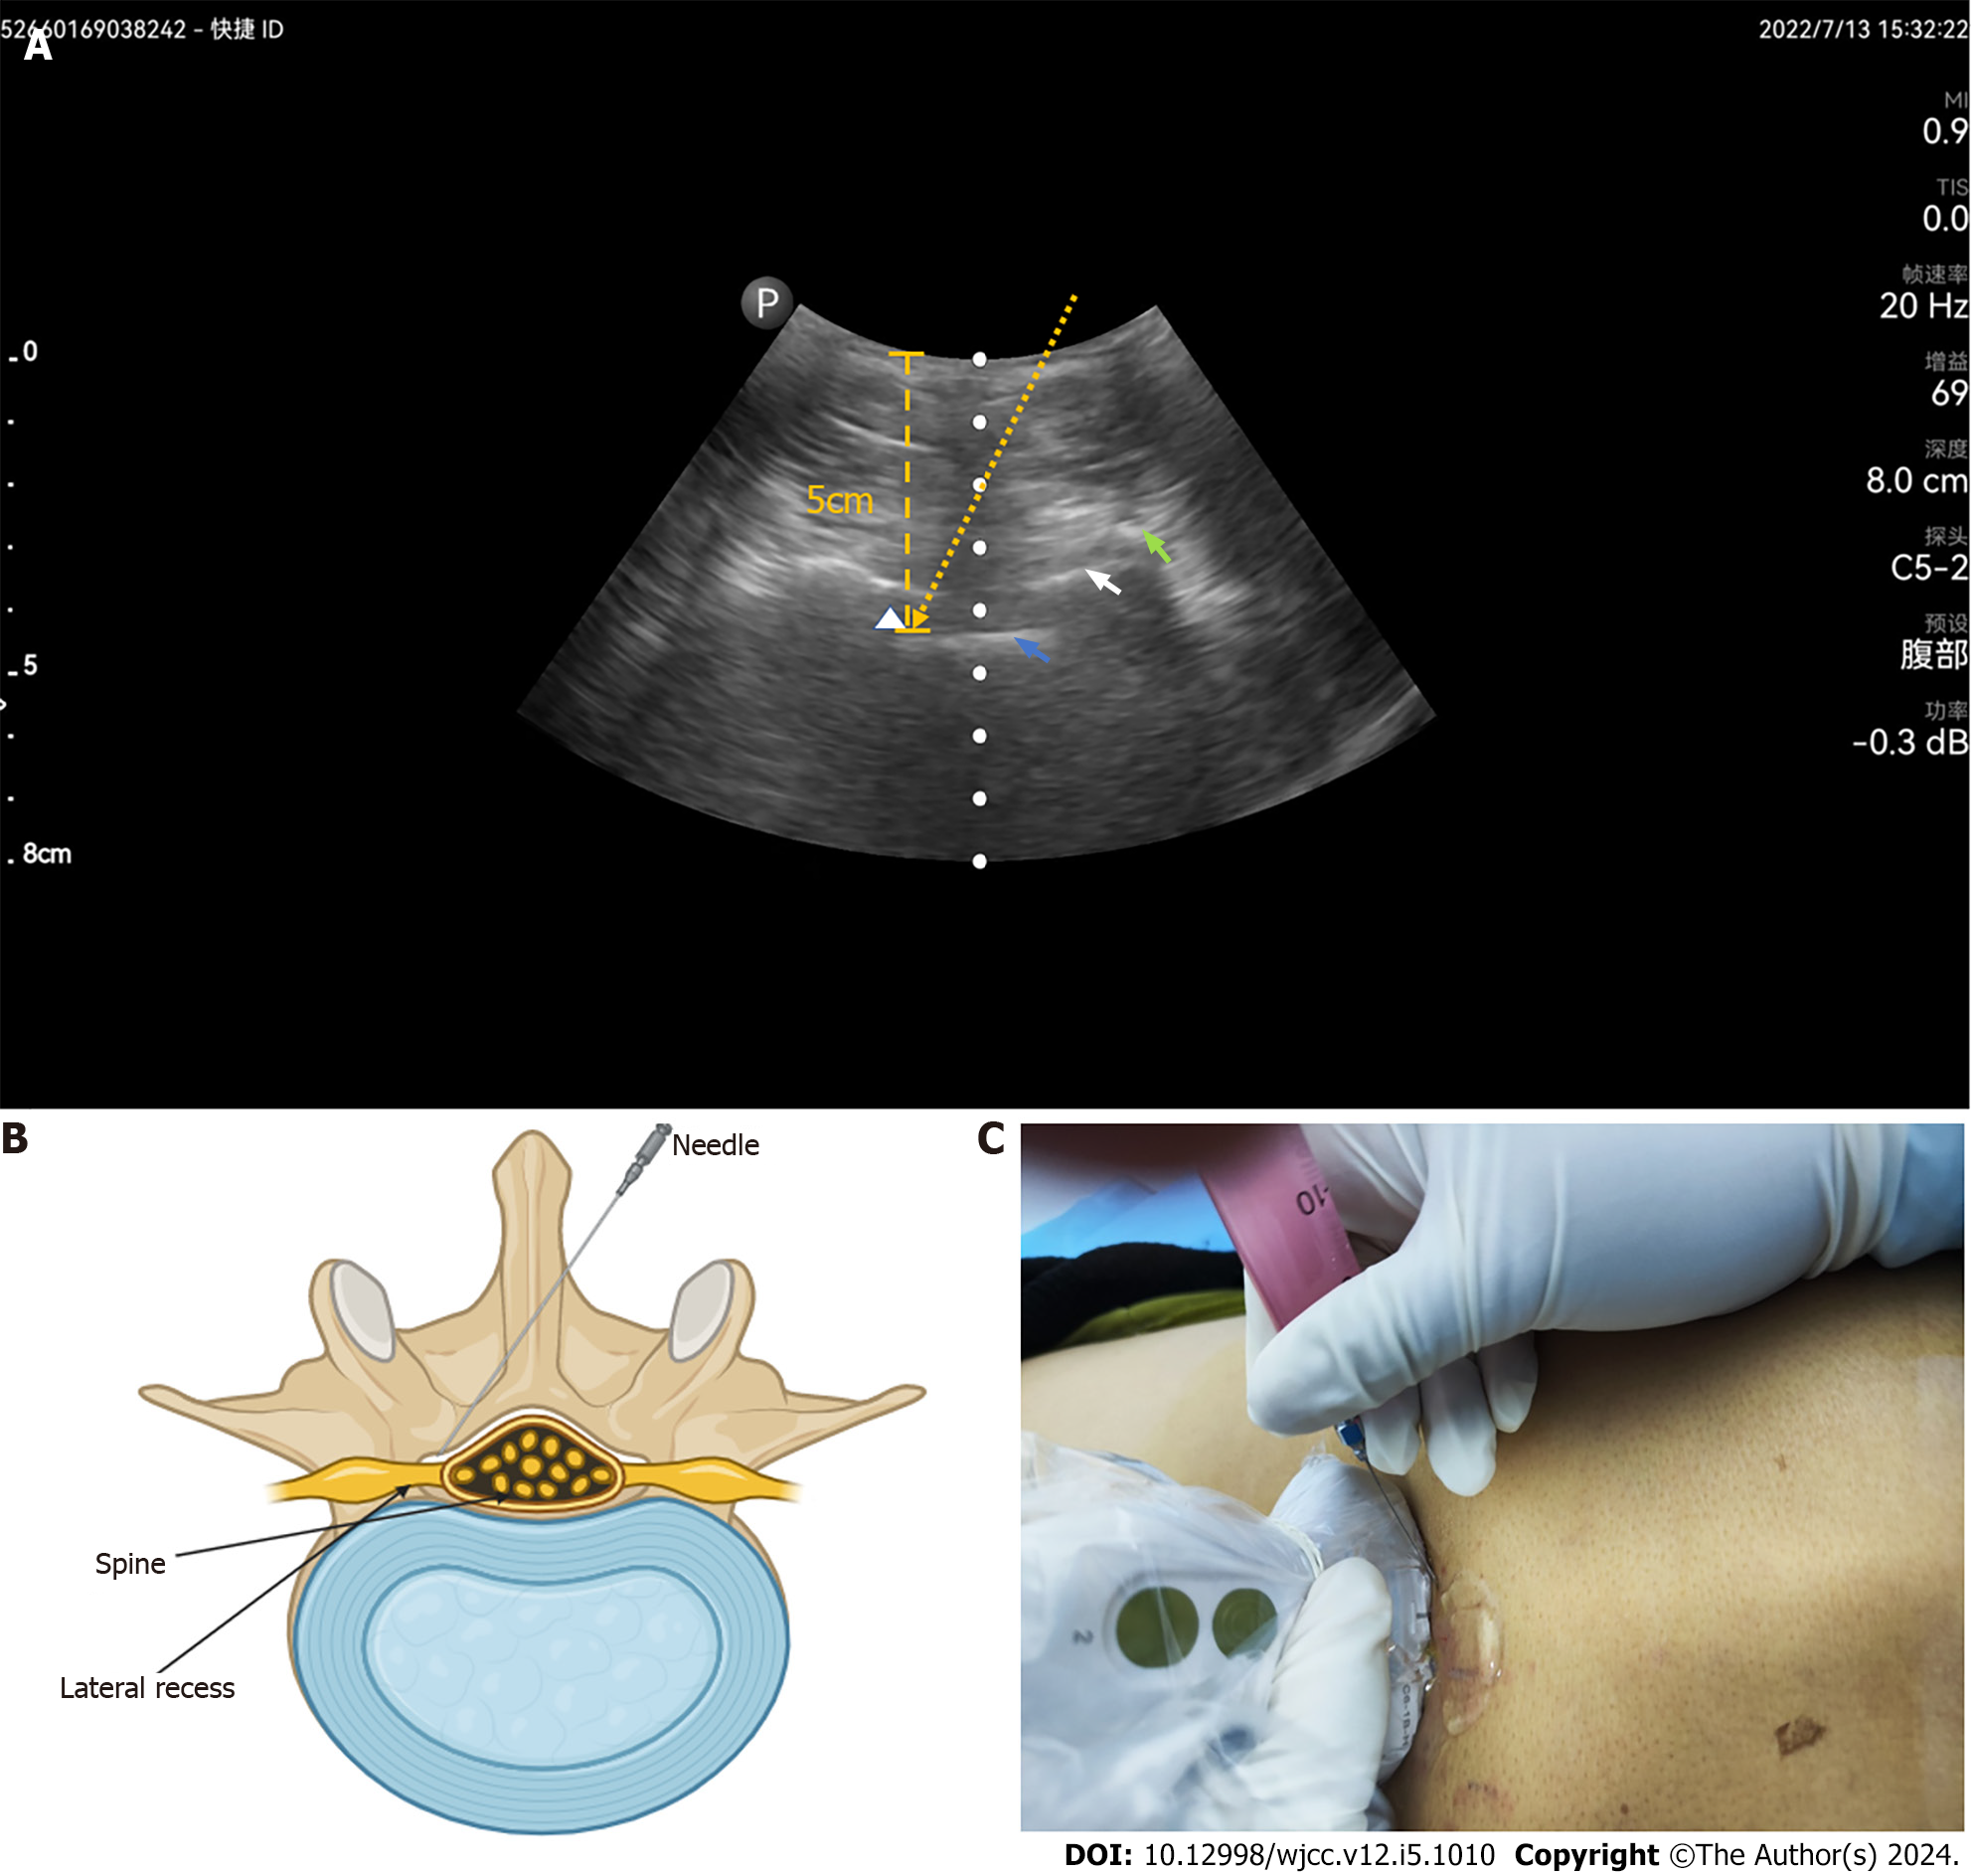
Figure 4 Needle trajectory during lateral recess steroid injection.
A: Ultrasound image of needle trajectory, the lateral recess (white triangle), articular process (cyan arrow), ligamentum flavum (white arrow), and intraspinal anterior complex (blue arrow), needle direction (yellow arrow), depth from the target injection point into the skin (yellow line); B: Diagrammatic explanation of the needle trajectory; C: Picture of the right place of probe position and needle insertion.
- Citation: Yang J, Li XL, Li QB. Novel approach of ultrasound-guided lateral recess block for a patient with lateral recess stenosis: A case report. World J Clin Cases 2024; 12(5): 1010-1017
- URL: https://www.wjgnet.com/2307-8960/full/v12/i5/1010.htm
- DOI: https://dx.doi.org/10.12998/wjcc.v12.i5.1010


