Copyright
©The Author(s) 2024.
World J Clin Cases. Feb 6, 2024; 12(4): 700-720
Published online Feb 6, 2024. doi: 10.12998/wjcc.v12.i4.700
Published online Feb 6, 2024. doi: 10.12998/wjcc.v12.i4.700
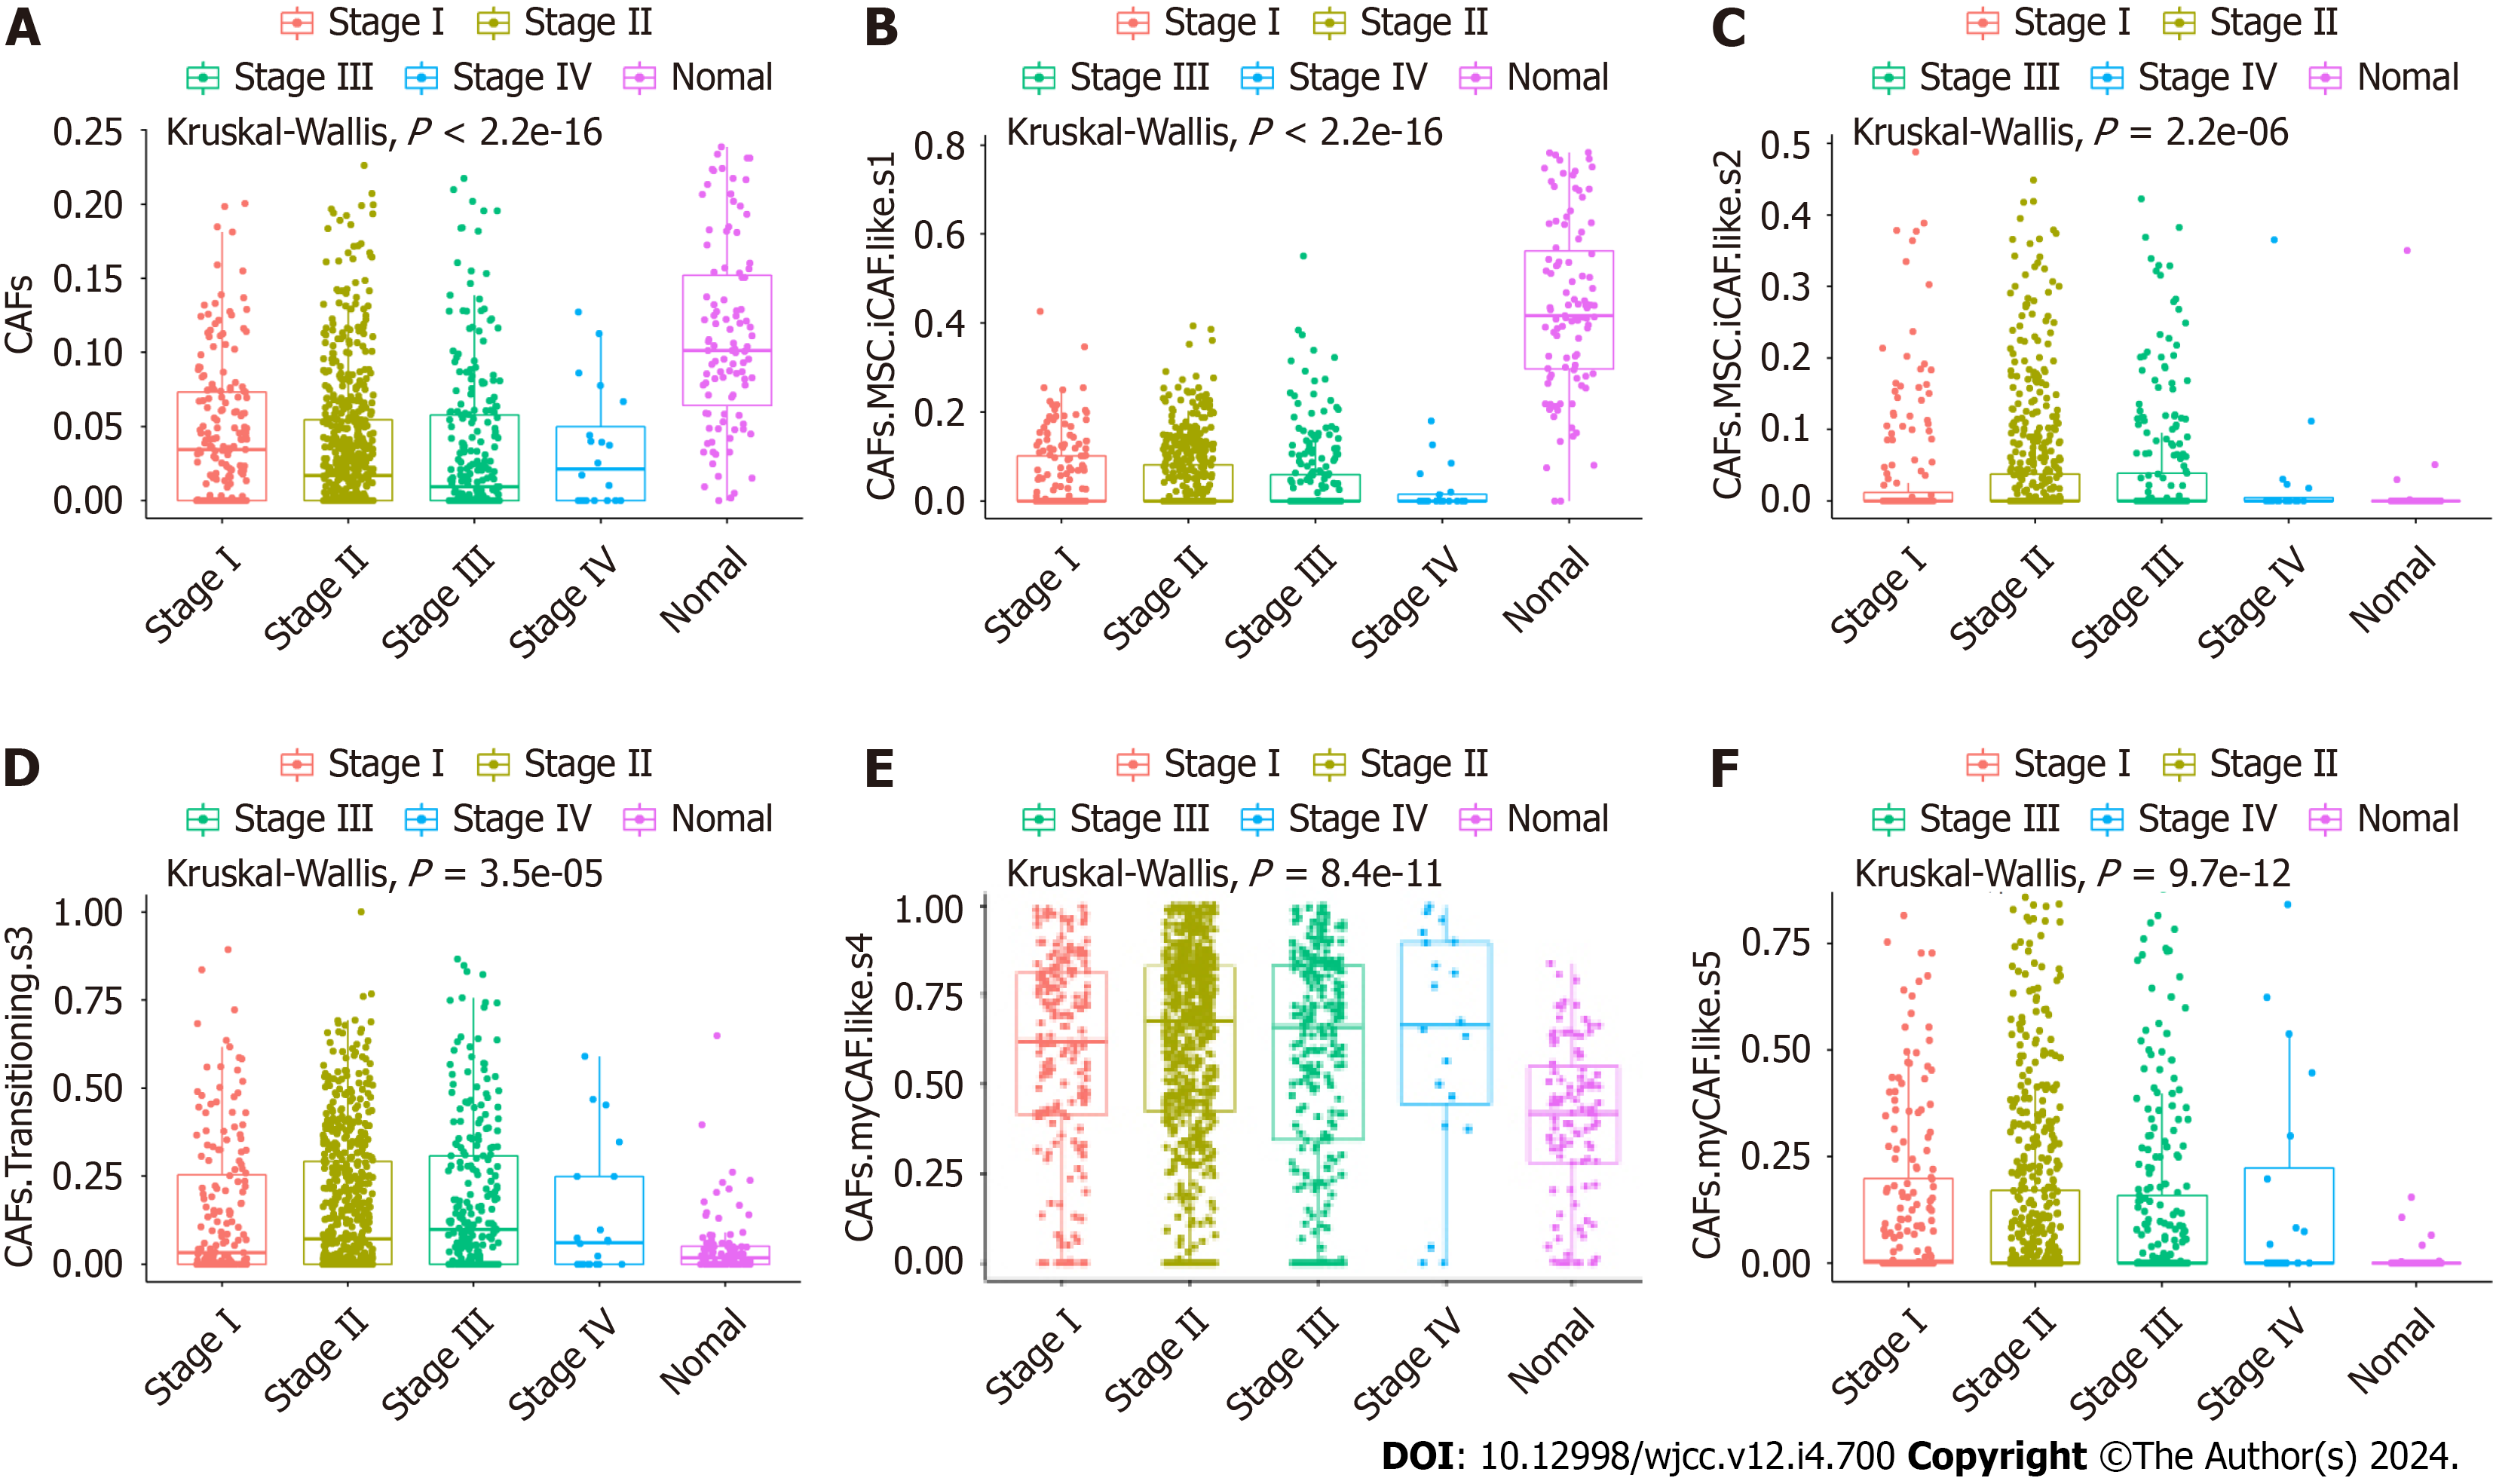
Figure 1 Cell fractions of cancer-associated fibroblasts in different cancer stages and normal tissues.
A: Cancer associated fibroblasts (CAFs); B: CAFs mesenchymal stem cell (MSC) inflammatory CAF (iCAF)-like s1; C: CAFs MSC iCAF-like s2; D: CAF Transitioning s3; E: CAFs myCAF-like s4; F: CAFs myCAF-like s5.
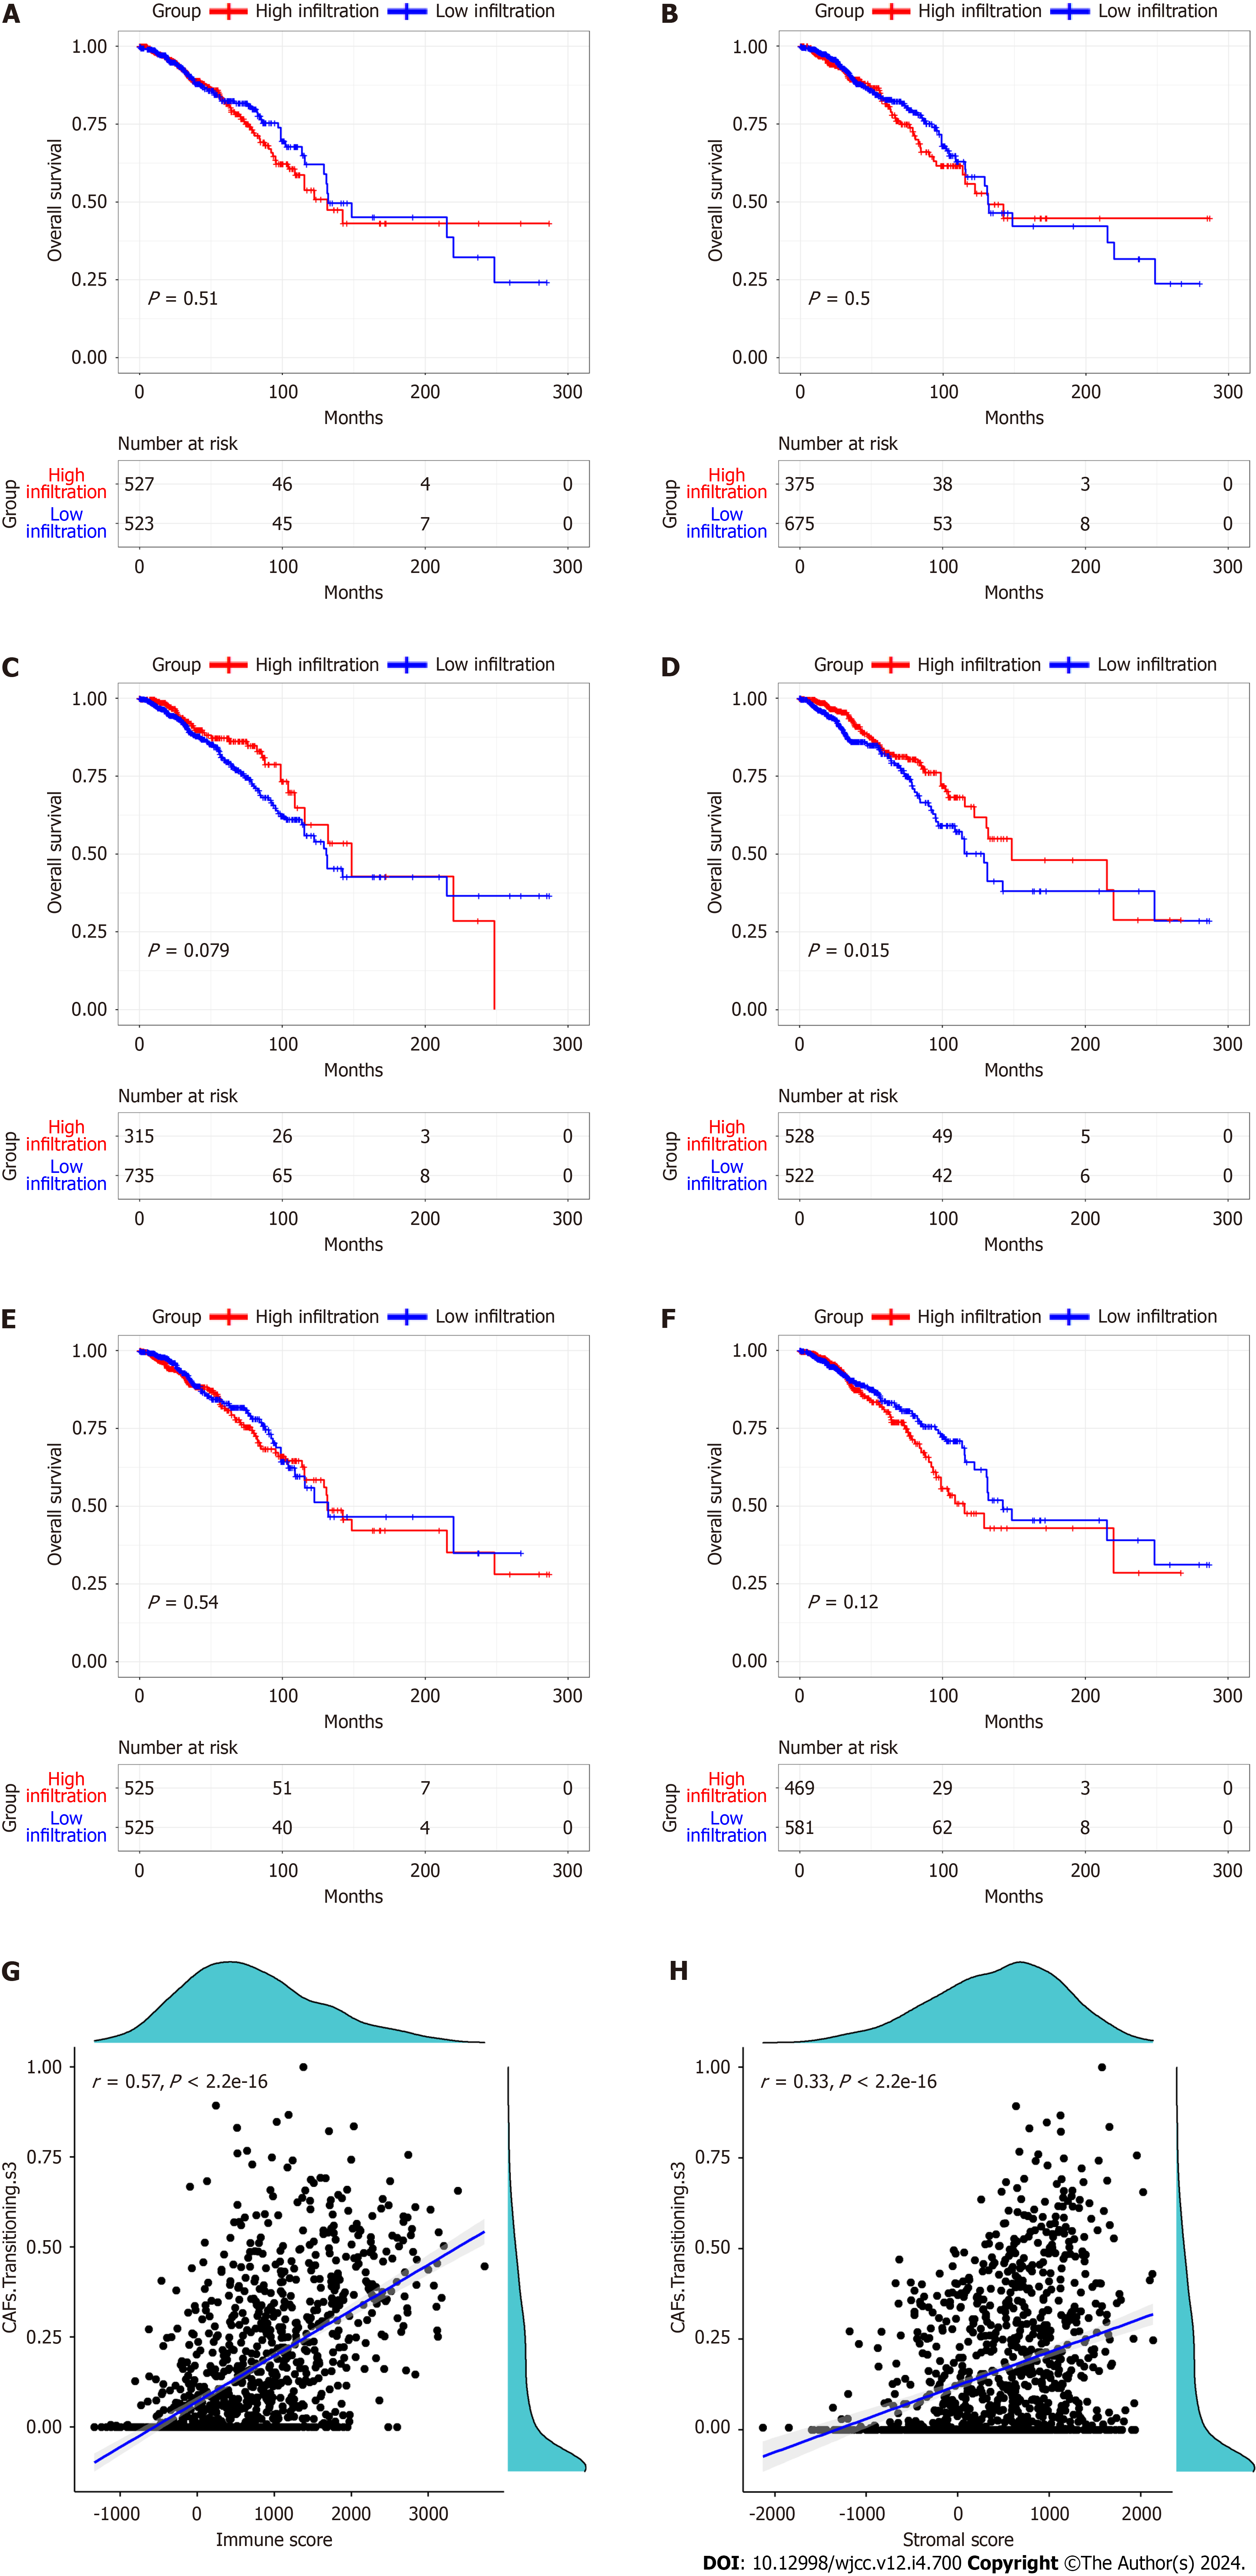
Figure 2 Kaplan-Meier curves of overall survival in relation to cancer associated fibroblasts, and the relationship between the cancer associated fibroblasts transitioning s3 and stromal and immune scores.
A: Cancer associated fibroblasts (CAFs); B: CAFs mesenchymal stem cell (MSC) inflammatory CAF (iCAF)-like s1; C: CAFs MSC iCAF-like s2; D: CAFs Transitioning s3; E: CAFs myCAF like s4; F: CAFs myCAF like s5; G-H: The relationship between the CAFs transitioning s3 and the immune and stromal scores.
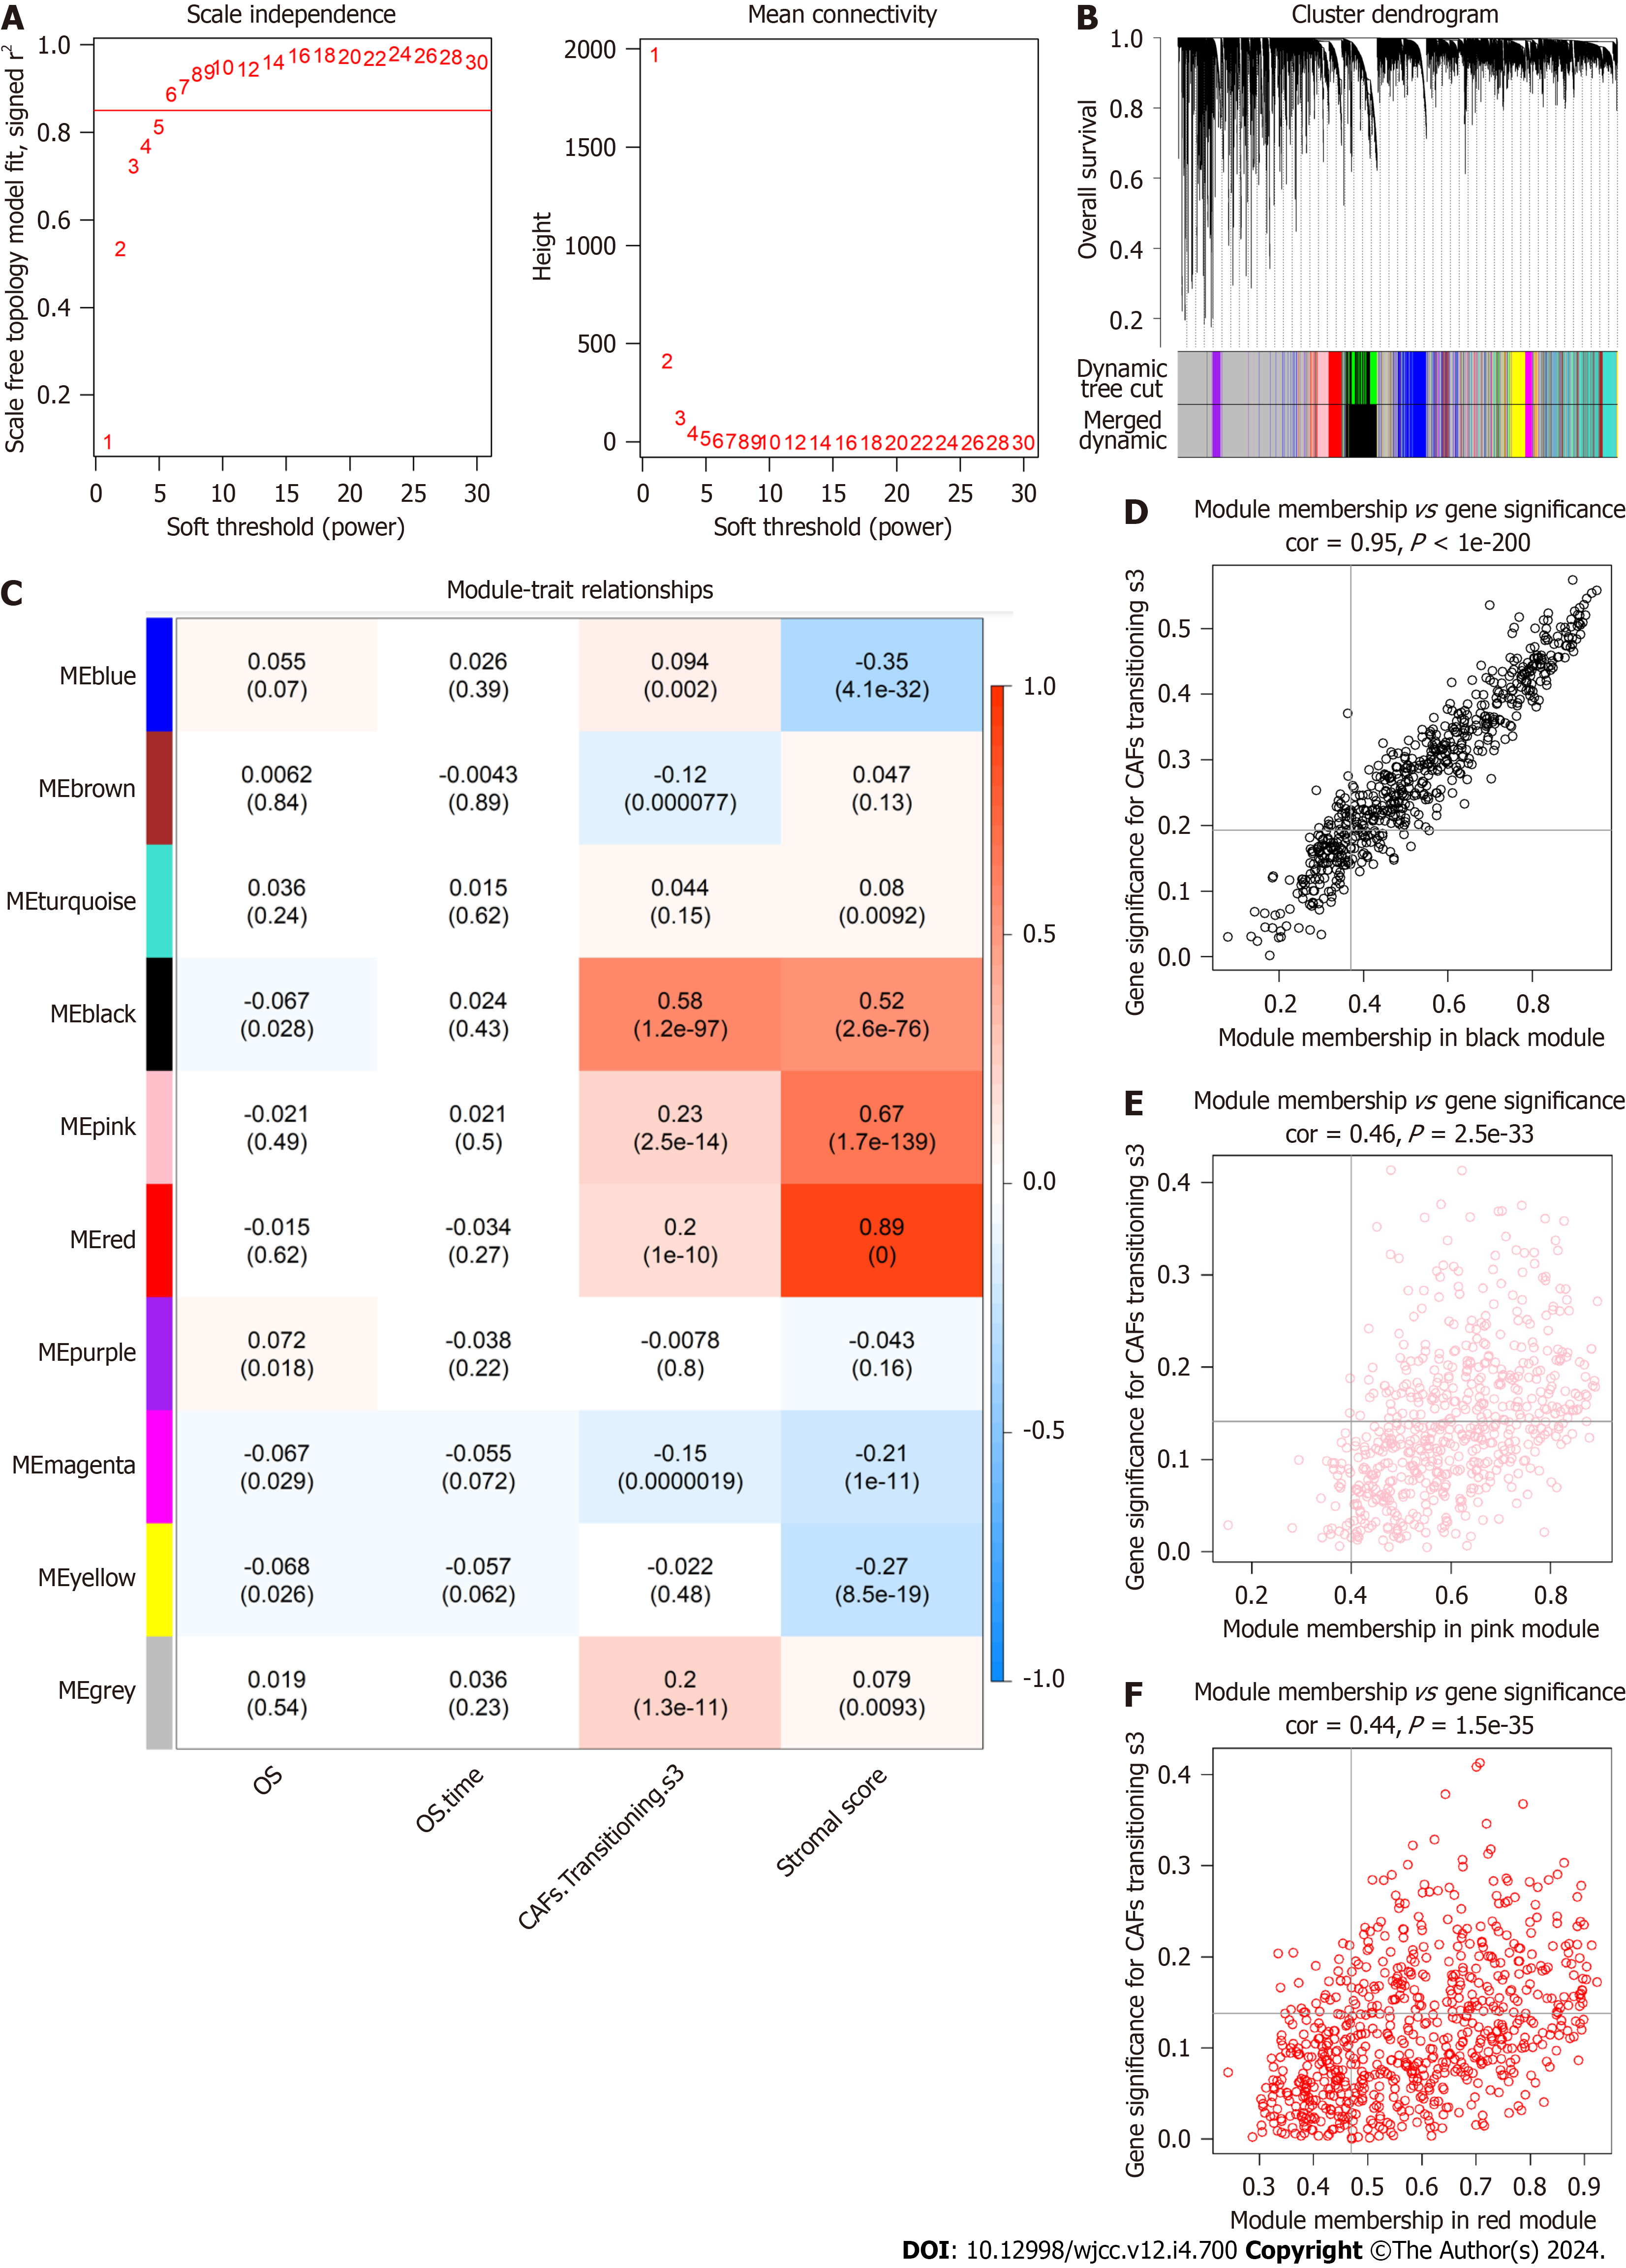
Figure 3 Co-expression pathways generated by weighted gene co-expression network analysis.
A: A soft-thresholding power (β) of 6 was chosen, following the scale-free topology criterion; B: Clustering dendrograms depicting genes with comparable expression signatures were grouped into co-expression modules; C: Module-trait associations illustrating the relationships between individual gene module eigengenes and matching phenotype; D-F: Scatter plots of the module membership and gene significance of individual genes in the black, pink, and red modules.
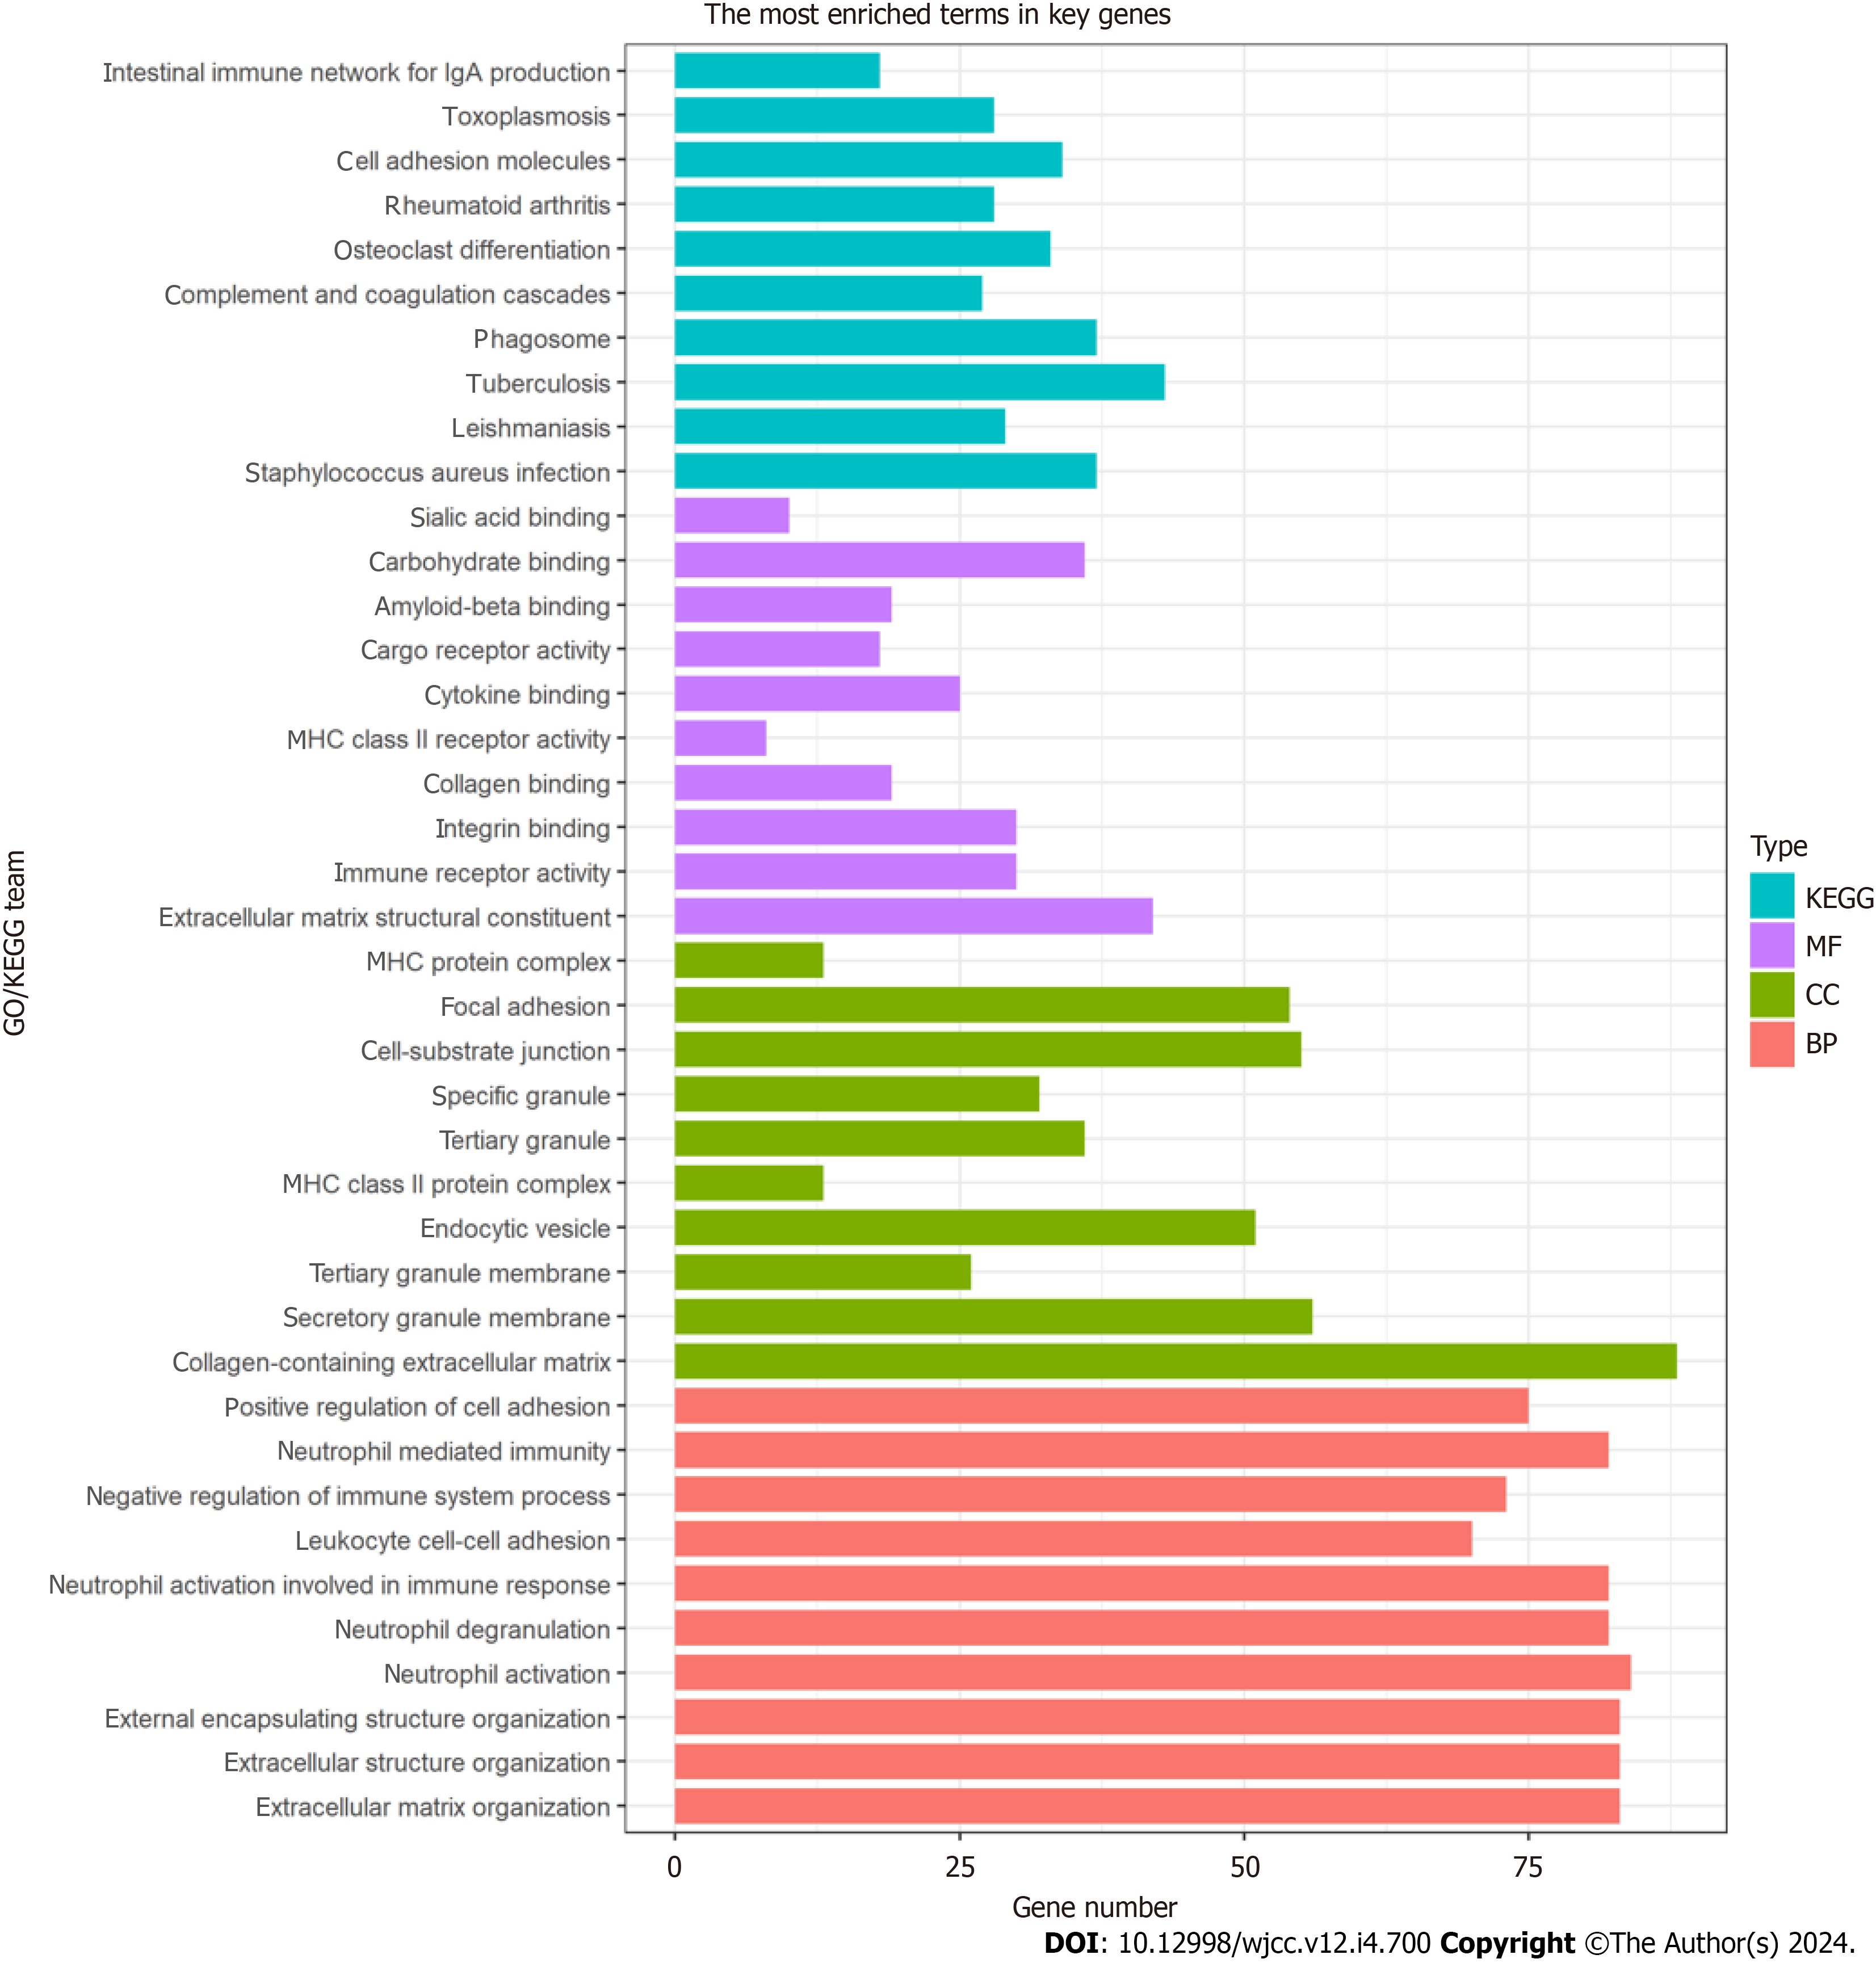
Figure 4 Gene ontology and Kyoto Encyclopedia of Genes and Genomes enrichment analyses.
The gene ontology analysis of enriched biological process, cellular component, and molecular function terms, and the Kyoto Encyclopedia of Genes and Genomes analysis of hub genes. KEGG: Kyoto Encyclopedia of Genes and Genomes; MF: Molecular function; CC: Cellular component; BP: Biological process.
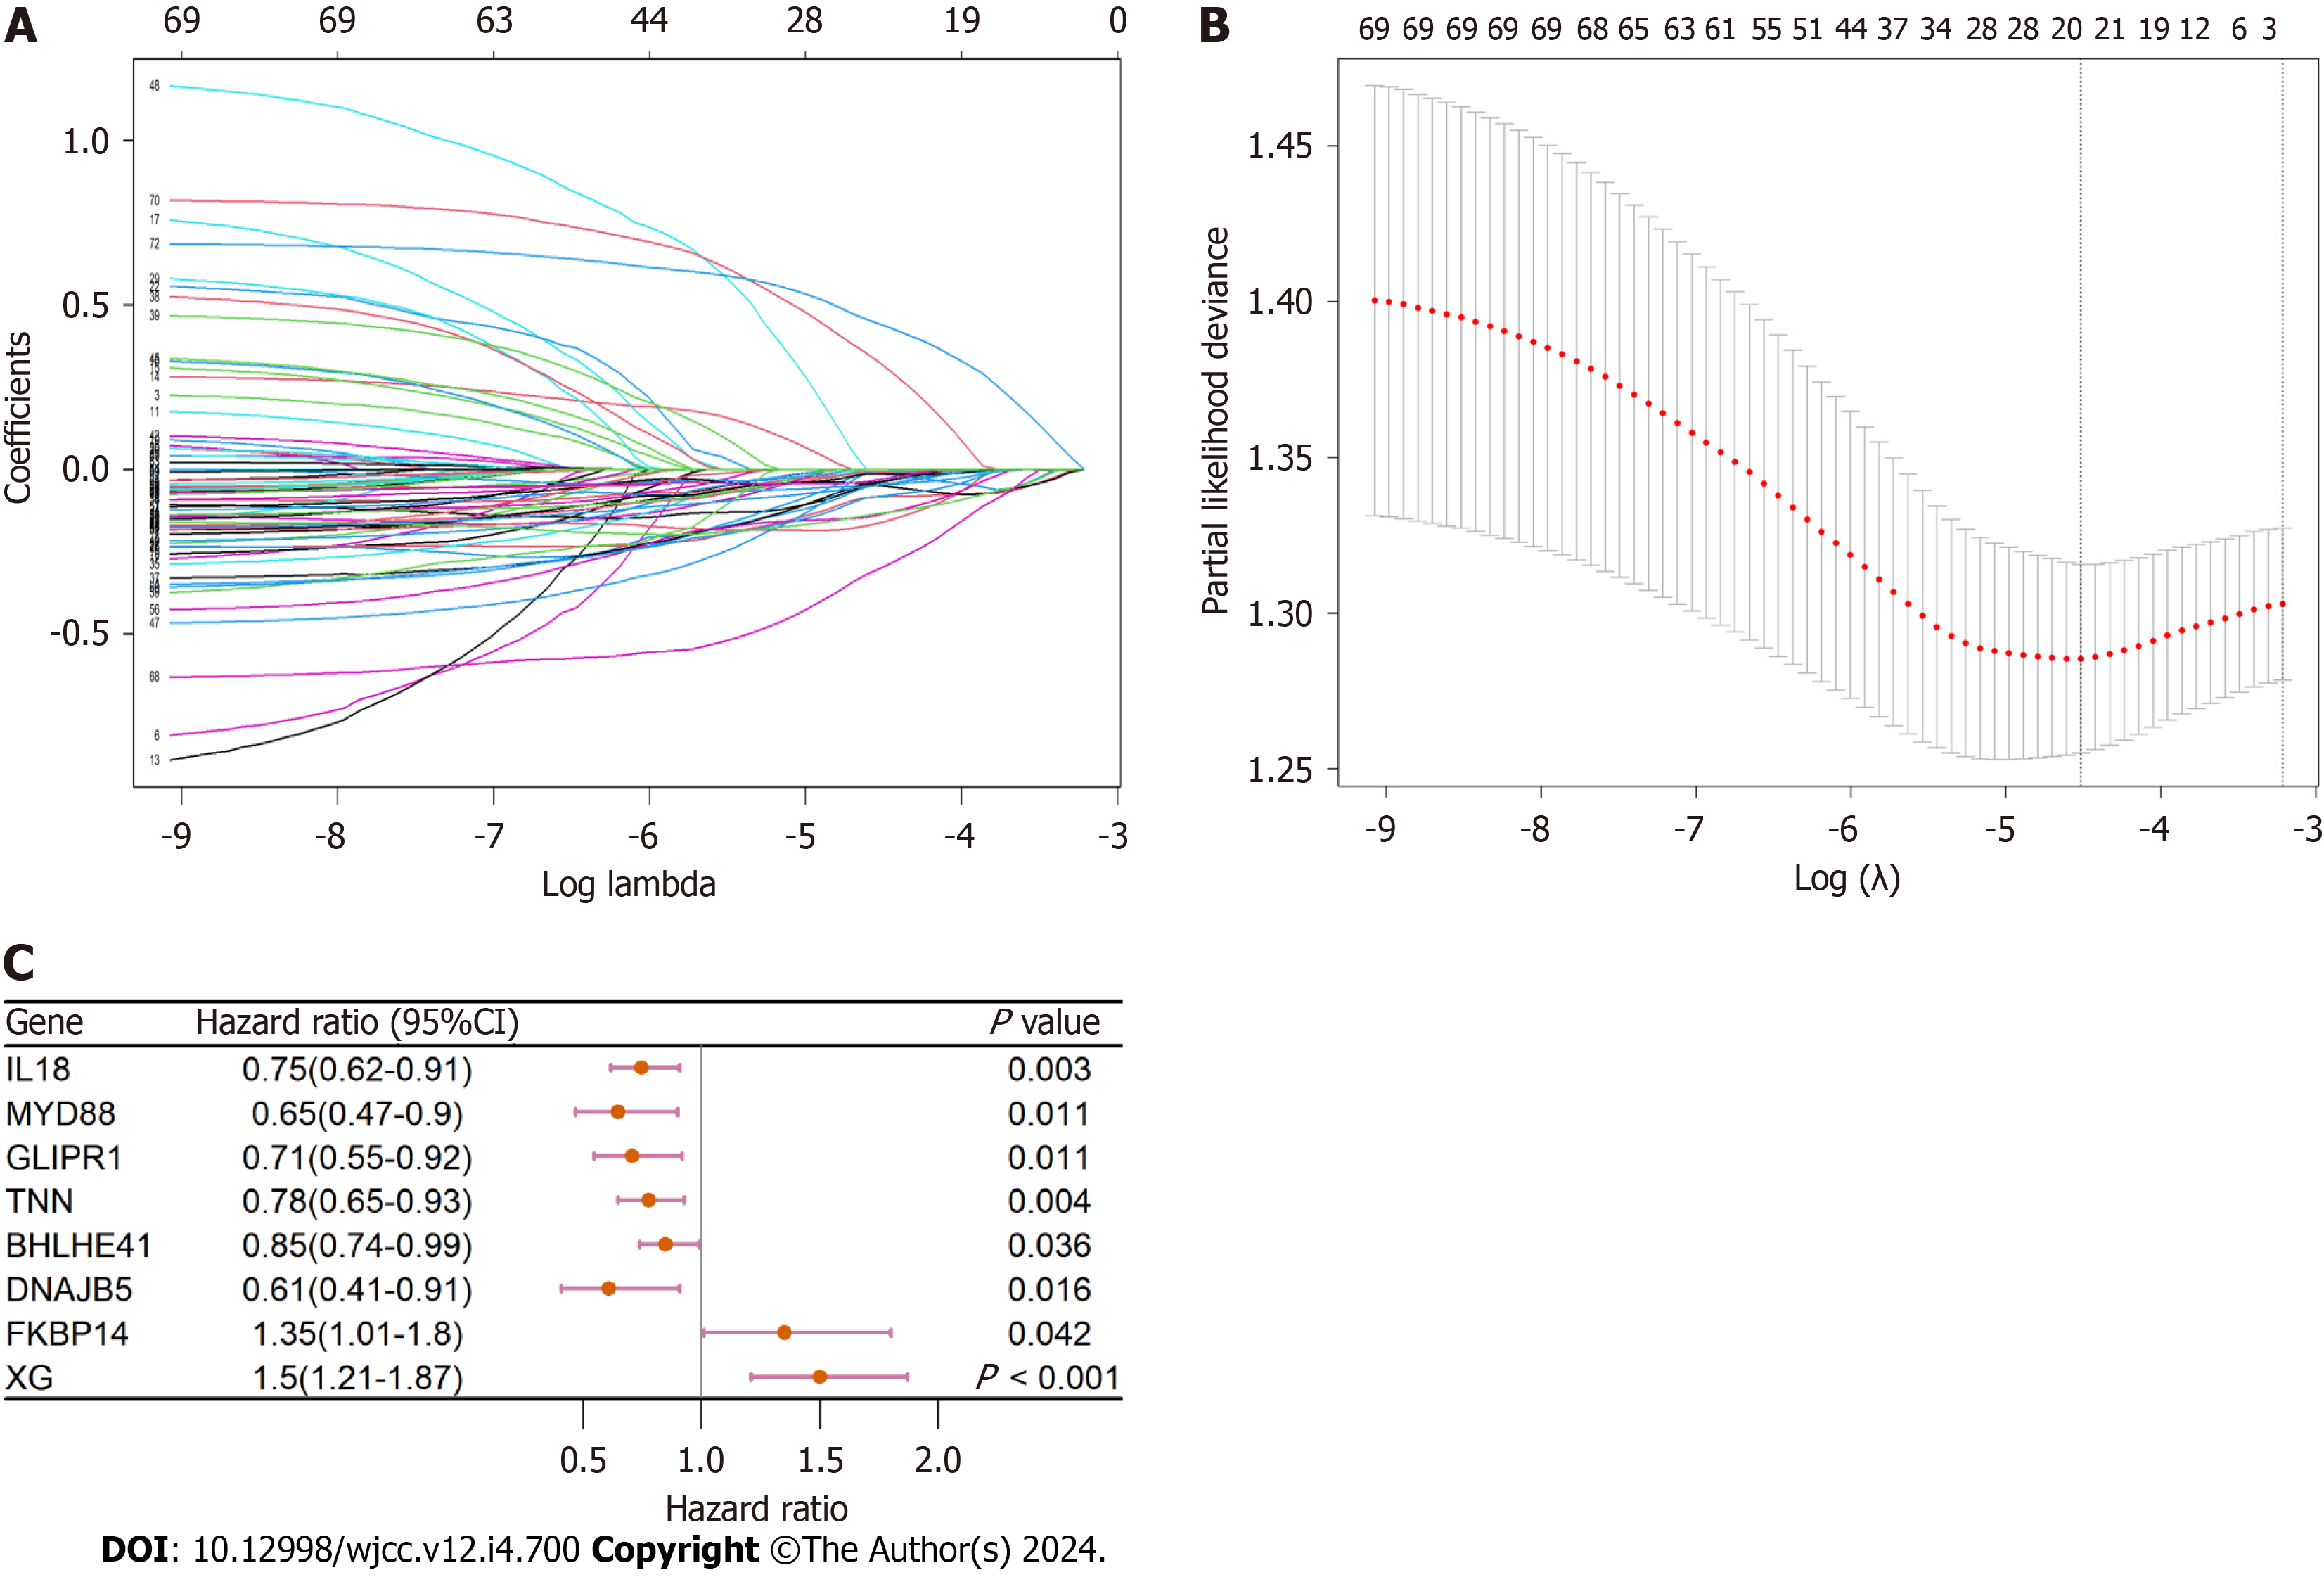
Figure 5 The mechanism of variable selection.
A and B: The performance of least absolute shrinkage and selection operator (LASSO) analysis; C: Forest plot of multivariate analysis for the establishment of the prognostic signature.
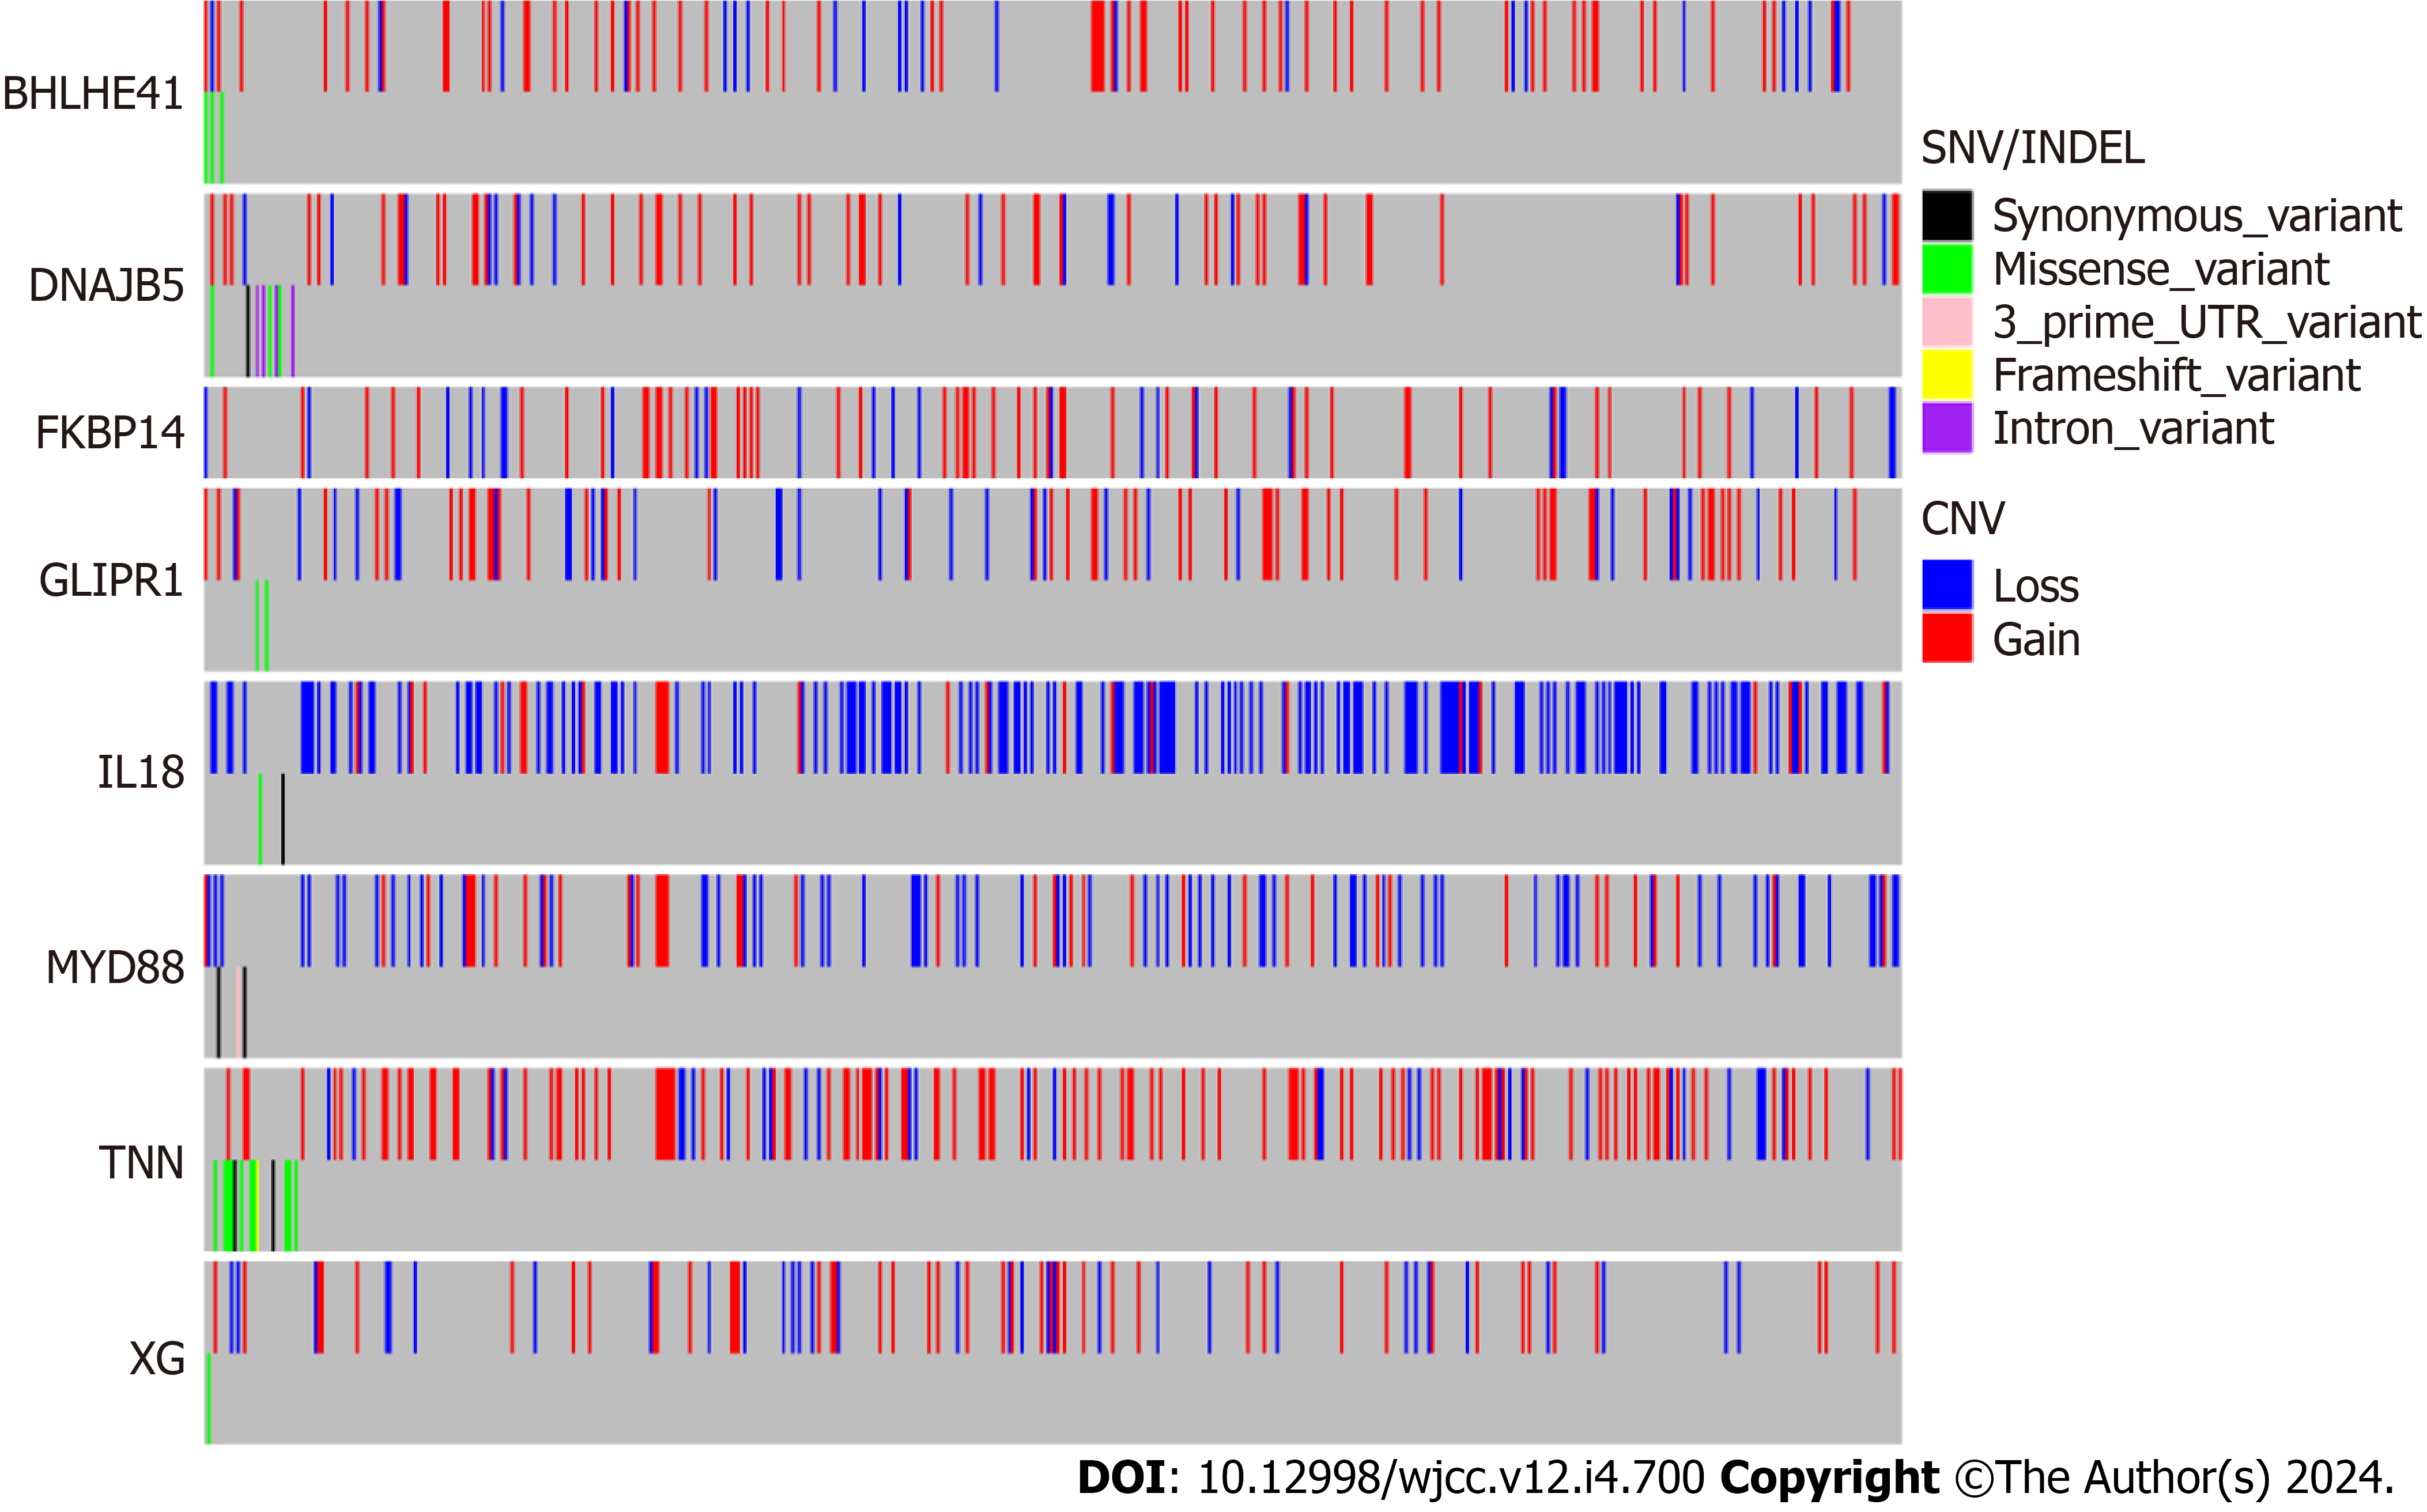
Figure 6 Mutation and copy number alteration analysis of the hub genes.
CAN: Copy number alteration.
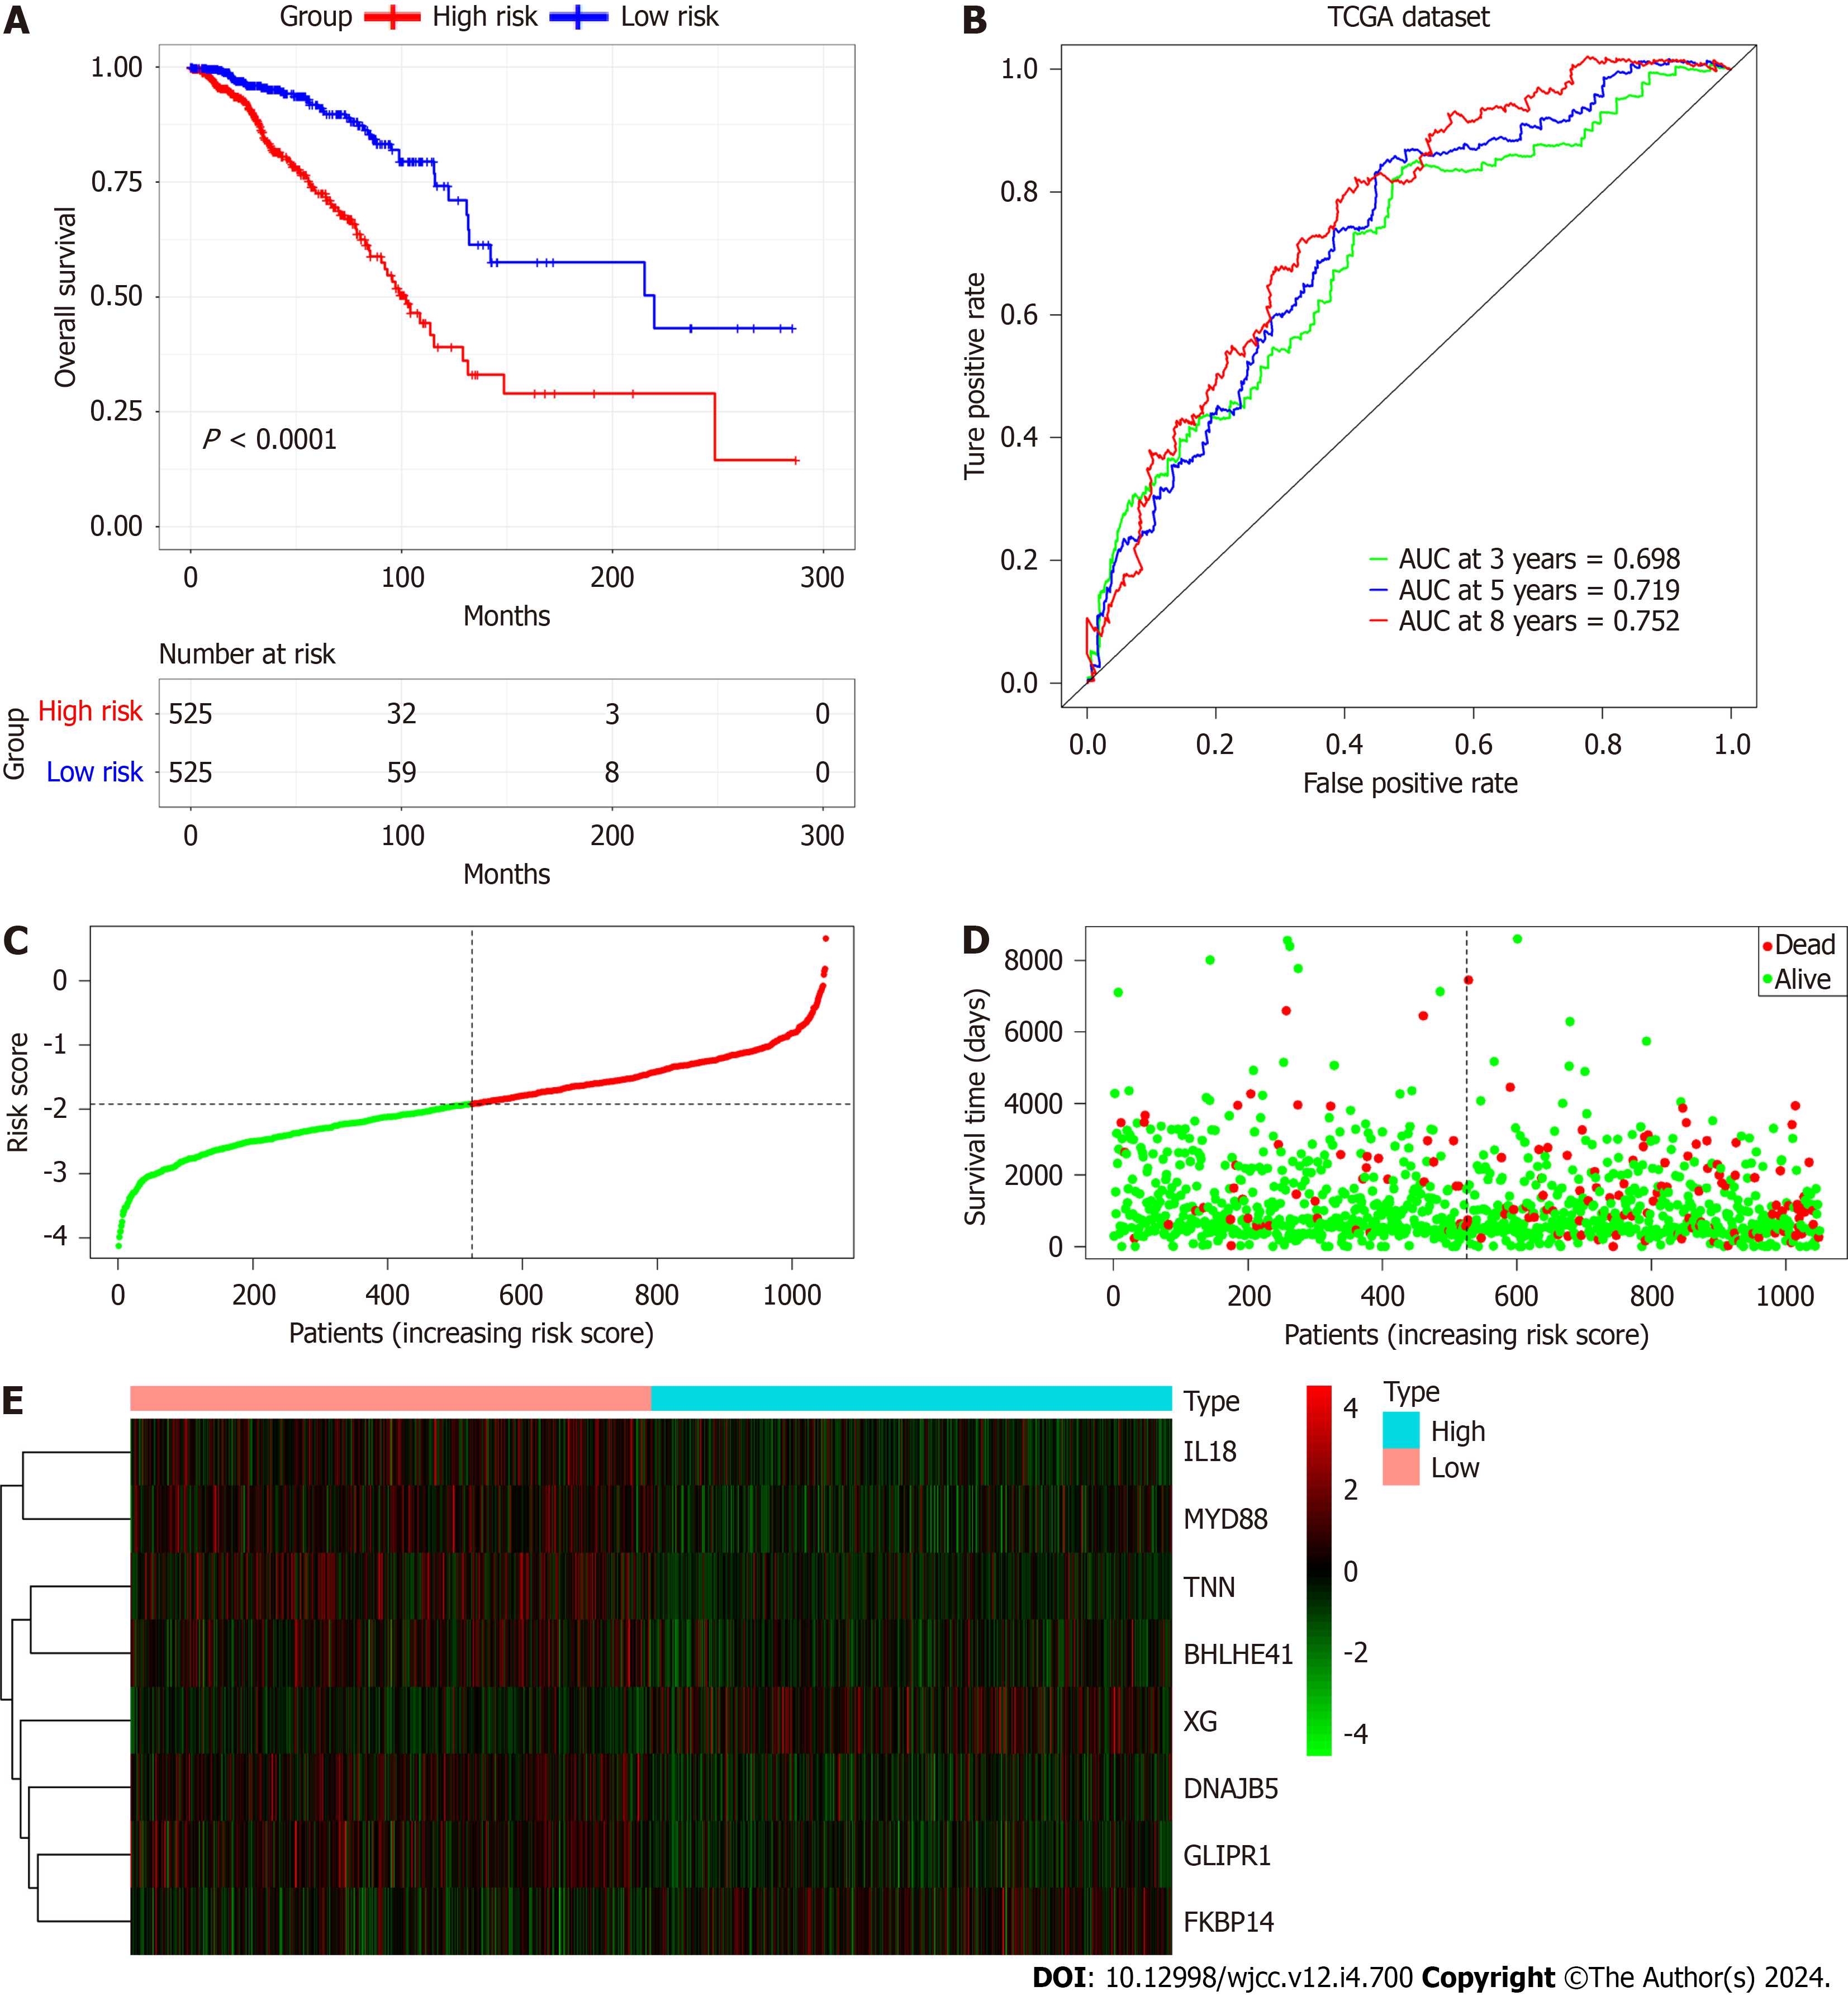
Figure 7 Evaluation of the prognostic signature using the The Cancer Genome Atlas database.
A: Kaplan-Meier plots of overall survival between the high- and low-risk cohorts; B: Time-dependent receiver operating characteristic curve analysis; C: Risk score distribution; D: Survival distribution; E: Expression heatmap of the 8 cancer associated fibroblast-associated risk genes.
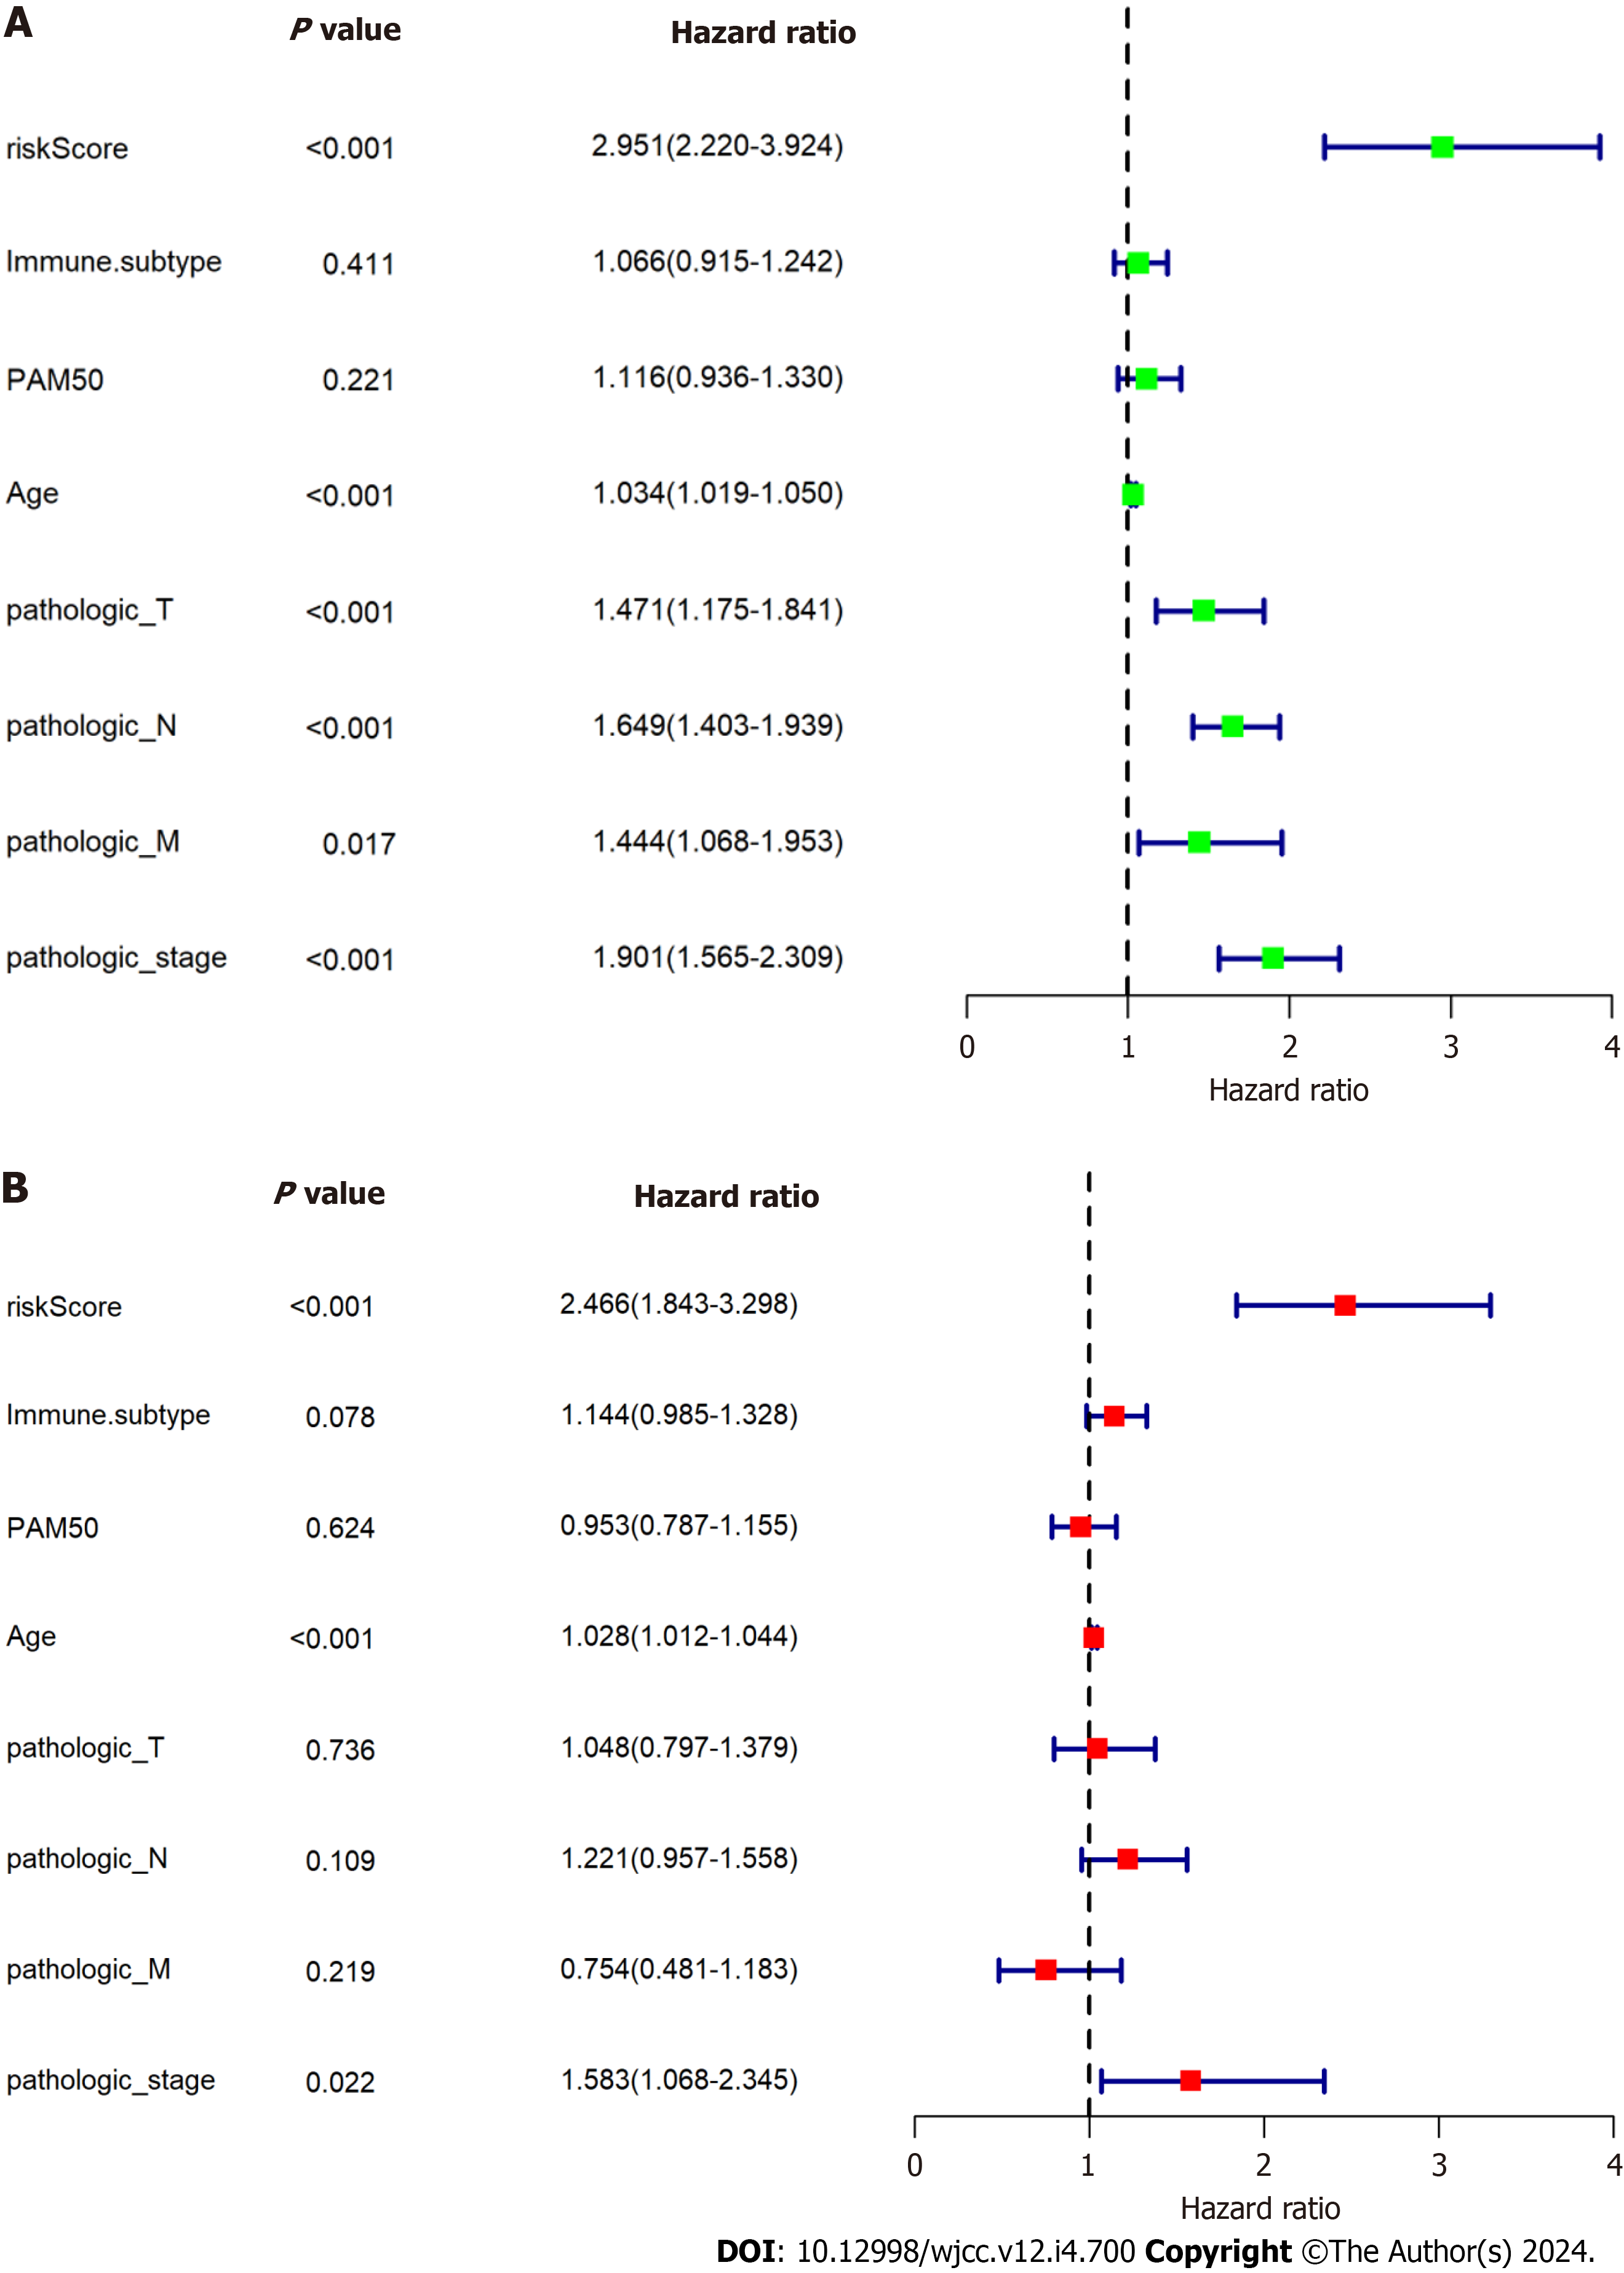
Figure 8 Assessment of the independent prognostic value of the prognostic signature using the The Cancer Genome Atlas database.
A: Univariate analyses of the signature and clinical features; B: Multivariate analyses of the signature and clinical features.
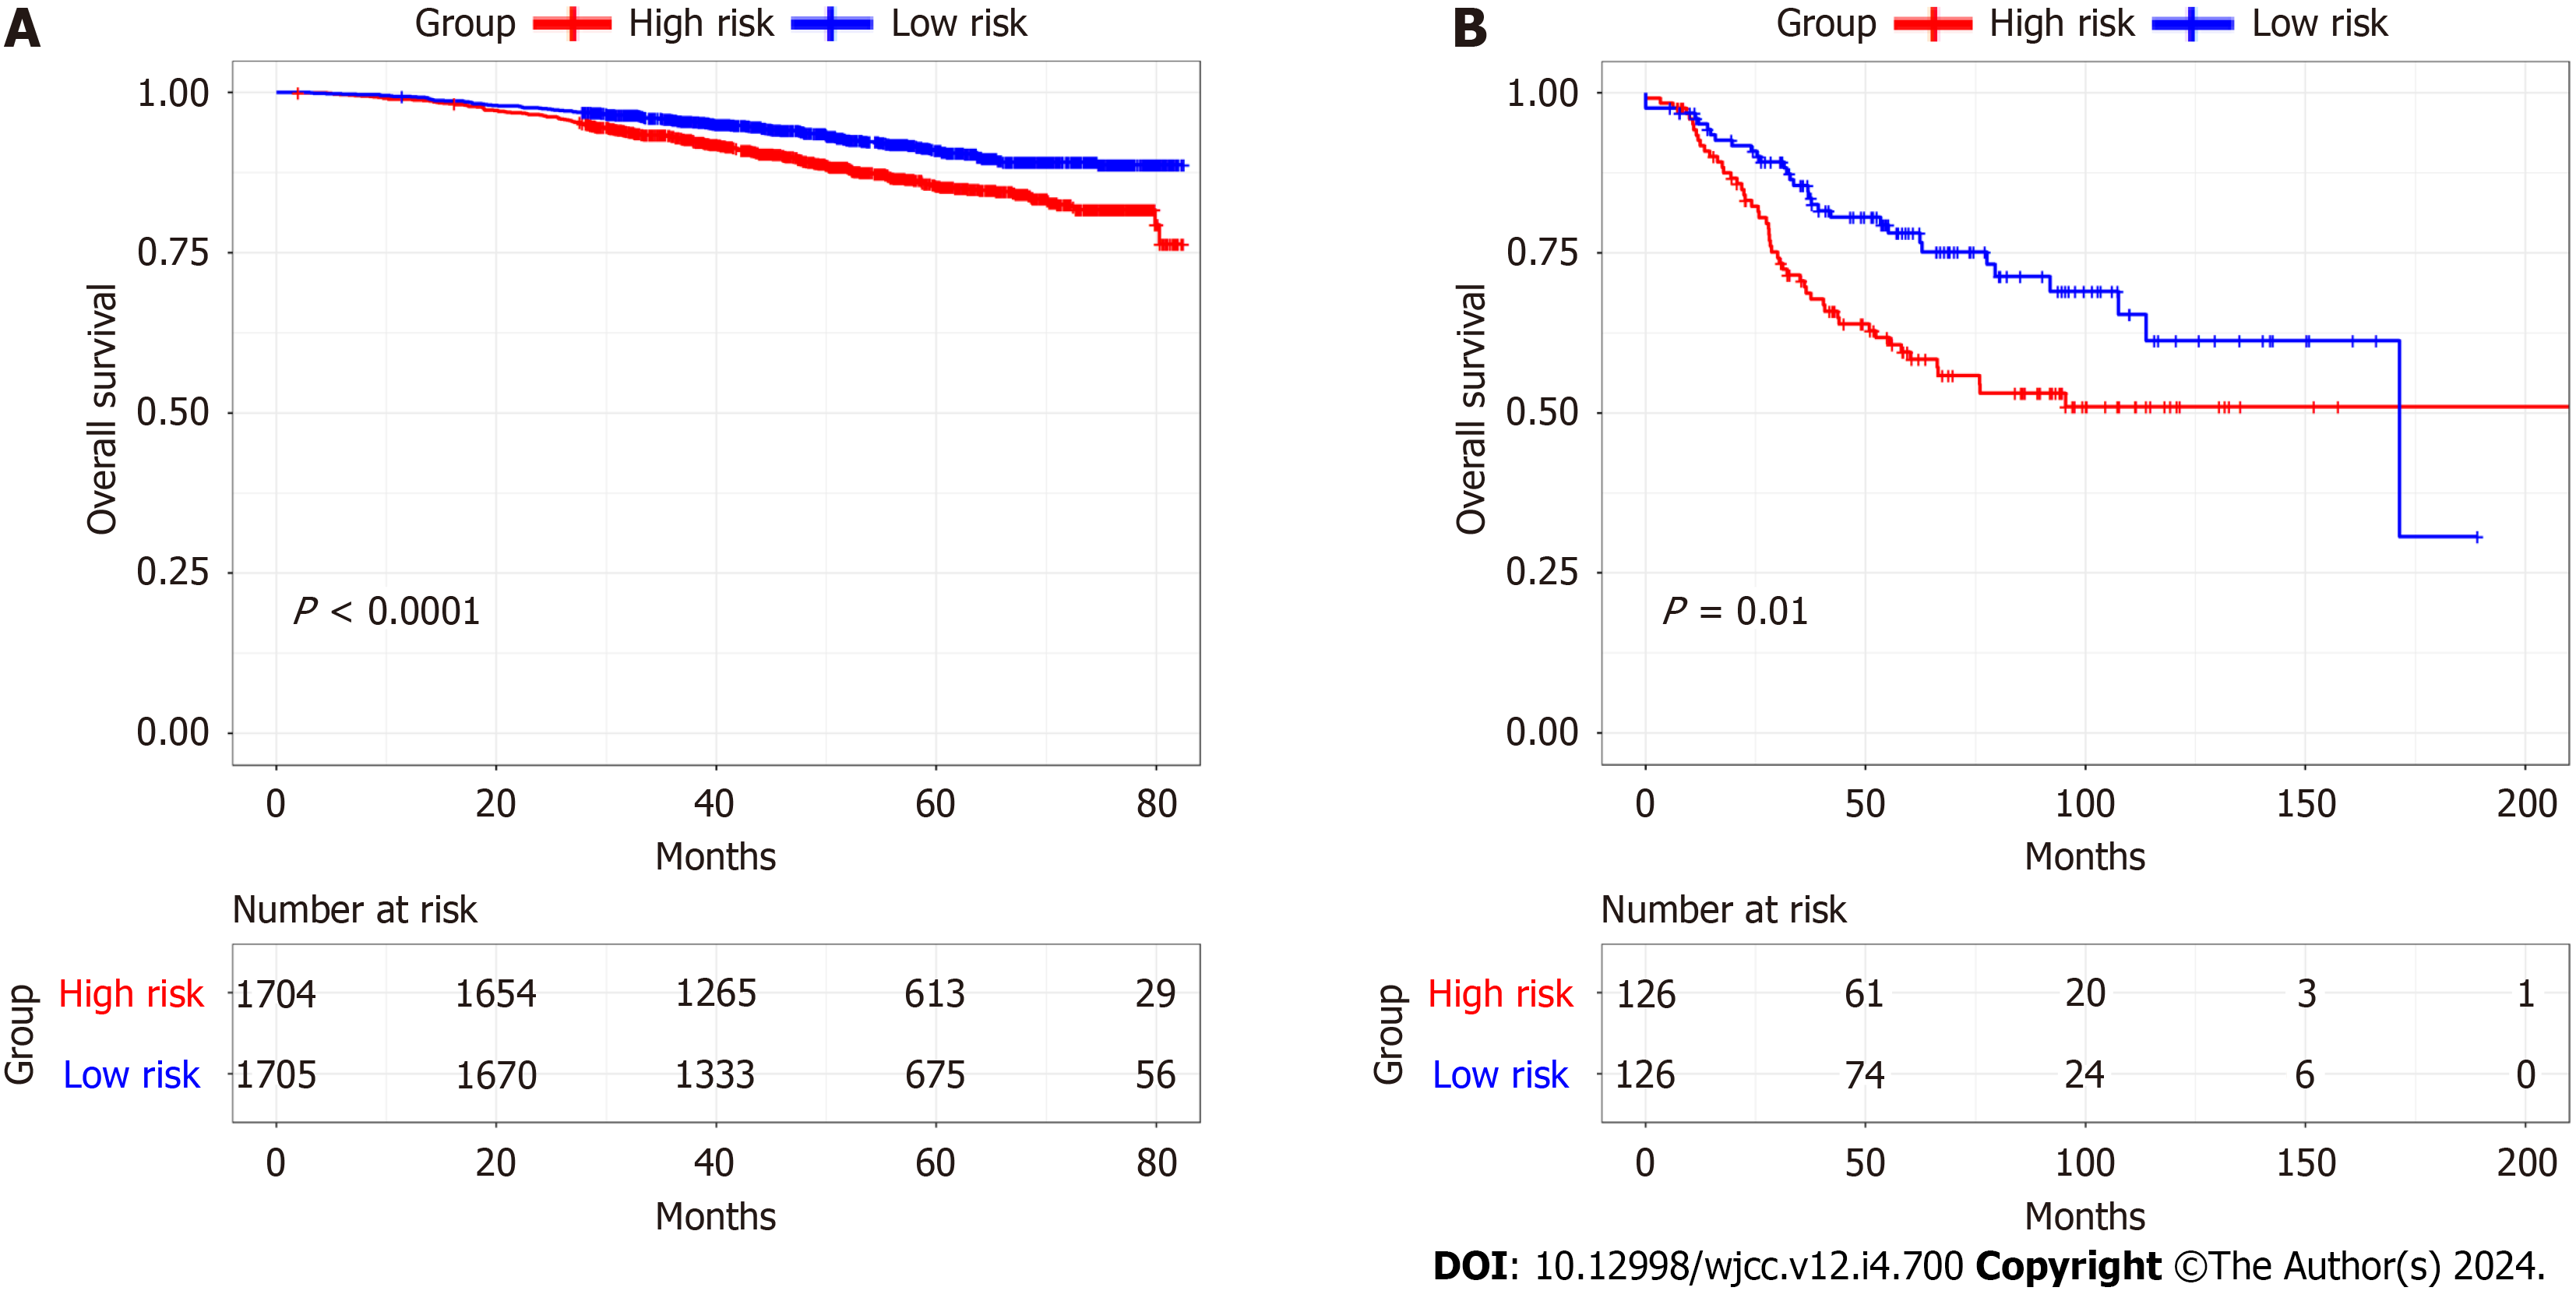
Figure 9 Validation of the prognostic signature.
A: Kaplan-Meier plots of overall survival of high- and low-risk cohorts in the GSE96058 database; B: Kaplan-Meier plots of overall survival of high- and low-risk cohorts in the GSE21653 database.
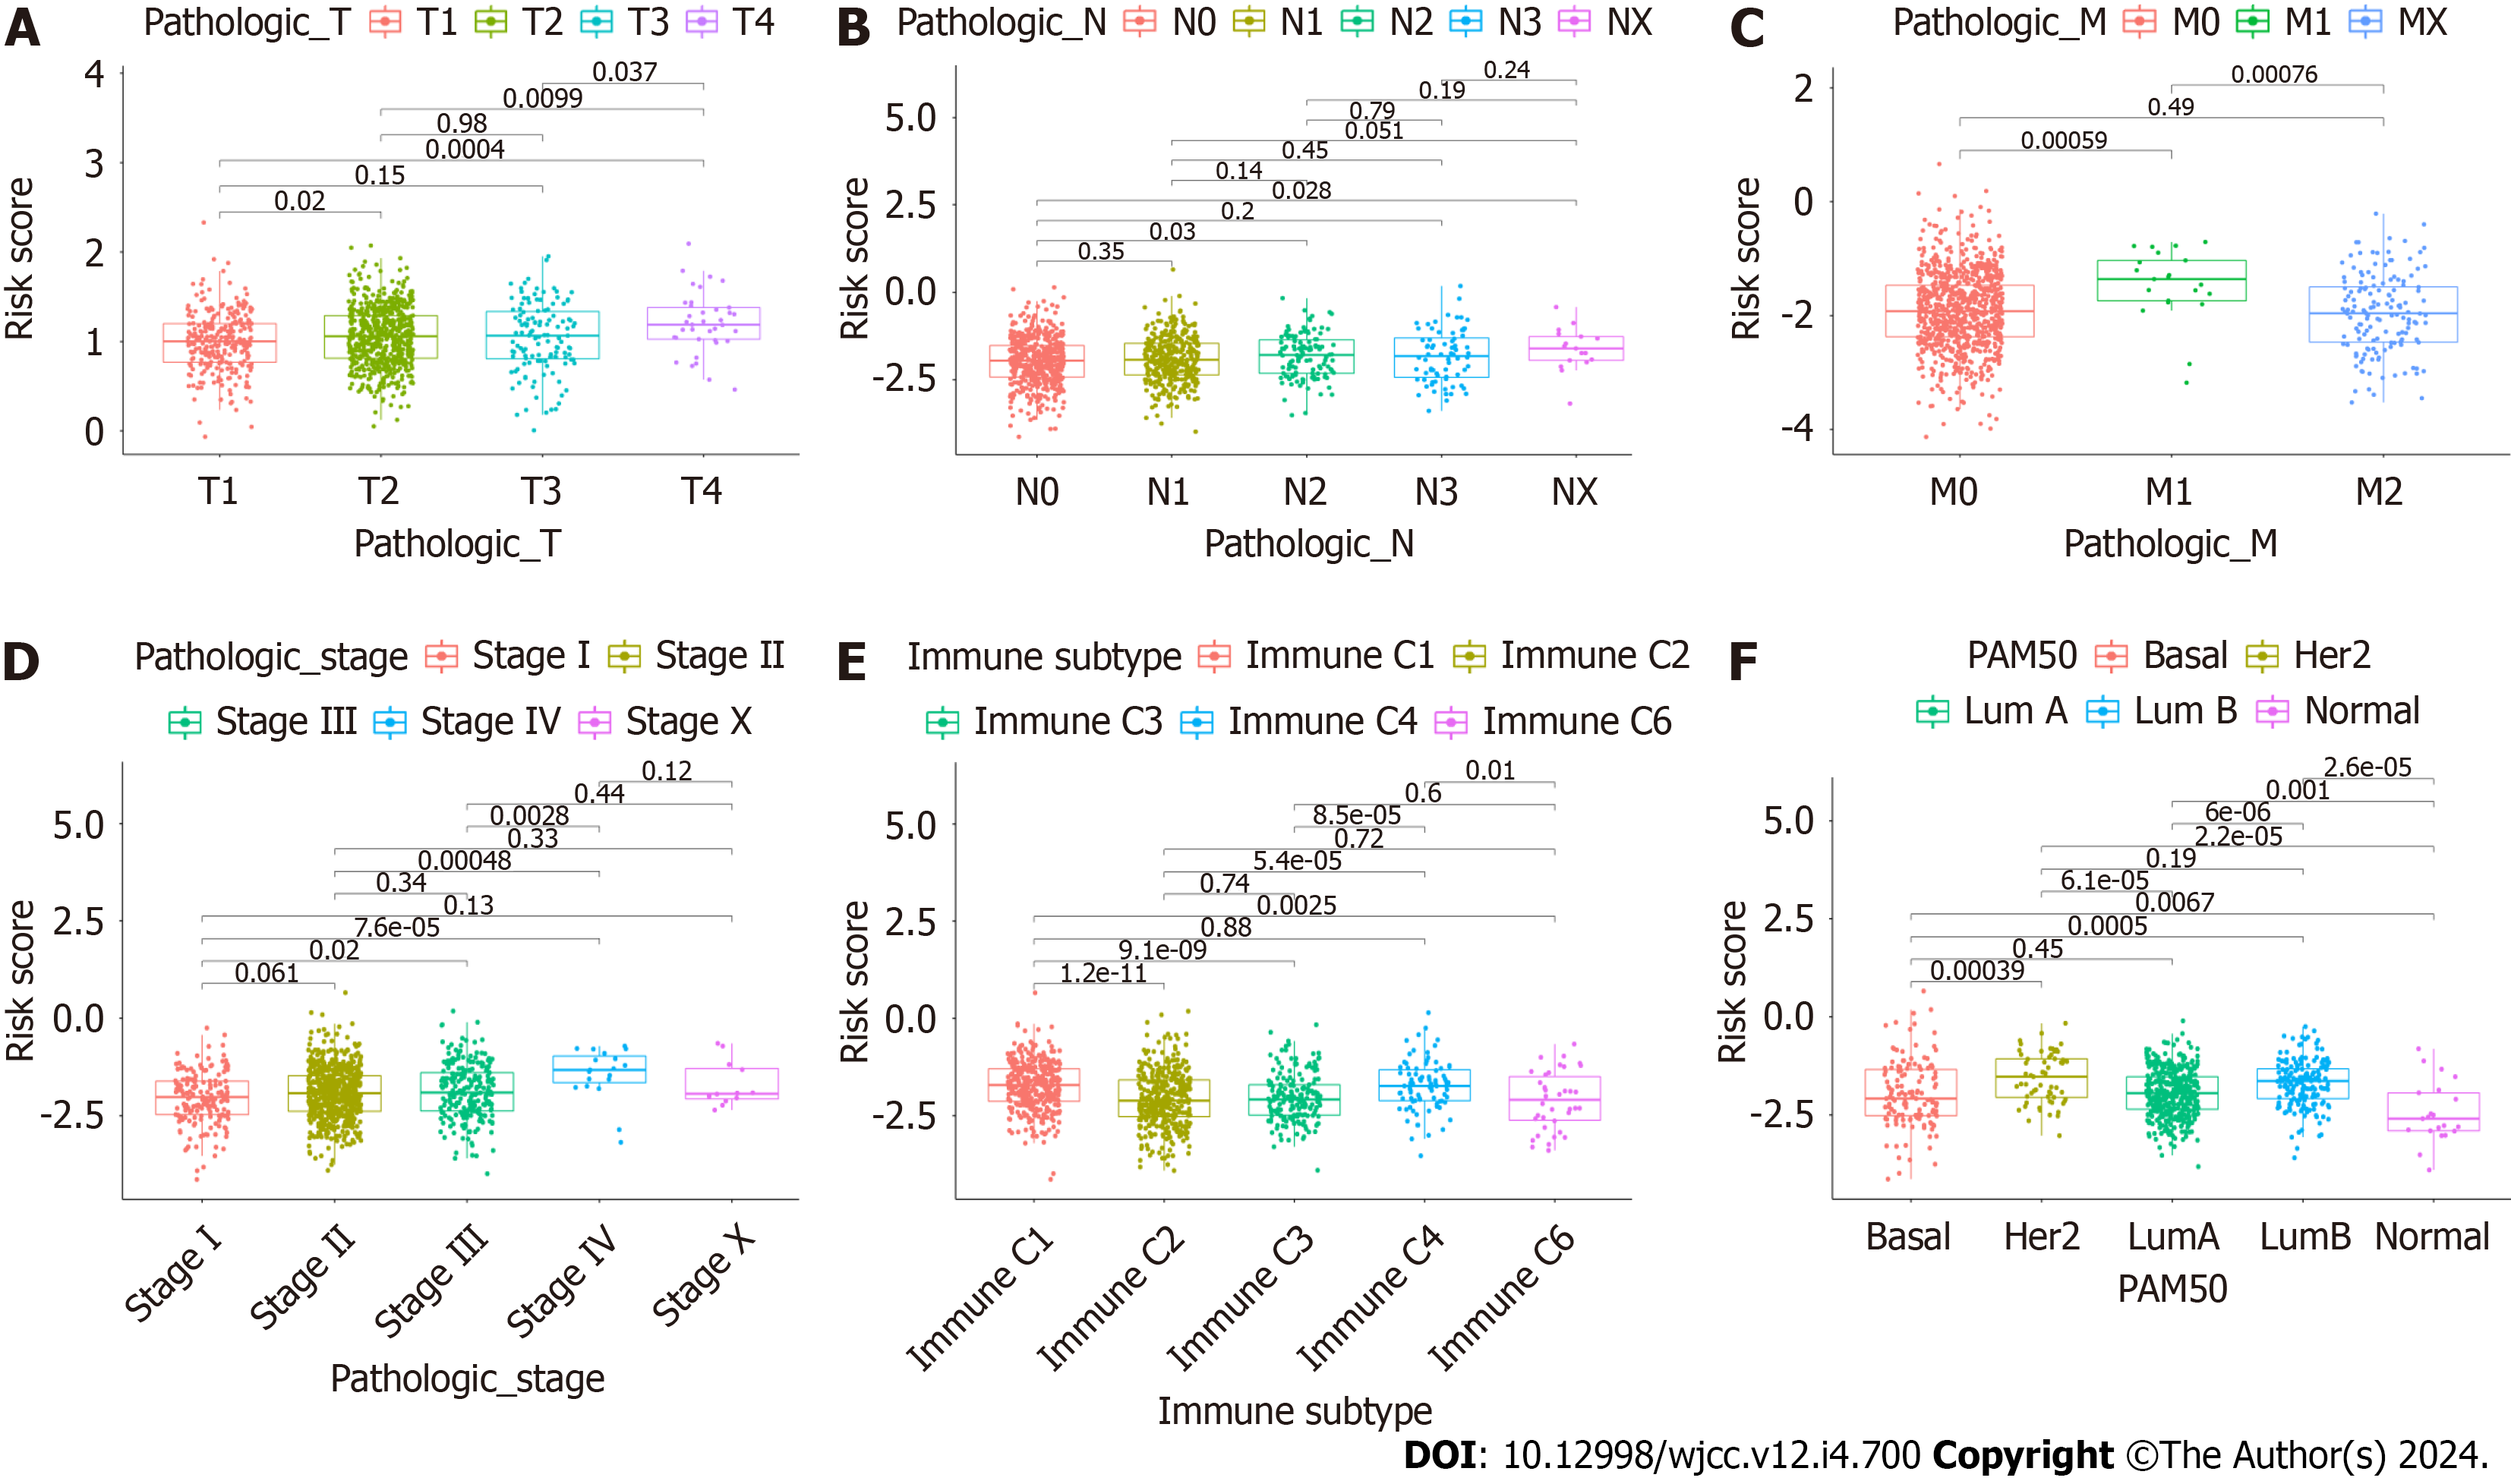
Figure 10 Association between CAFPS and clinicopathological factors.
A: Pathologic-T; B: Pathologic-N; C: Pathologic-M; D: Pathologic-stage; E: Immune subtype; F: PAM50.
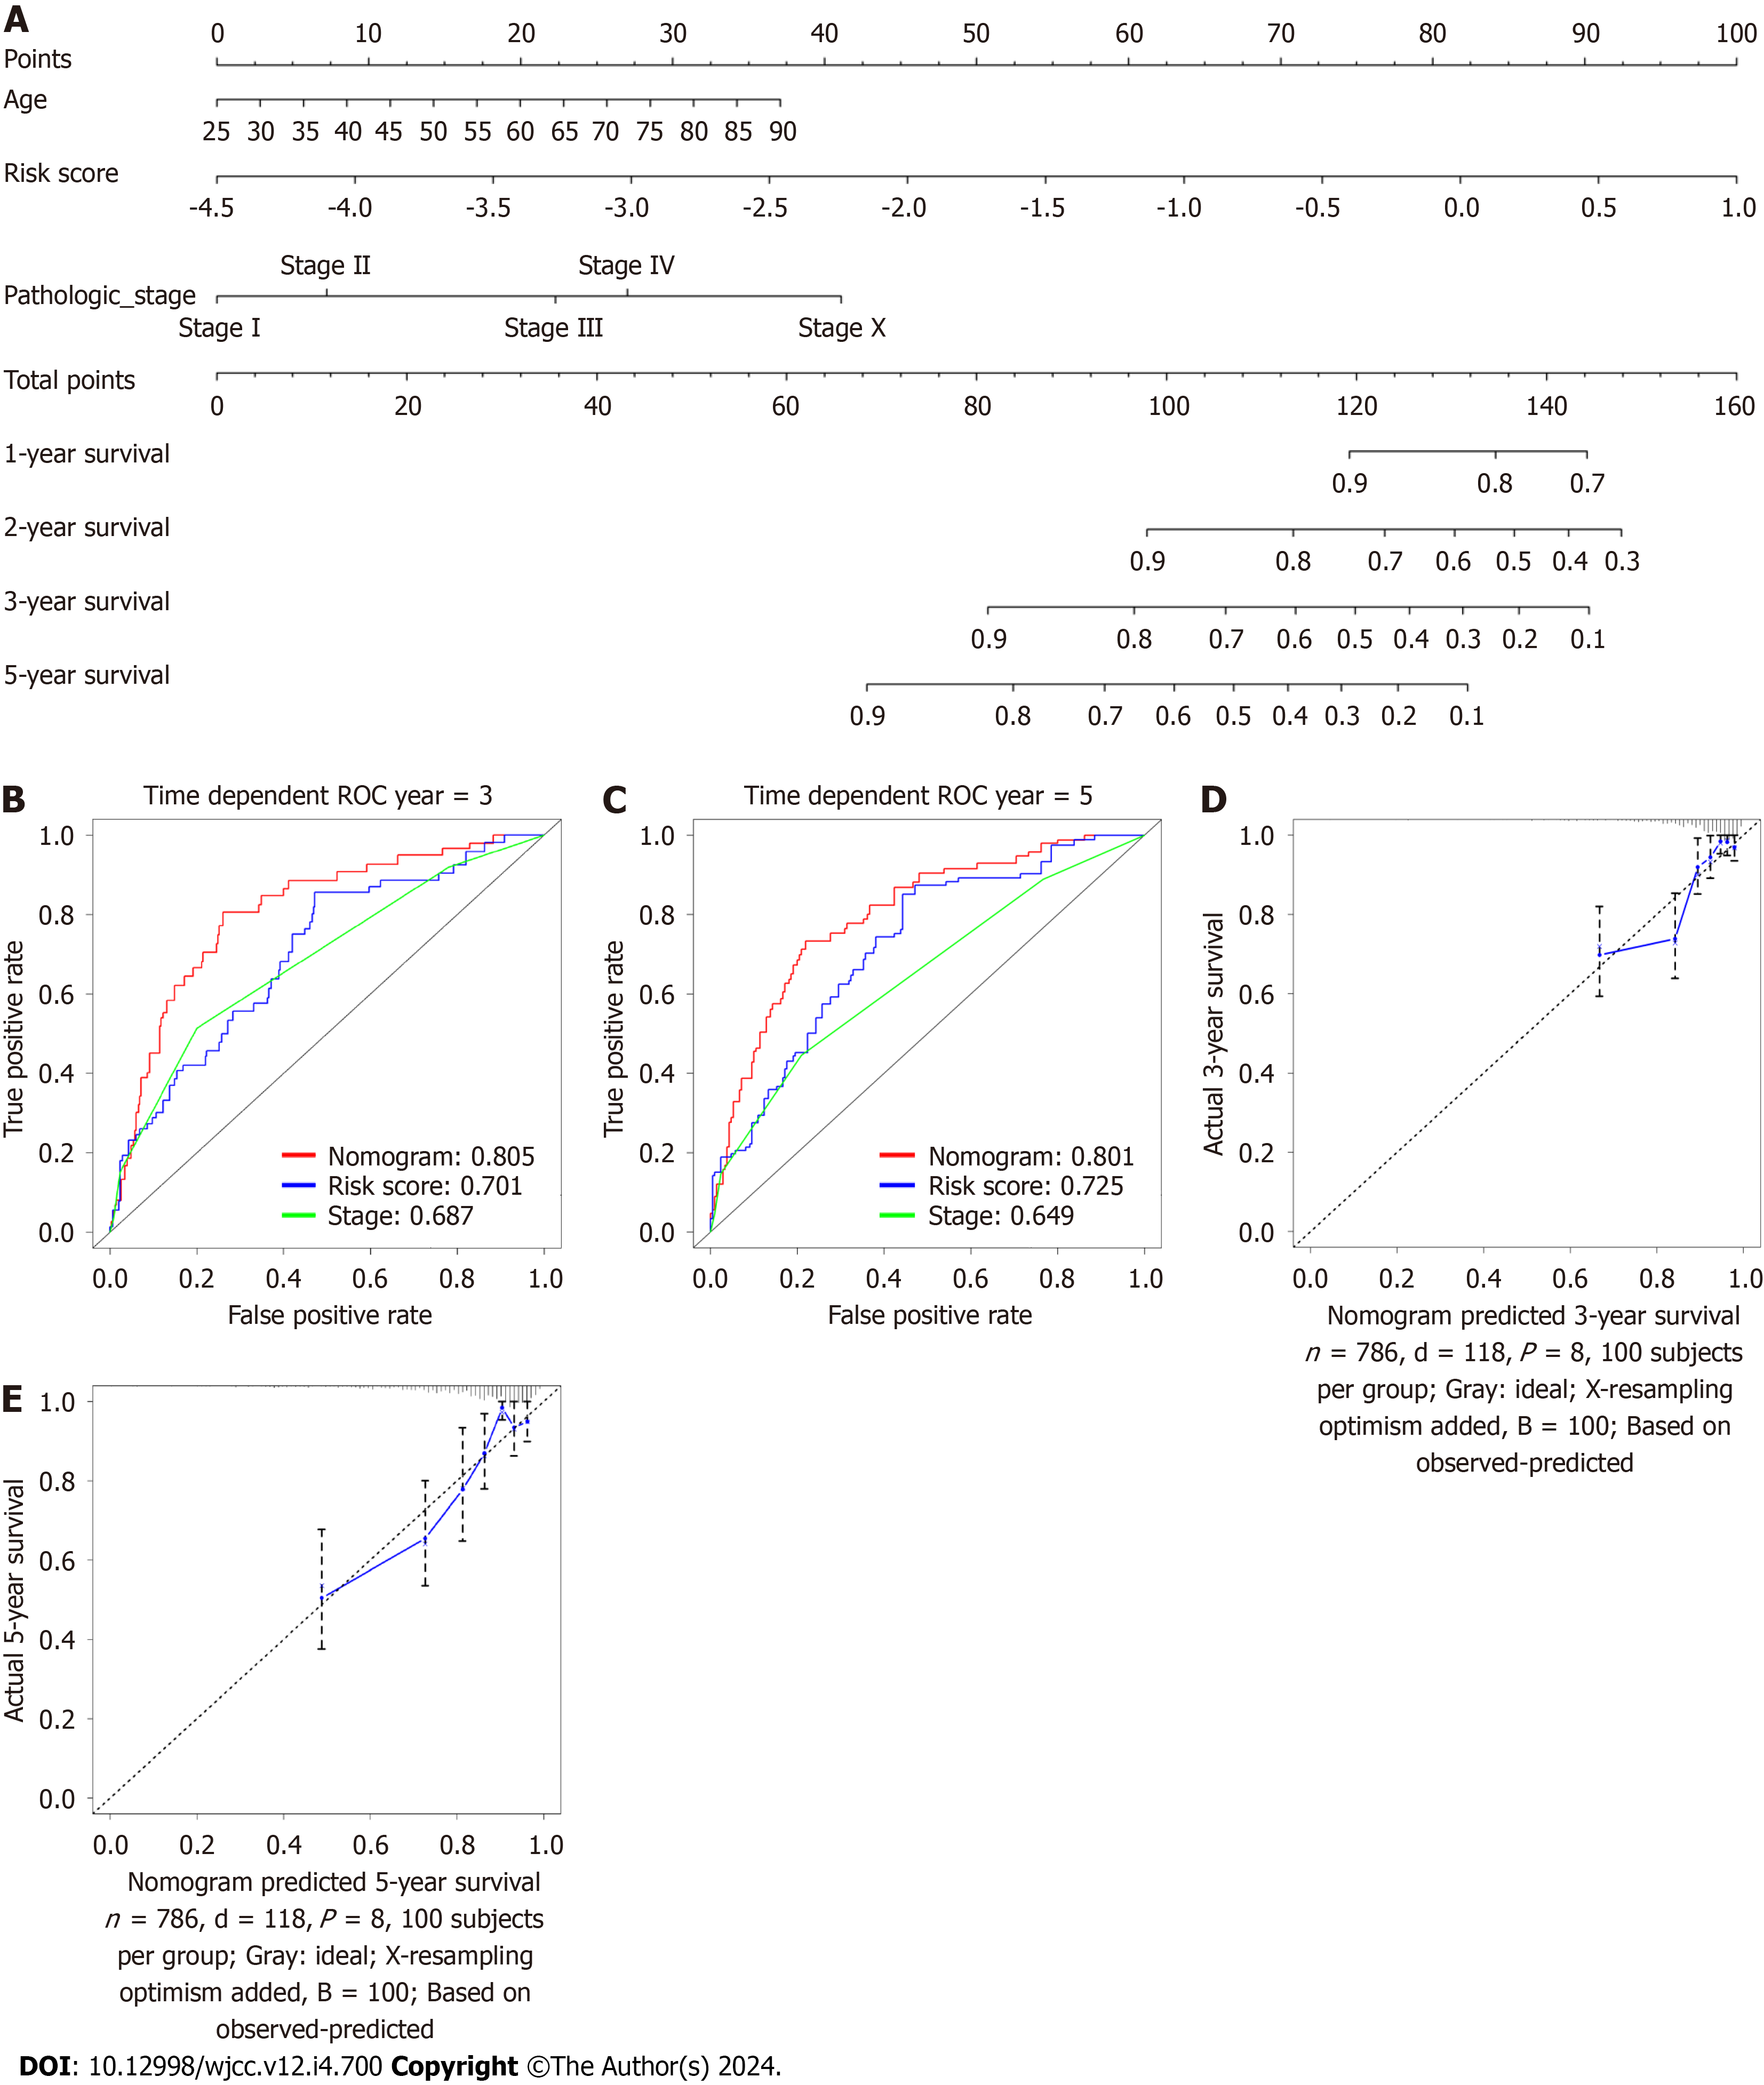
Figure 11 Nomogram generation for the prediction of 3- and 5-year survival.
A: Development of a nomogram for estimating 1-, 2-, 3-and 5-year survival probabilities of breast cancer patients using the The Cancer Genome Atlas (TCGA) database; B and C: The 3- and 5-year area under the curves of nomogram, stage, CAFPS using the TCGA database; D and E: The 3- and 5-year calibration curves for predicting overall survival.
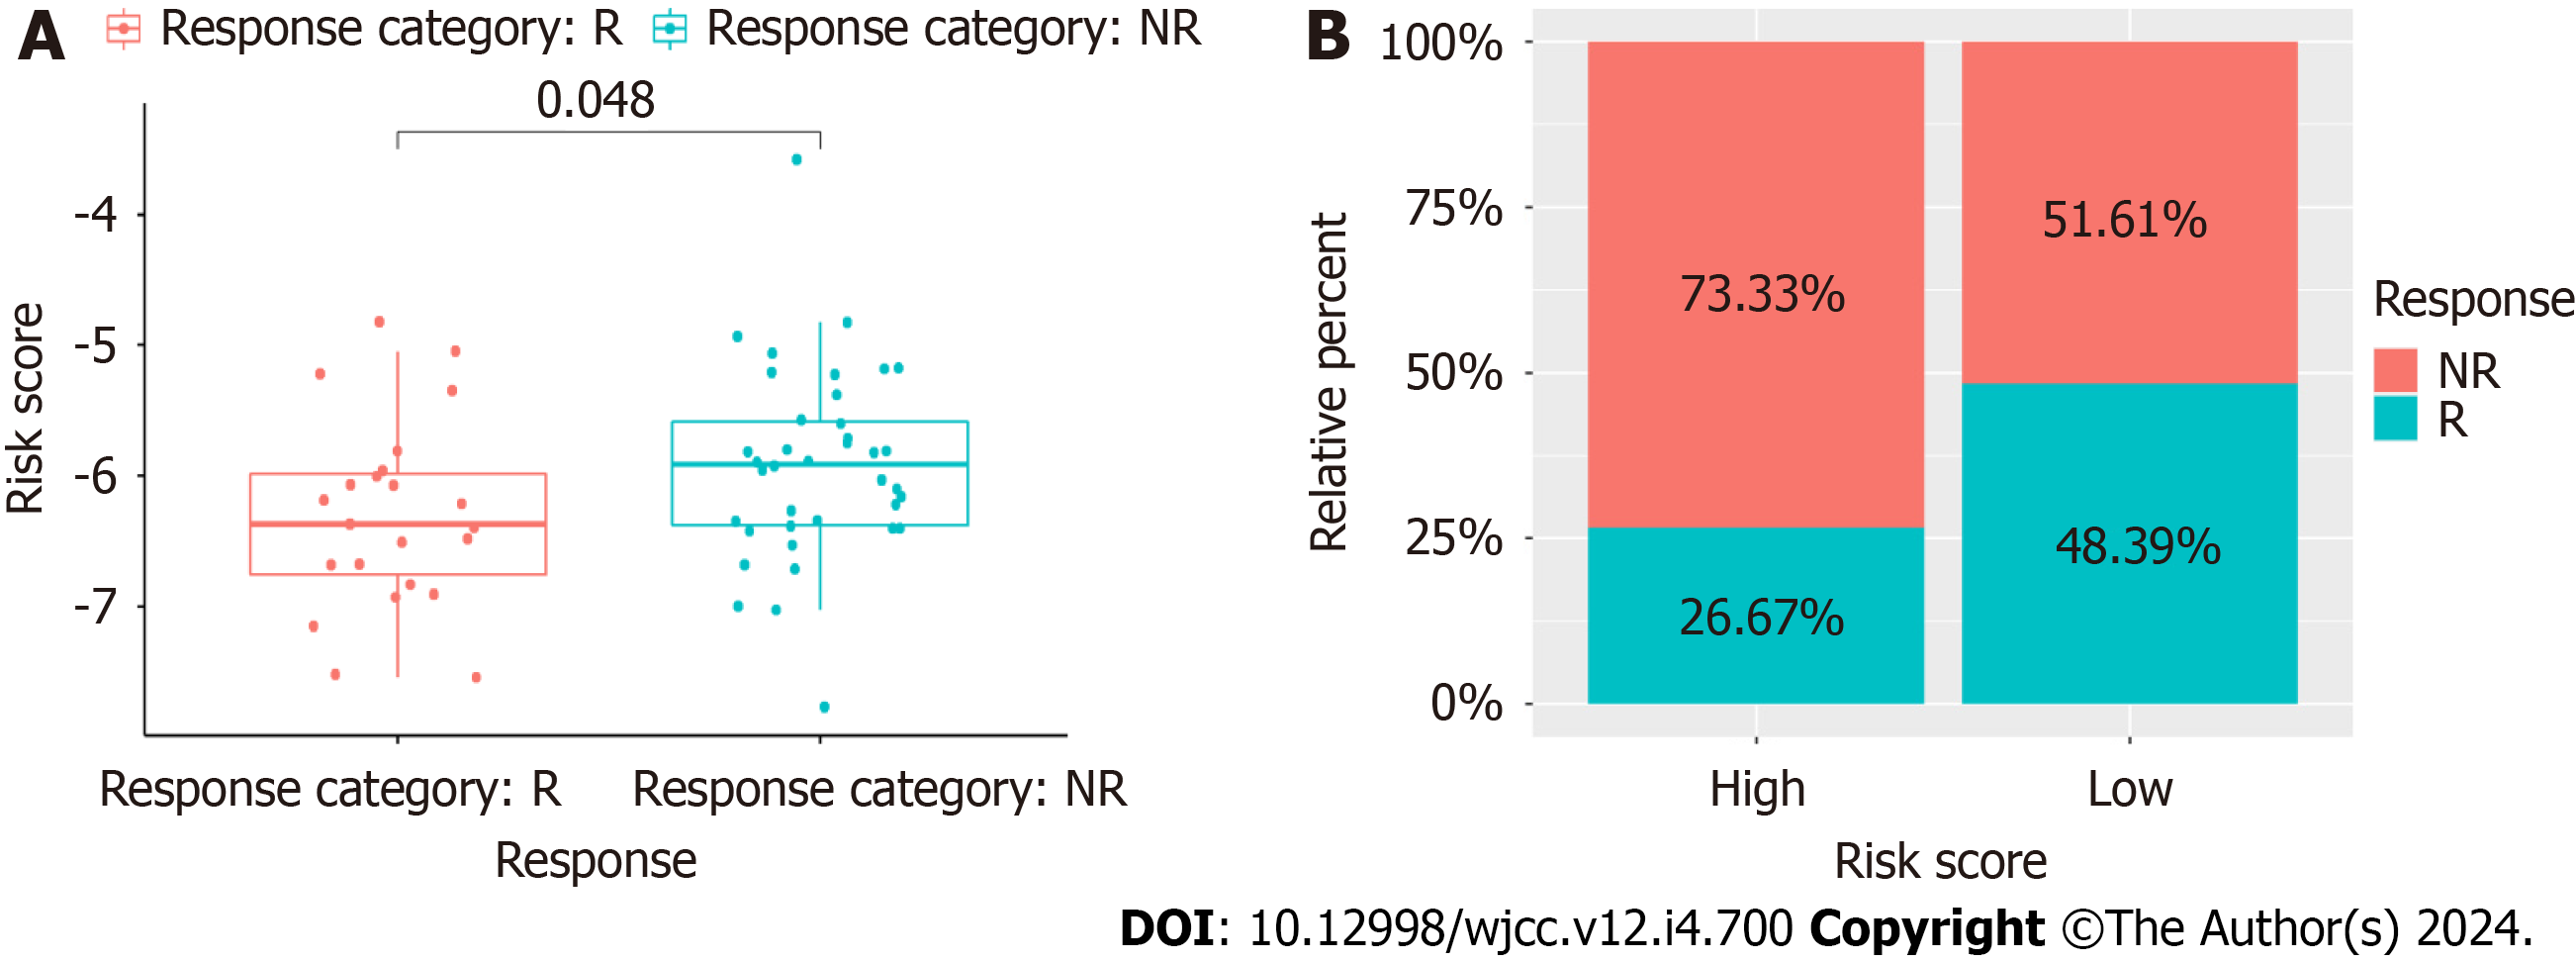
Figure 12 Prediction of chemotherapy response.
A: The cancer associated fibroblast risk score of estimated chemotherapy-responders and non-responders in GSE18728; B: Distributions of responders and non-responders in high- and low-risk groups in GSE18728.
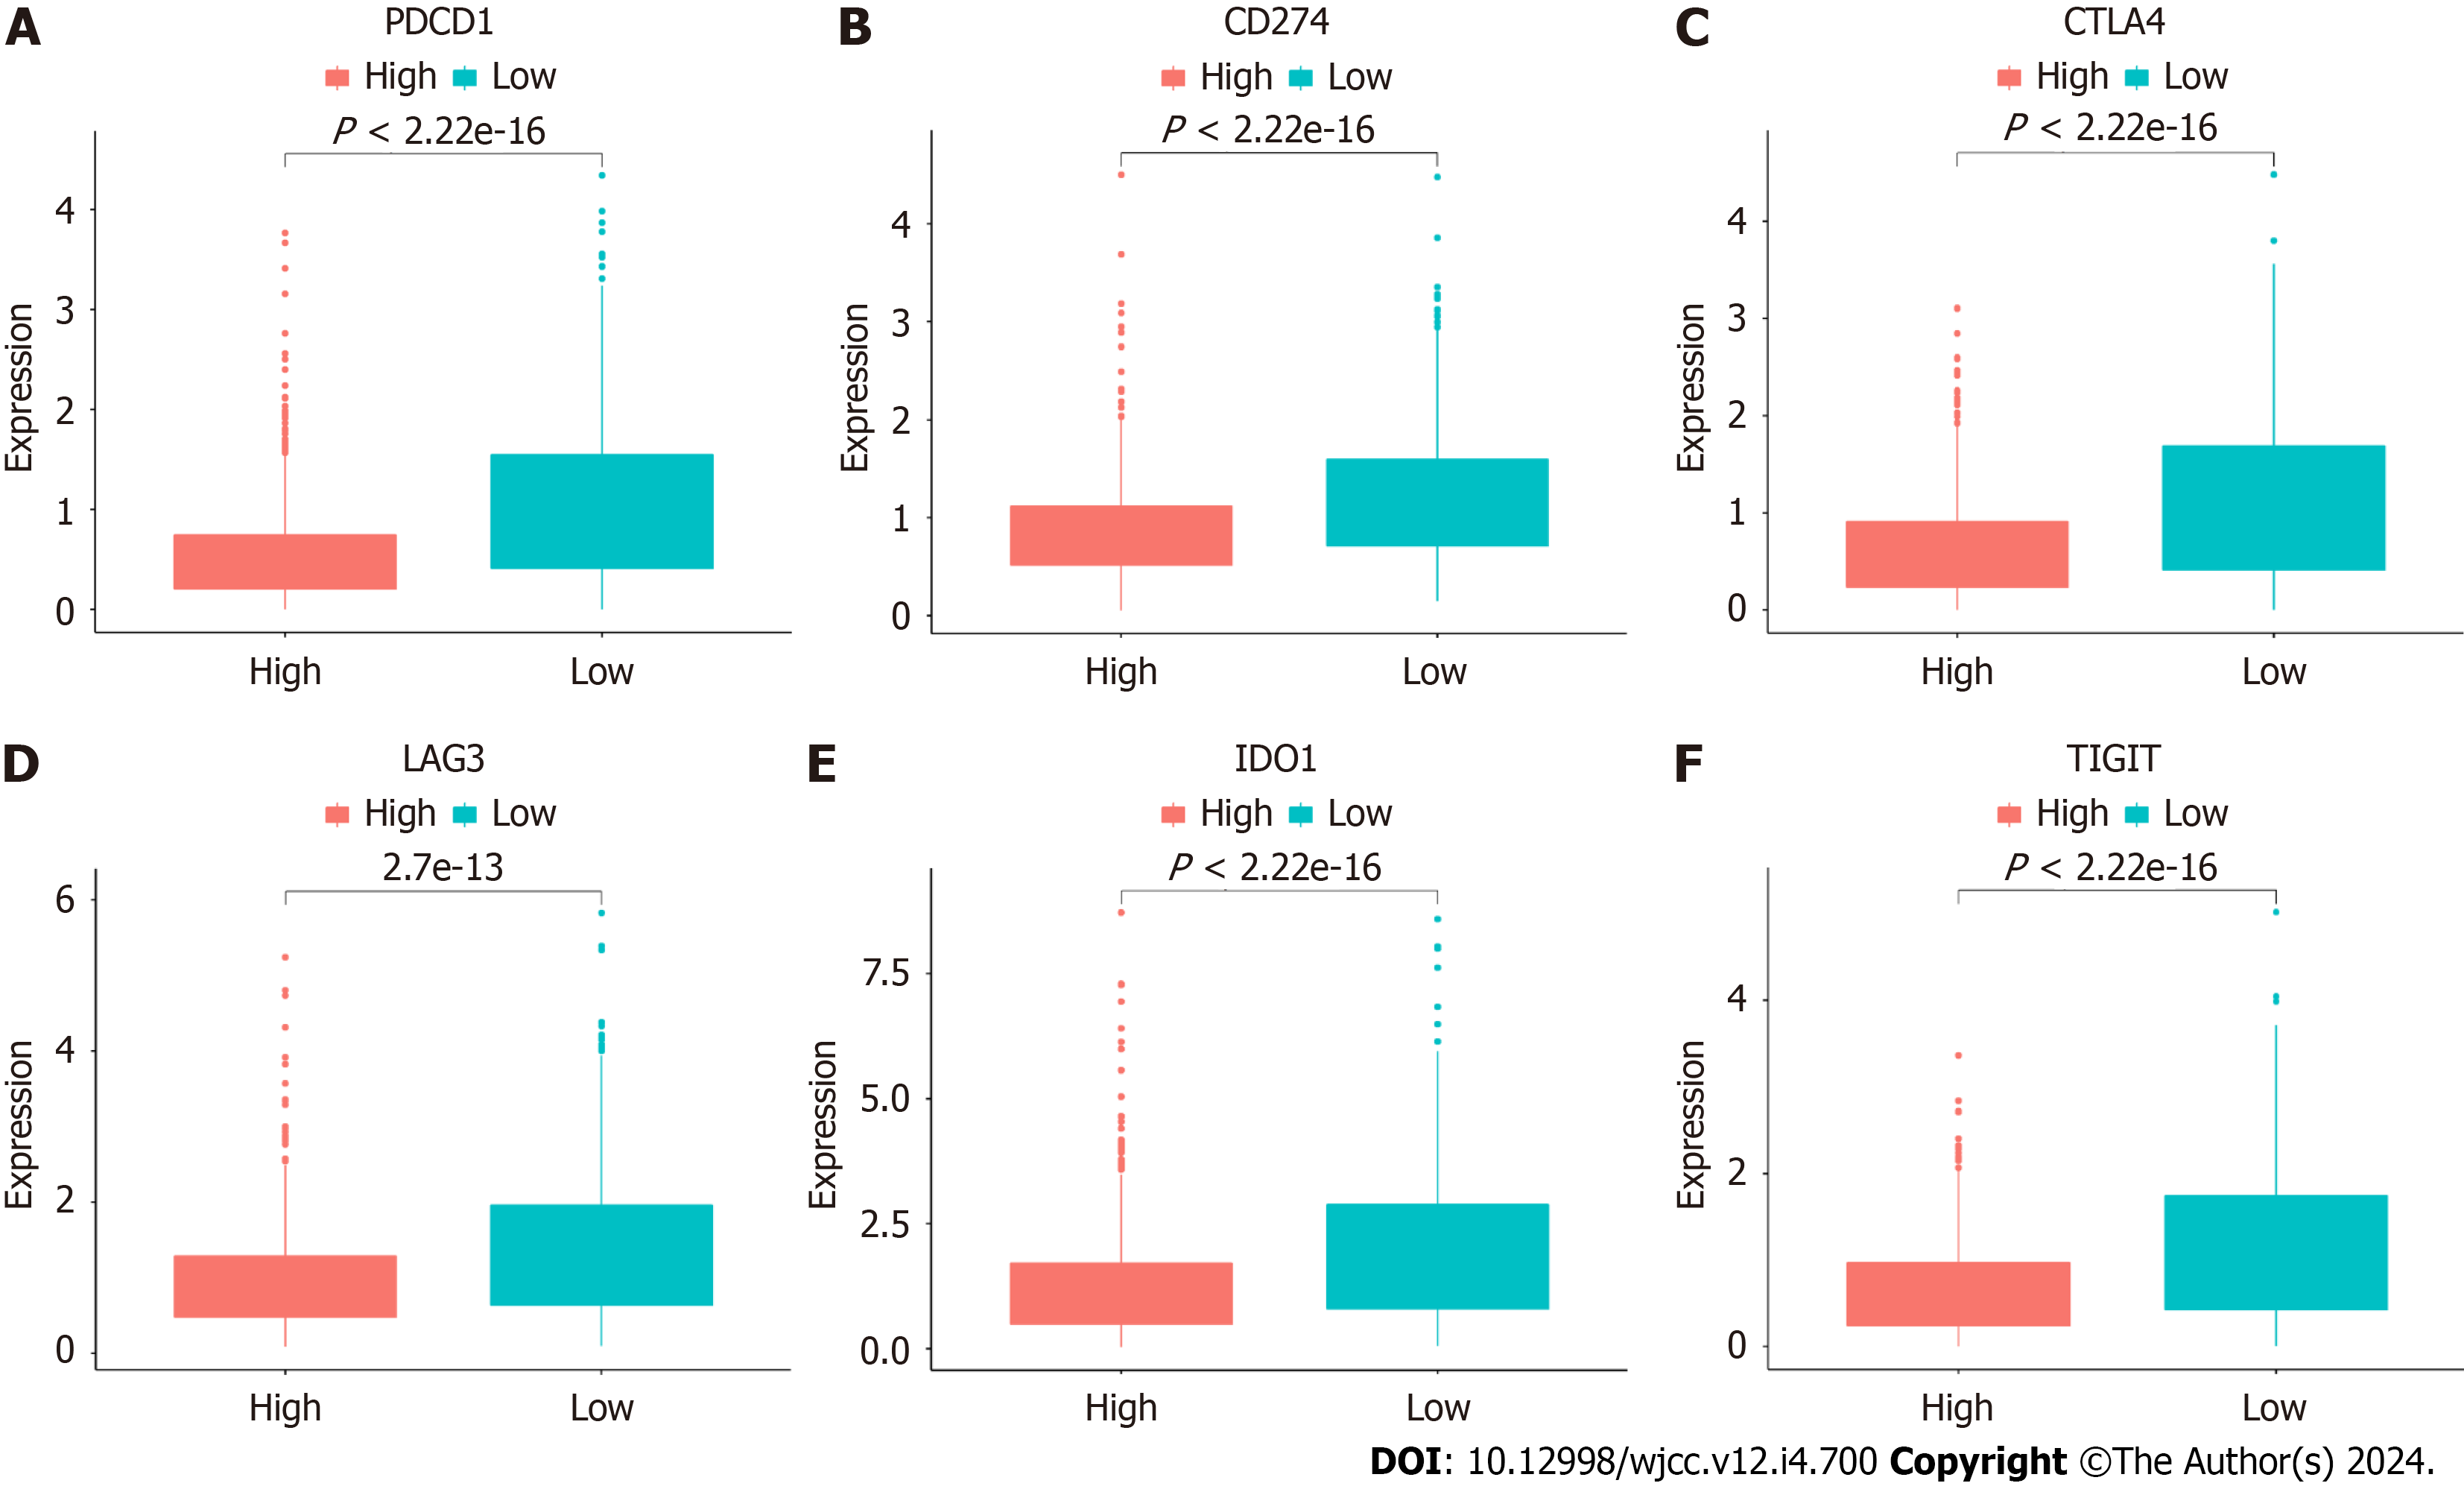
Figure 13 Immune checkpoint gene expression in both risk cohorts in The Cancer Genome Atlas cohort.
A: PDCD1; B: CD274; C: CTLA4; D: LAG3; E: IDO1; F: TIGIT.
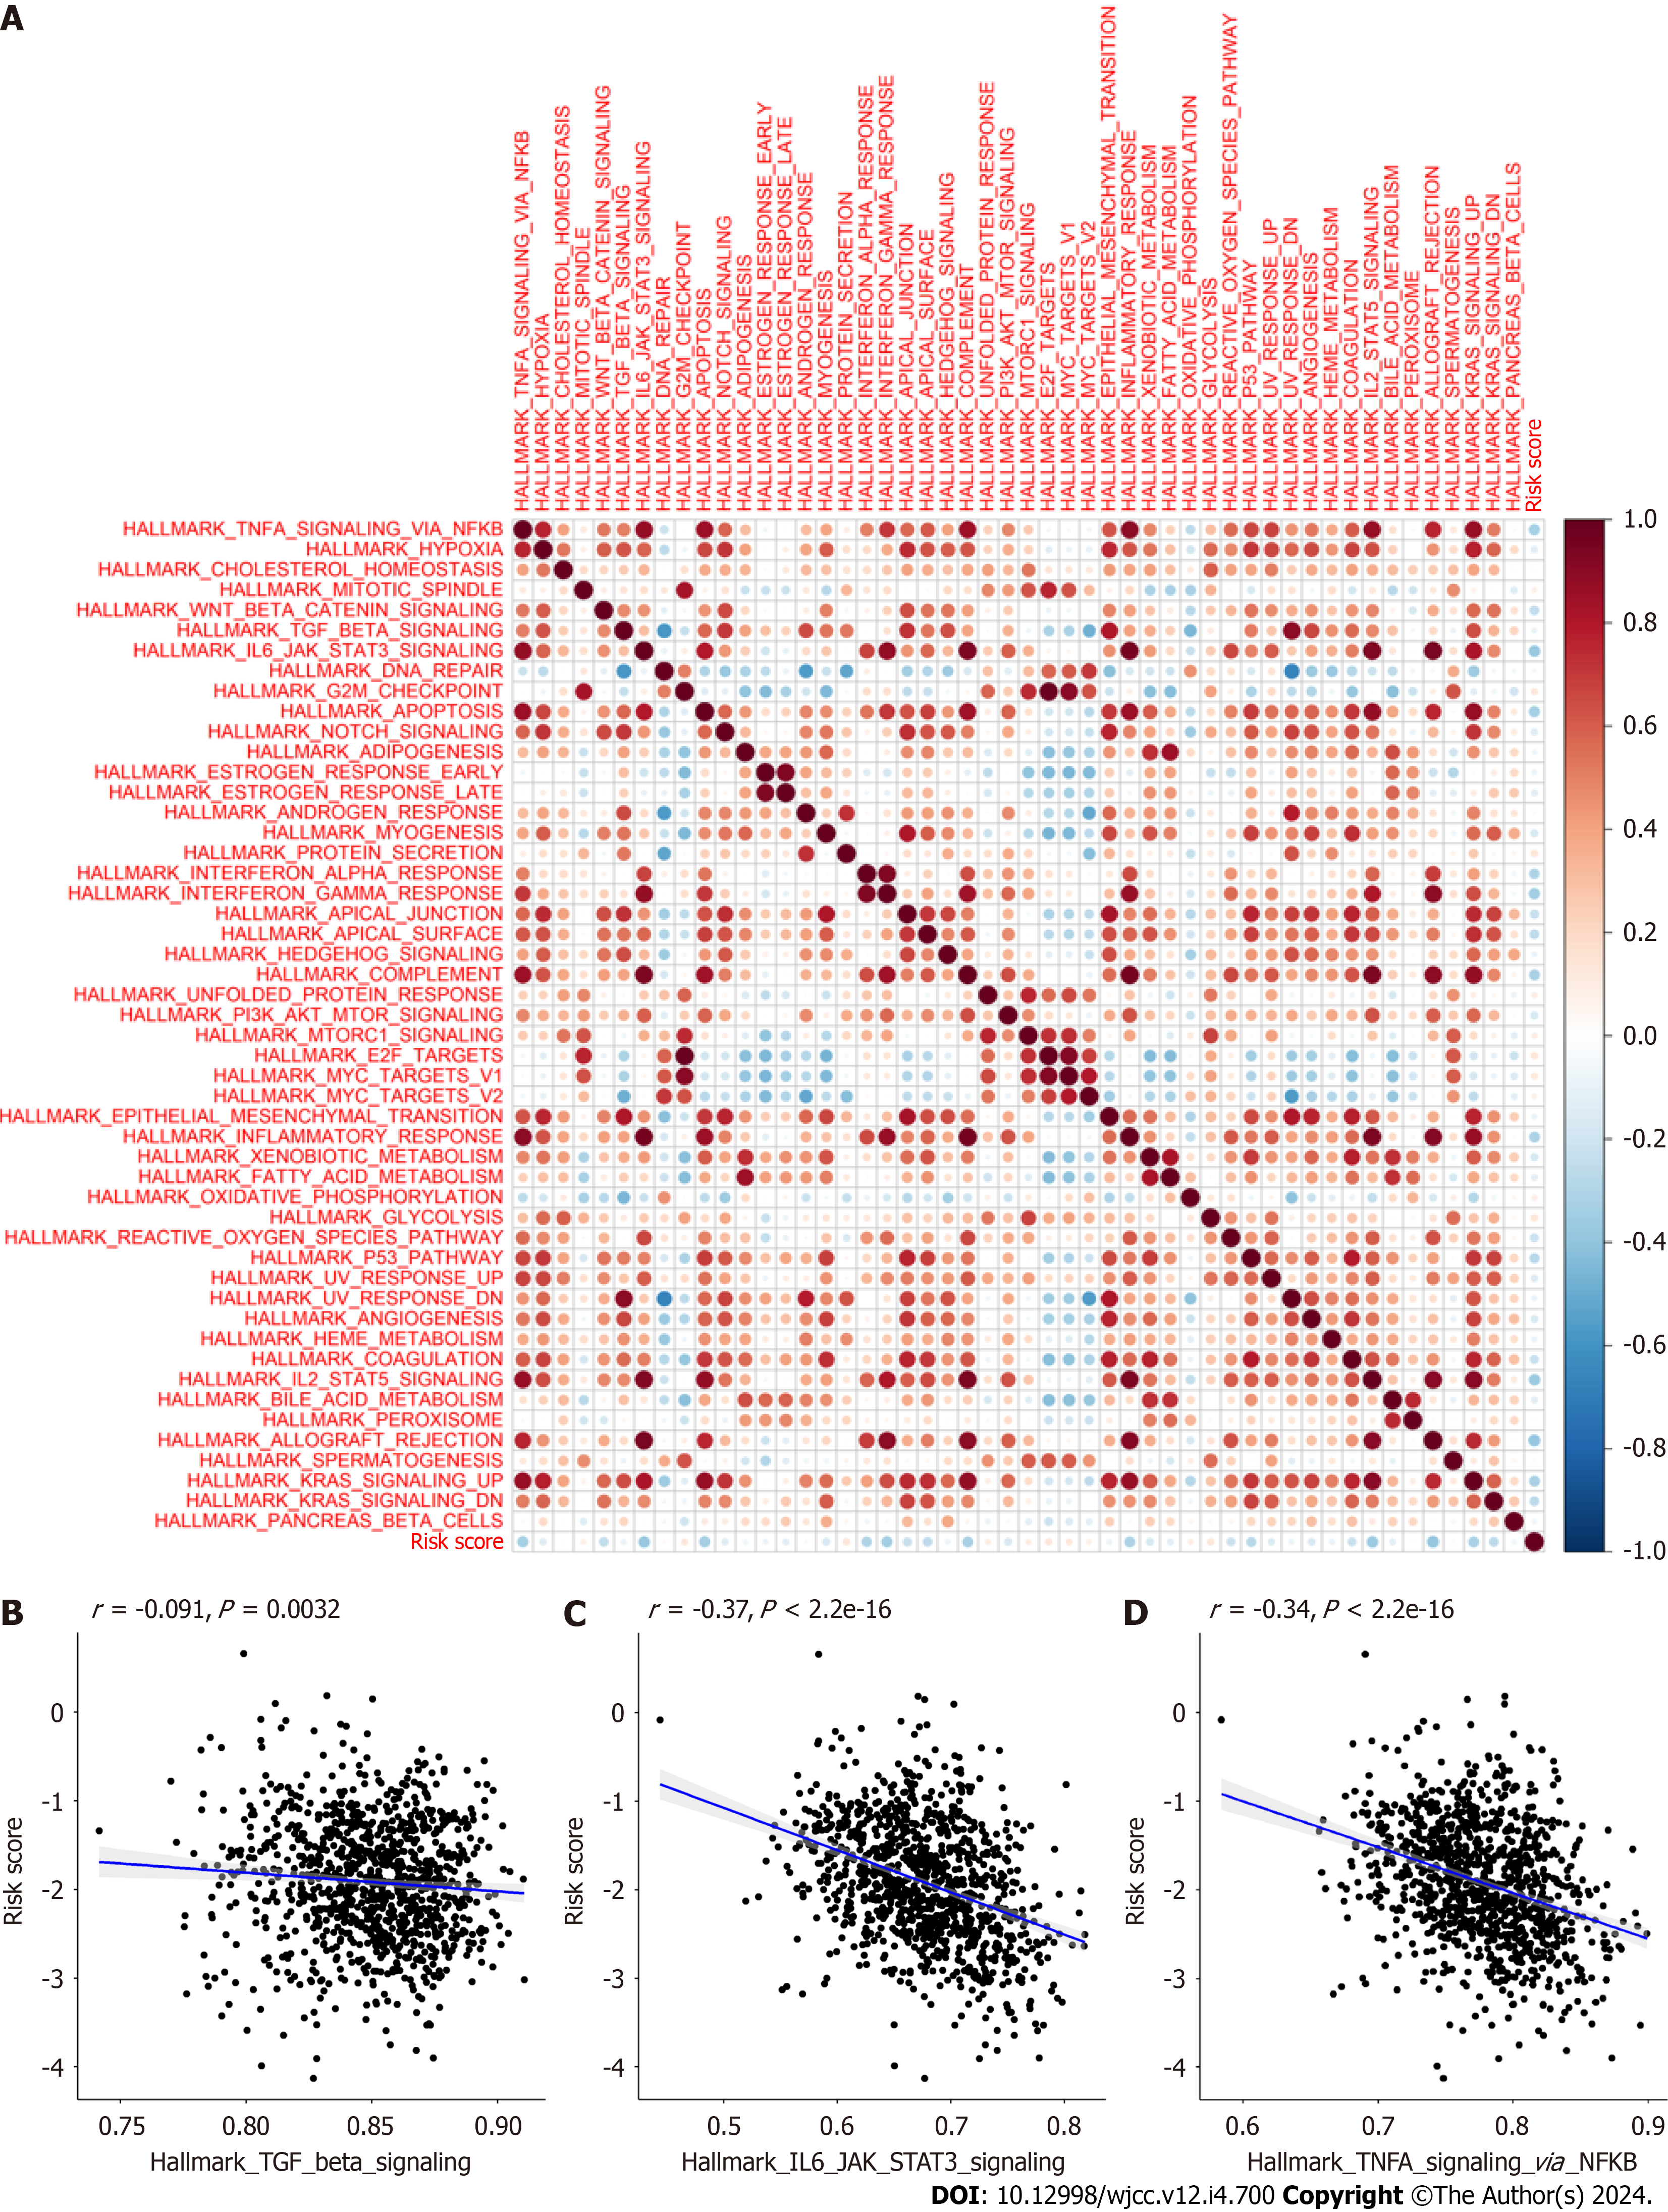
Figure 14 Correlation between CAFPS and signaling pathways.
A: Spearman’s correlation analyses revealing that CAFPS is significantly correlated with most hallmark gene sets; B: The ssGSEA data revealing that the cancer associated fibroblast (CAF) risk score is directly associated with TGF-BETA signaling pathways enrichment scores using The Cancer Genome Atlas (TCGA) database; C: The ssGSEA data revealing that the CAF risk score is directly associated with IL-6-JAK-STAT3 signaling pathways enrichment scores using the TCGA database; D: The ssGSEA data revealing that the CAF risk score is directly associated with The TNFA-SIGNALING-VIA-NFKB signaling pathways enrichment scores using the TCGA database.
- Citation: Wu ZZ, Wei YJ, Li T, Zheng J, Liu YF, Han M. Identification and validation of a new prognostic signature based on cancer-associated fibroblast-driven genes in breast cancer. World J Clin Cases 2024; 12(4): 700-720
- URL: https://www.wjgnet.com/2307-8960/full/v12/i4/700.htm
- DOI: https://dx.doi.org/10.12998/wjcc.v12.i4.700


