Copyright
©The Author(s) 2024.
World J Clin Cases. Jan 26, 2024; 12(3): 538-550
Published online Jan 26, 2024. doi: 10.12998/wjcc.v12.i3.538
Published online Jan 26, 2024. doi: 10.12998/wjcc.v12.i3.538
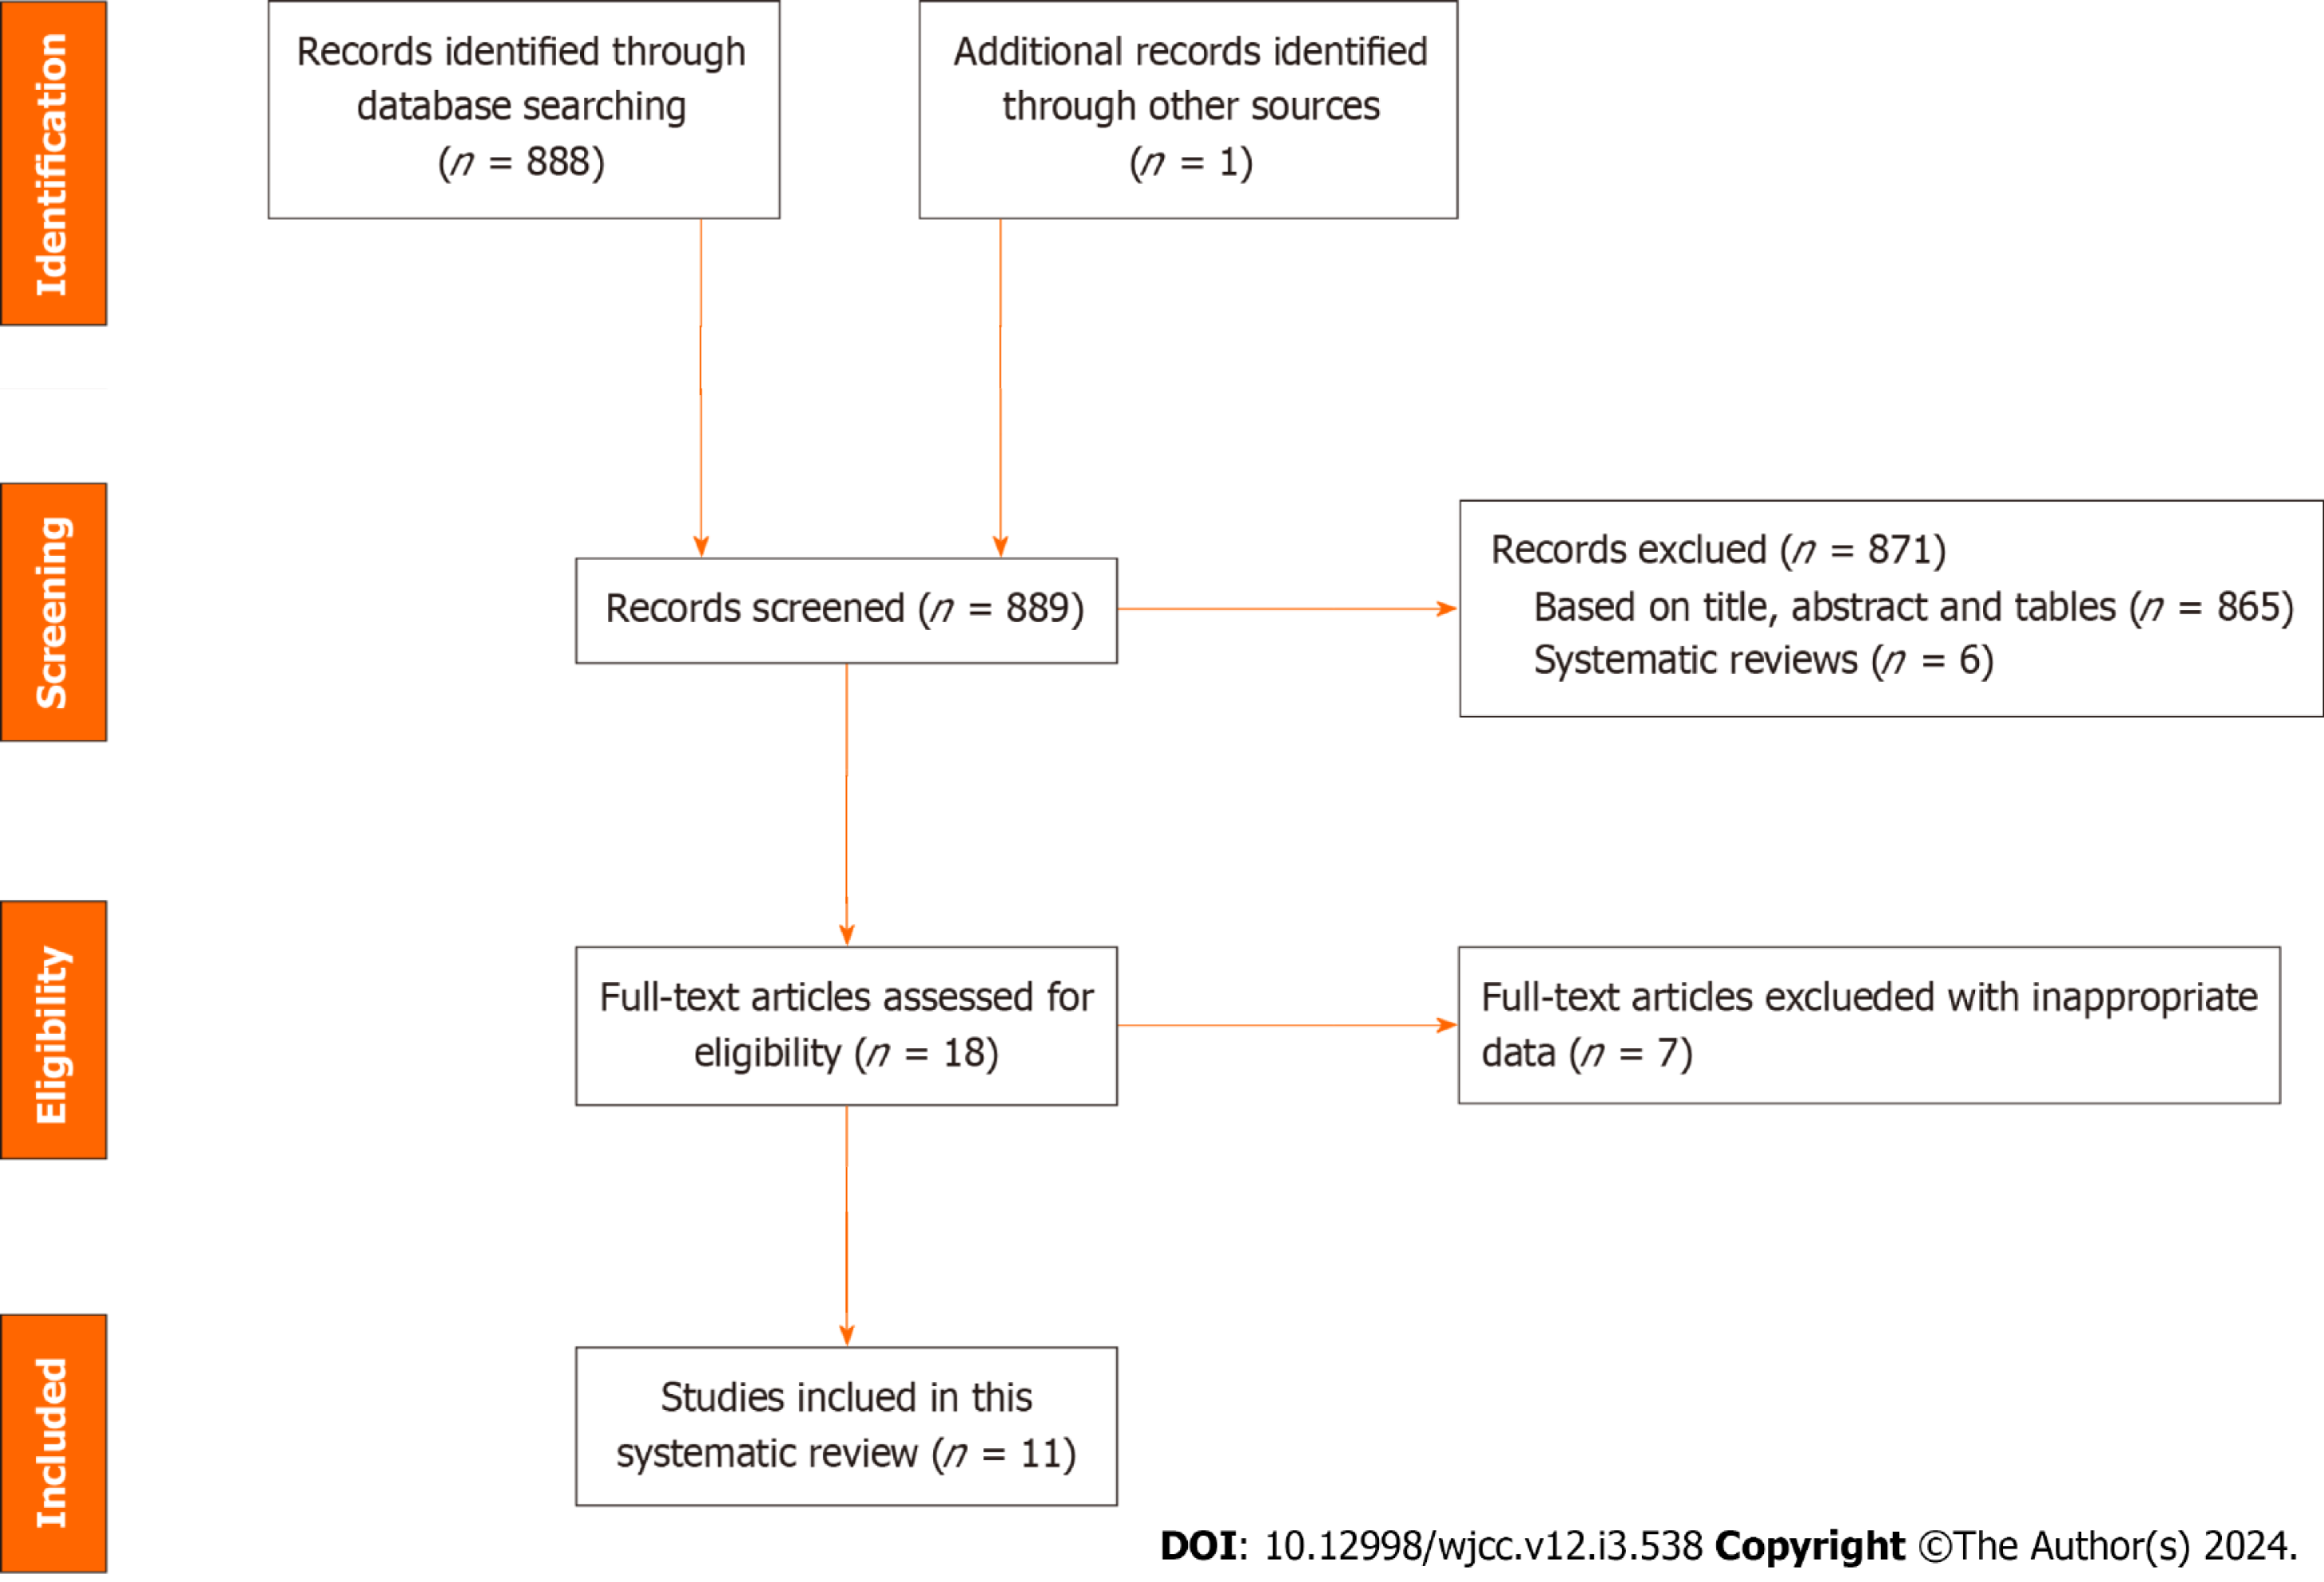
Figure 1 Flowchart detailing the literature search and screening strategy for this study.
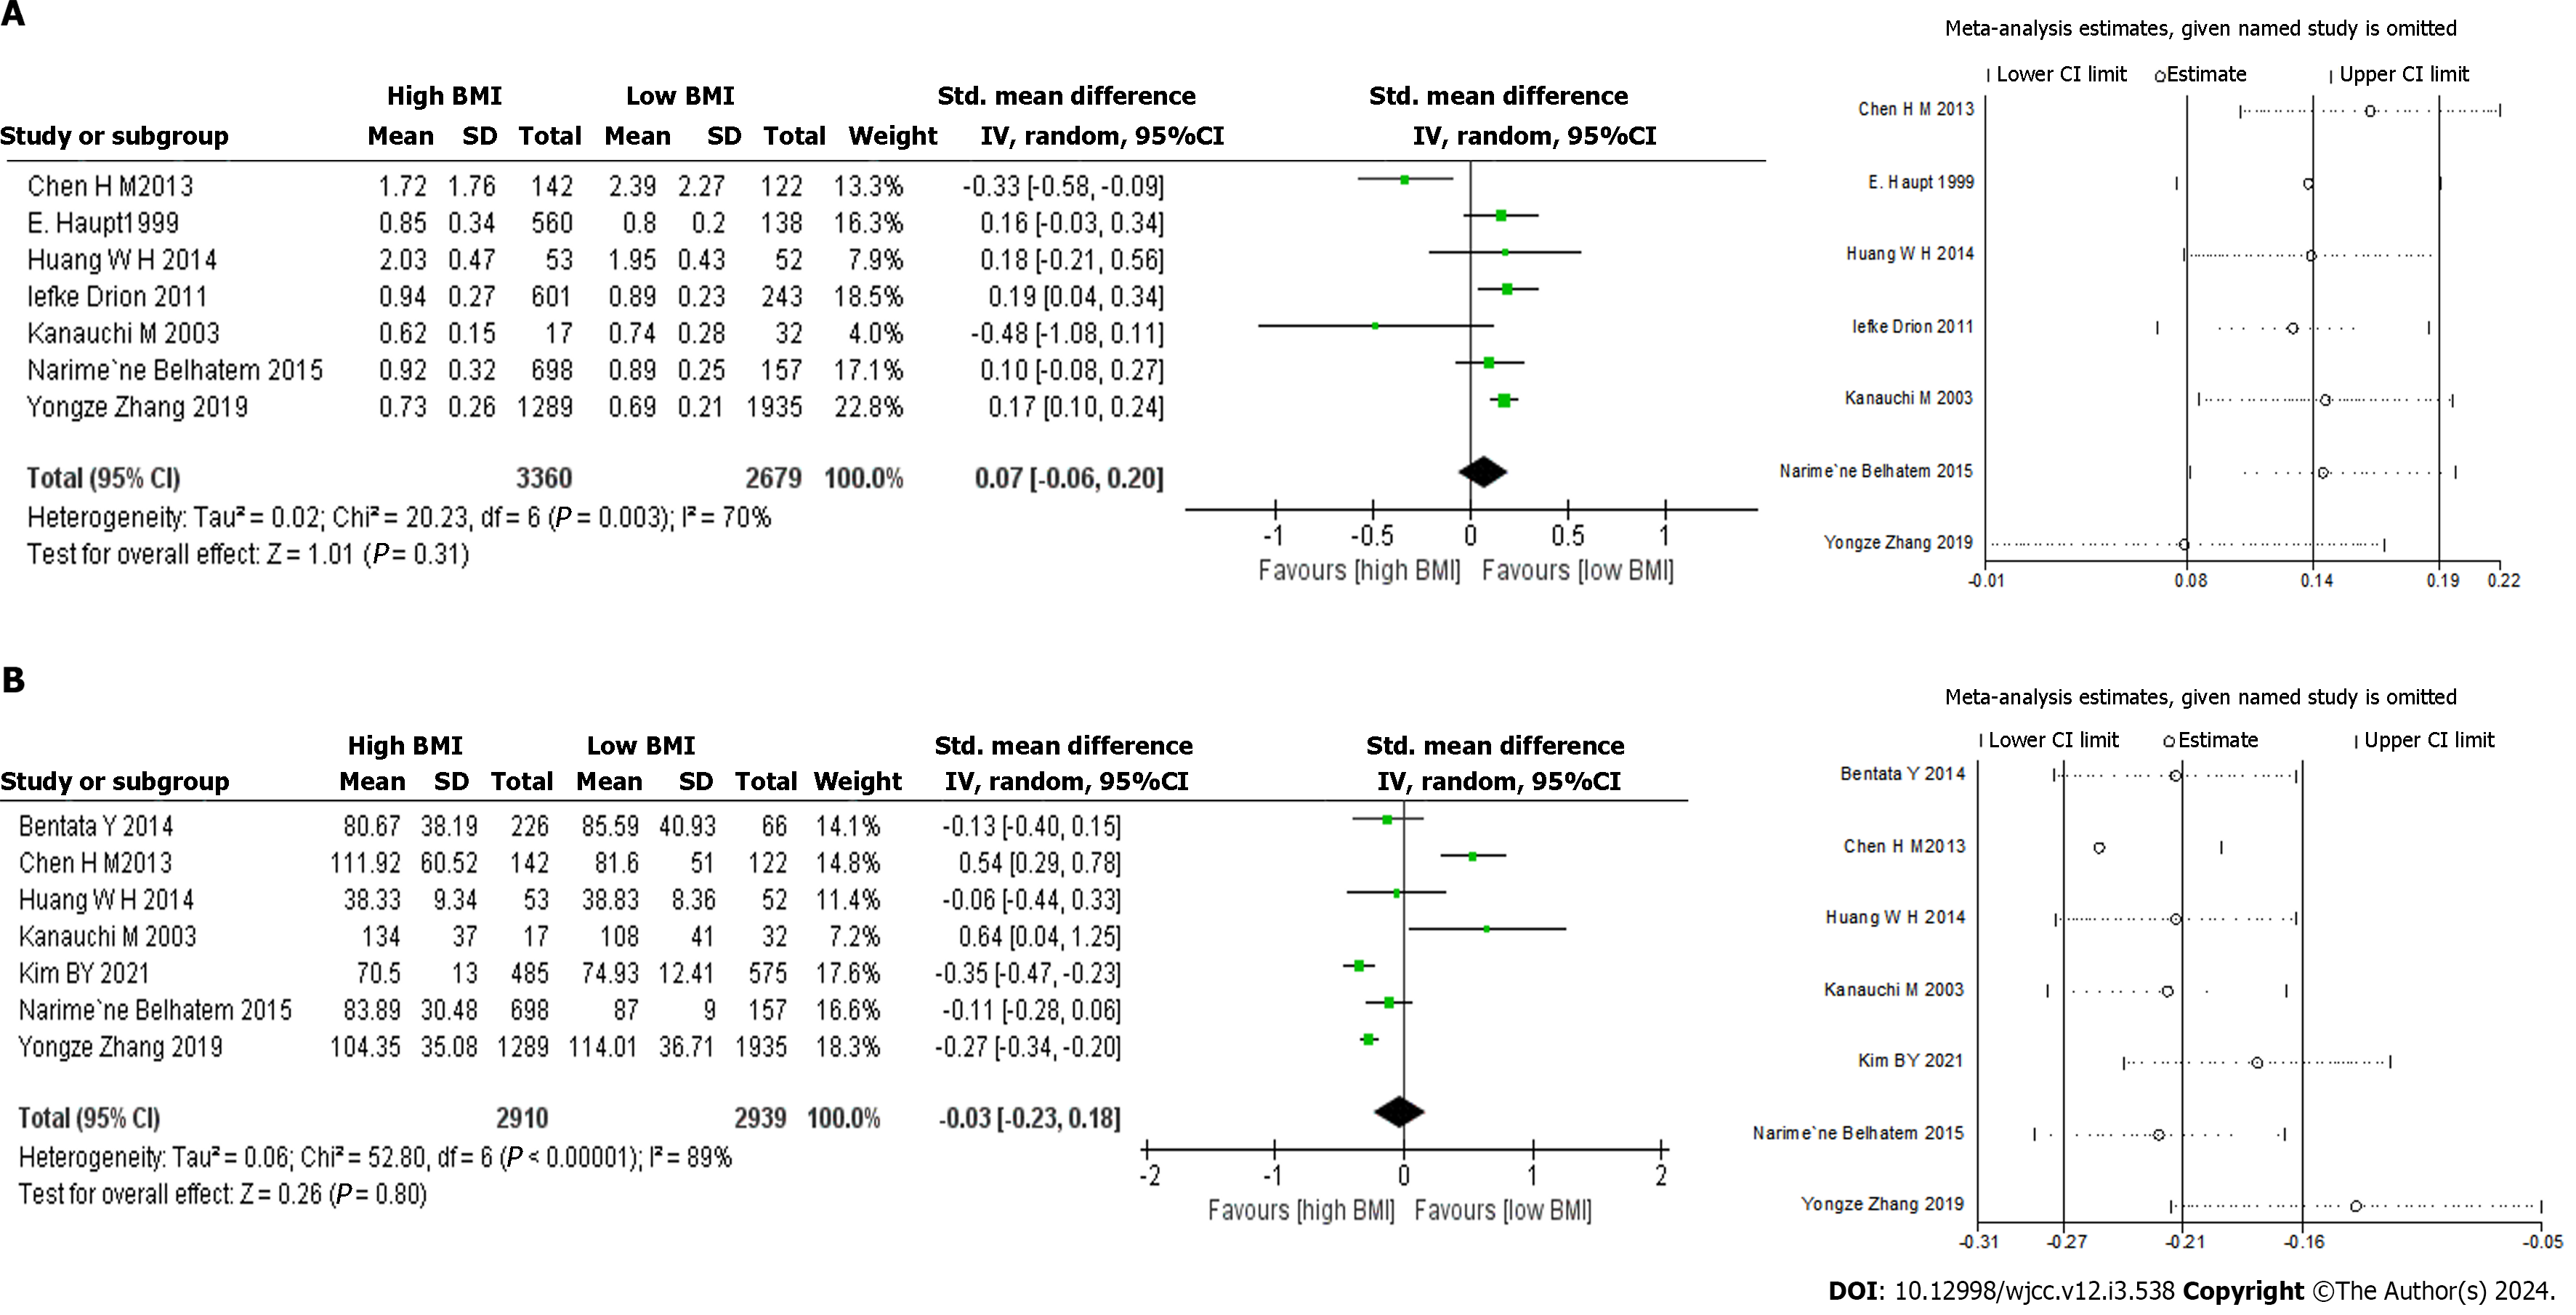
Figure 2 Forest plots of the baseline characteristics.
A: Serum creatinine; B: Estimation of glomerular filtration rate. BMI: Body mass index; CI: Confidence interval.
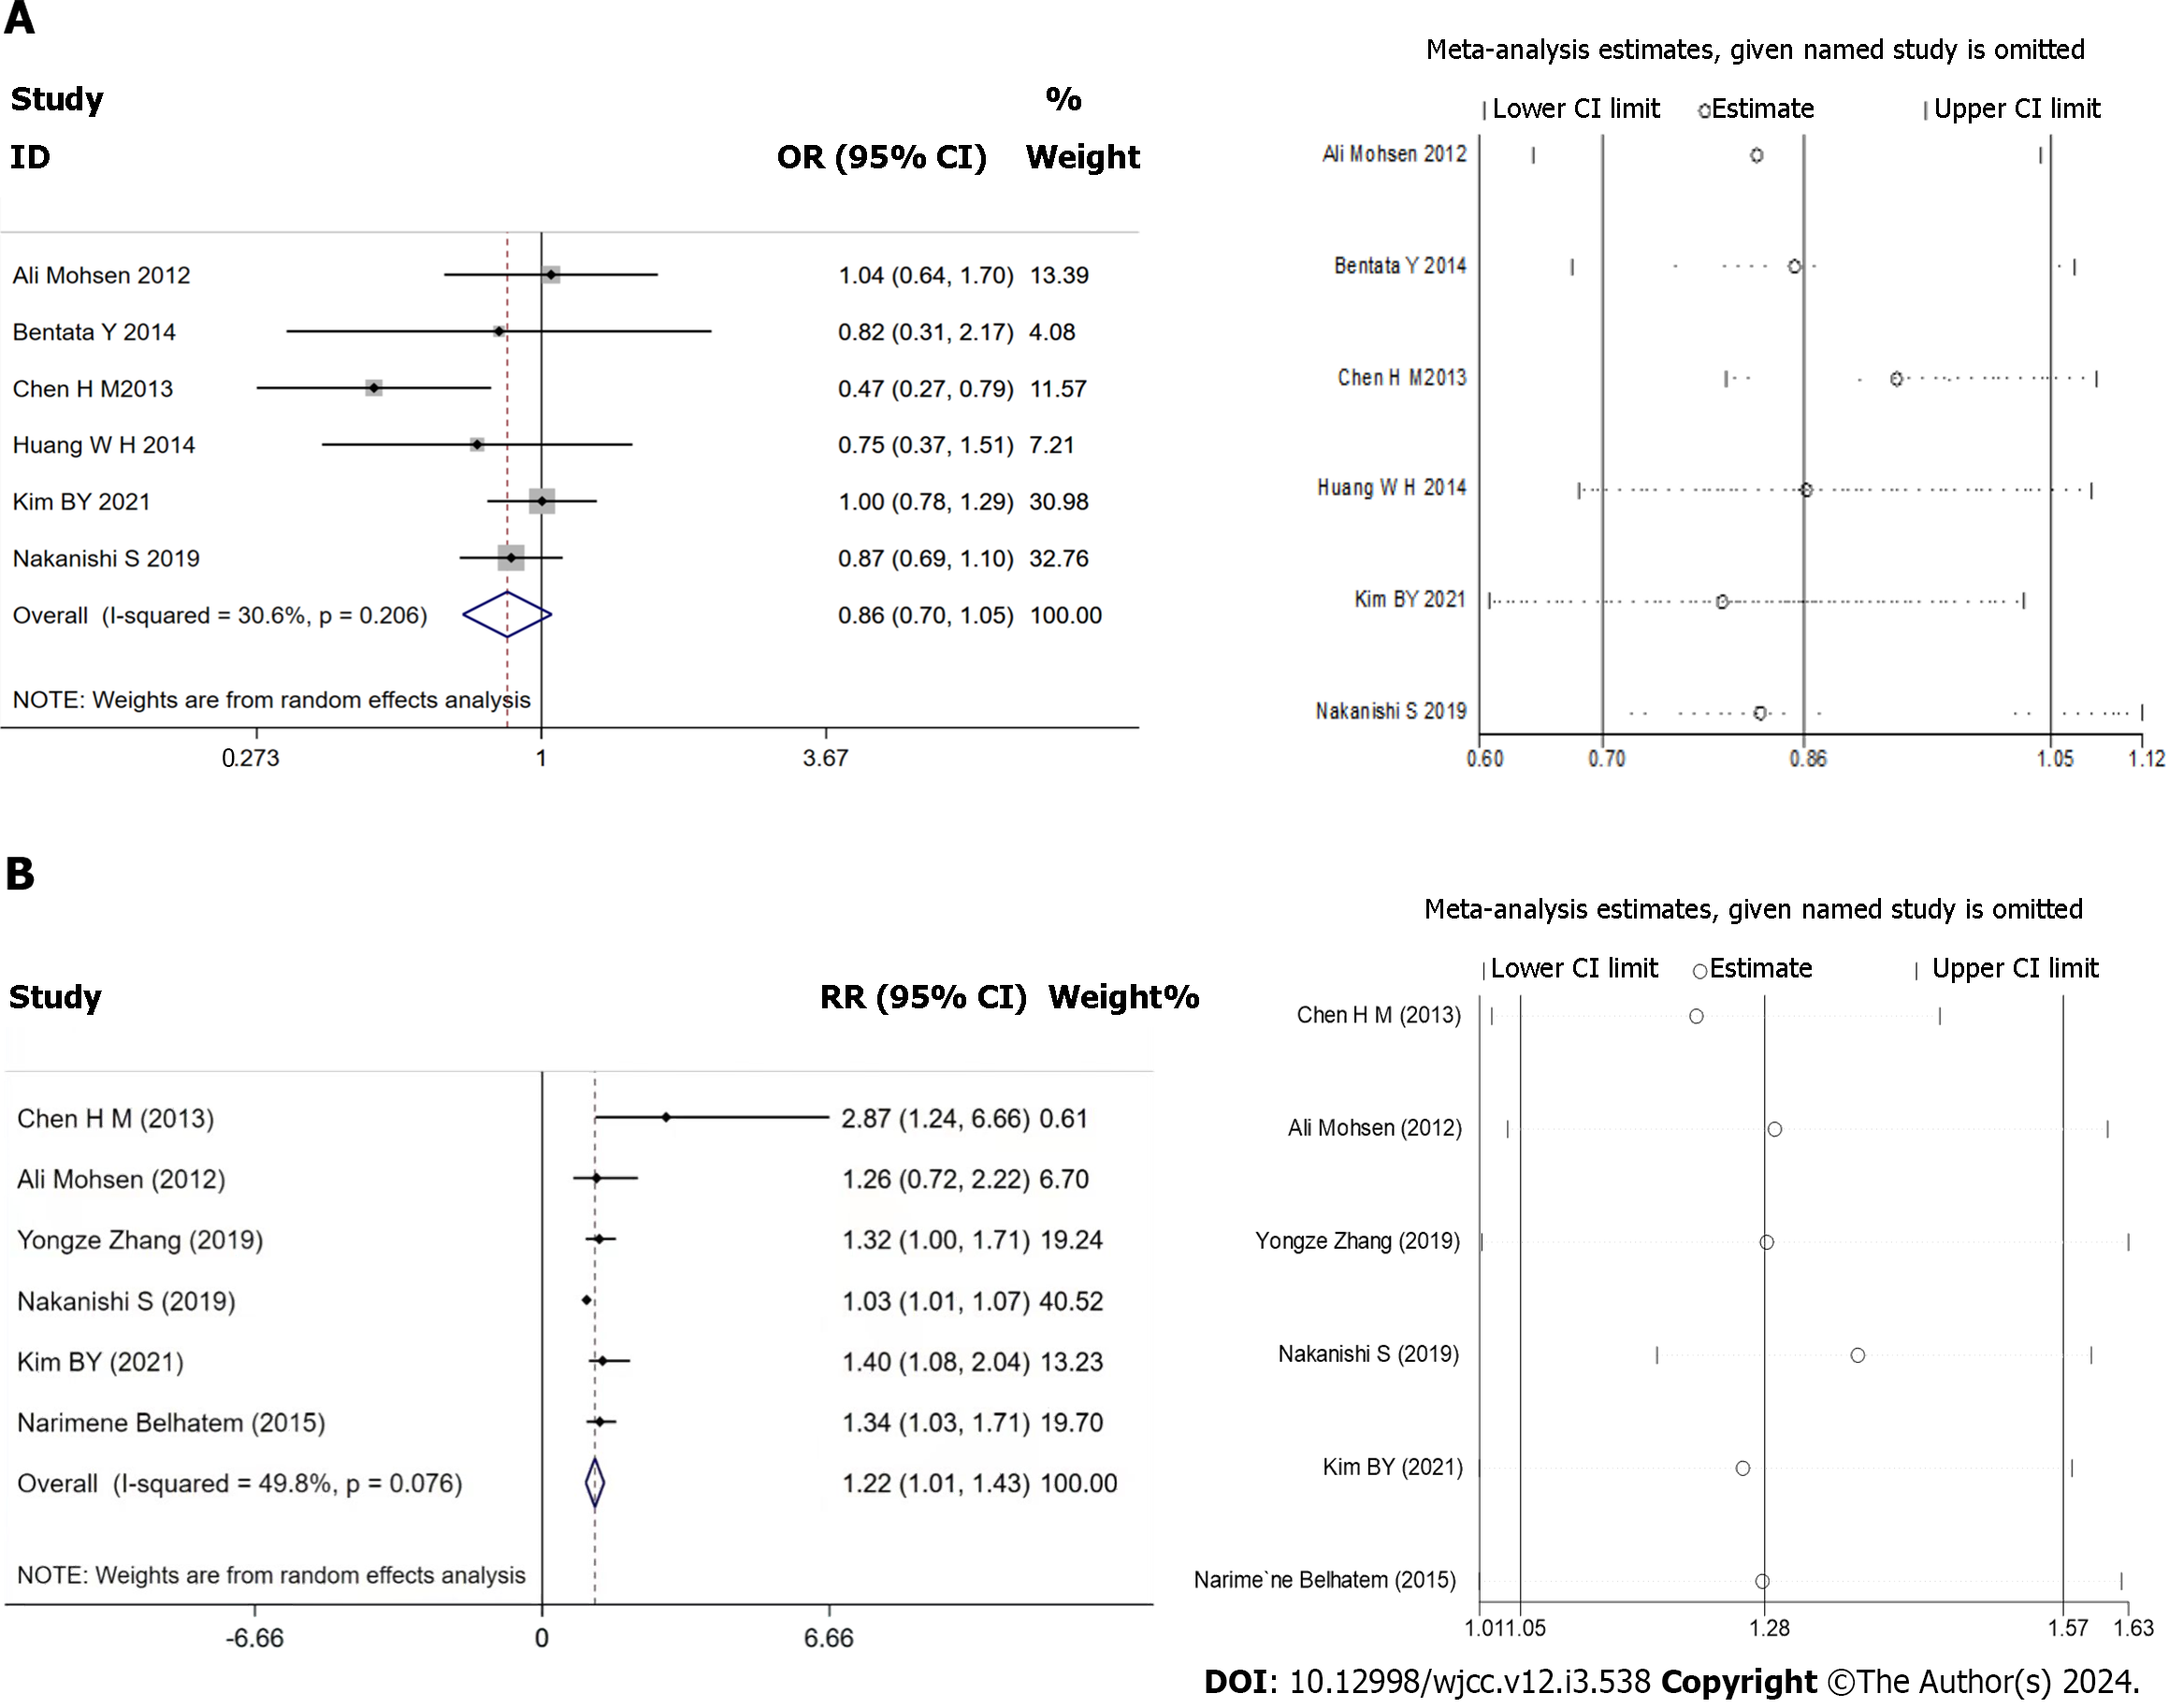
Figure 3 Forest plots of the kidney adverse events.
A: The incidence rate of kidney adverse events; B: The risk of kidney adverse events. OR: Odds ratio; RR: Relative risk; CI: Confidence interval.
- Citation: Wan JF, Chen Y, Yao TH, Wu YZ, Dai HZ. Impact of body mass index on adverse kidney events in diabetes mellitus patients: A systematic-review and meta-analysis. World J Clin Cases 2024; 12(3): 538-550
- URL: https://www.wjgnet.com/2307-8960/full/v12/i3/538.htm
- DOI: https://dx.doi.org/10.12998/wjcc.v12.i3.538


