Copyright
©The Author(s) 2024.
World J Clin Cases. Jan 26, 2024; 12(3): 517-524
Published online Jan 26, 2024. doi: 10.12998/wjcc.v12.i3.517
Published online Jan 26, 2024. doi: 10.12998/wjcc.v12.i3.517
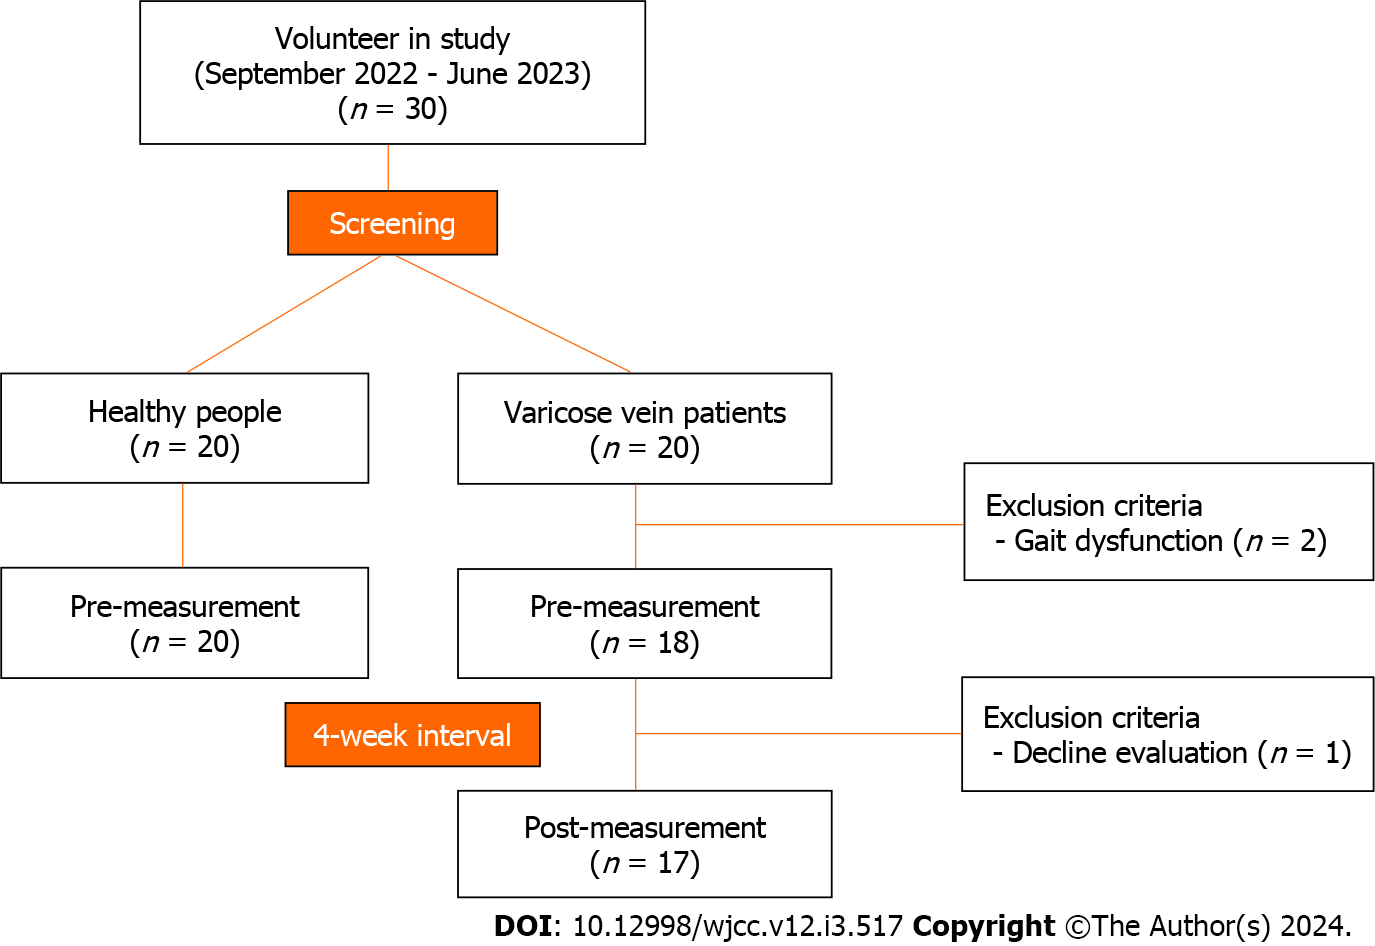
Figure 1 Flow diagram of study enrollment.
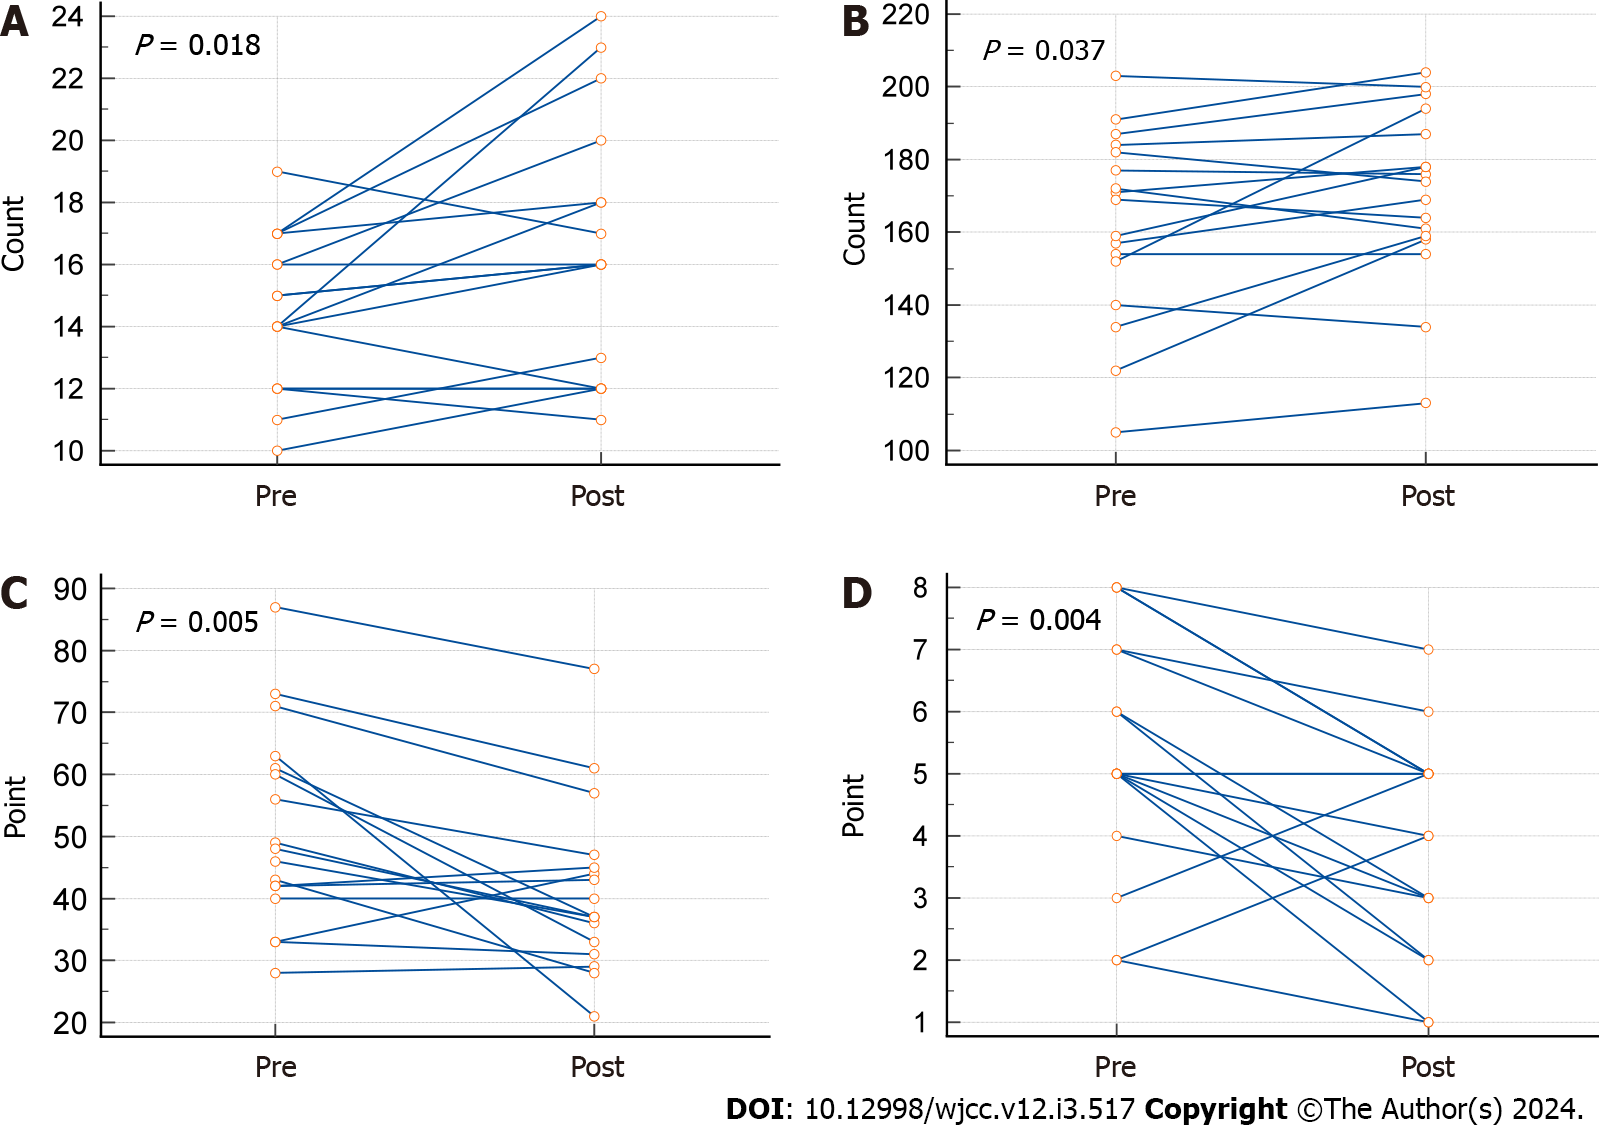
Figure 2 Difference between pre- and post-nonsurgical treatment by dot and line diagram.
A: 30s-cahir standing test; B: Two-minute step test; C: Quality of life; D: Visual analogue scale. dot, personal value; line, change before and after the nonsurgical treatment; pre, before the nonsurgical treatment; post, after the nonsurgical treatment.
- Citation: Kim GM, Kim B, Jang M, Park JH, Bae M, Lee CW, Kim JW, Huh U. Benefit in physical function and quality of life to nonsurgical treatment of varicose veins: Pilot study. World J Clin Cases 2024; 12(3): 517-524
- URL: https://www.wjgnet.com/2307-8960/full/v12/i3/517.htm
- DOI: https://dx.doi.org/10.12998/wjcc.v12.i3.517


