Copyright
©The Author(s) 2024.
World J Clin Cases. Jan 26, 2024; 12(3): 503-516
Published online Jan 26, 2024. doi: 10.12998/wjcc.v12.i3.503
Published online Jan 26, 2024. doi: 10.12998/wjcc.v12.i3.503
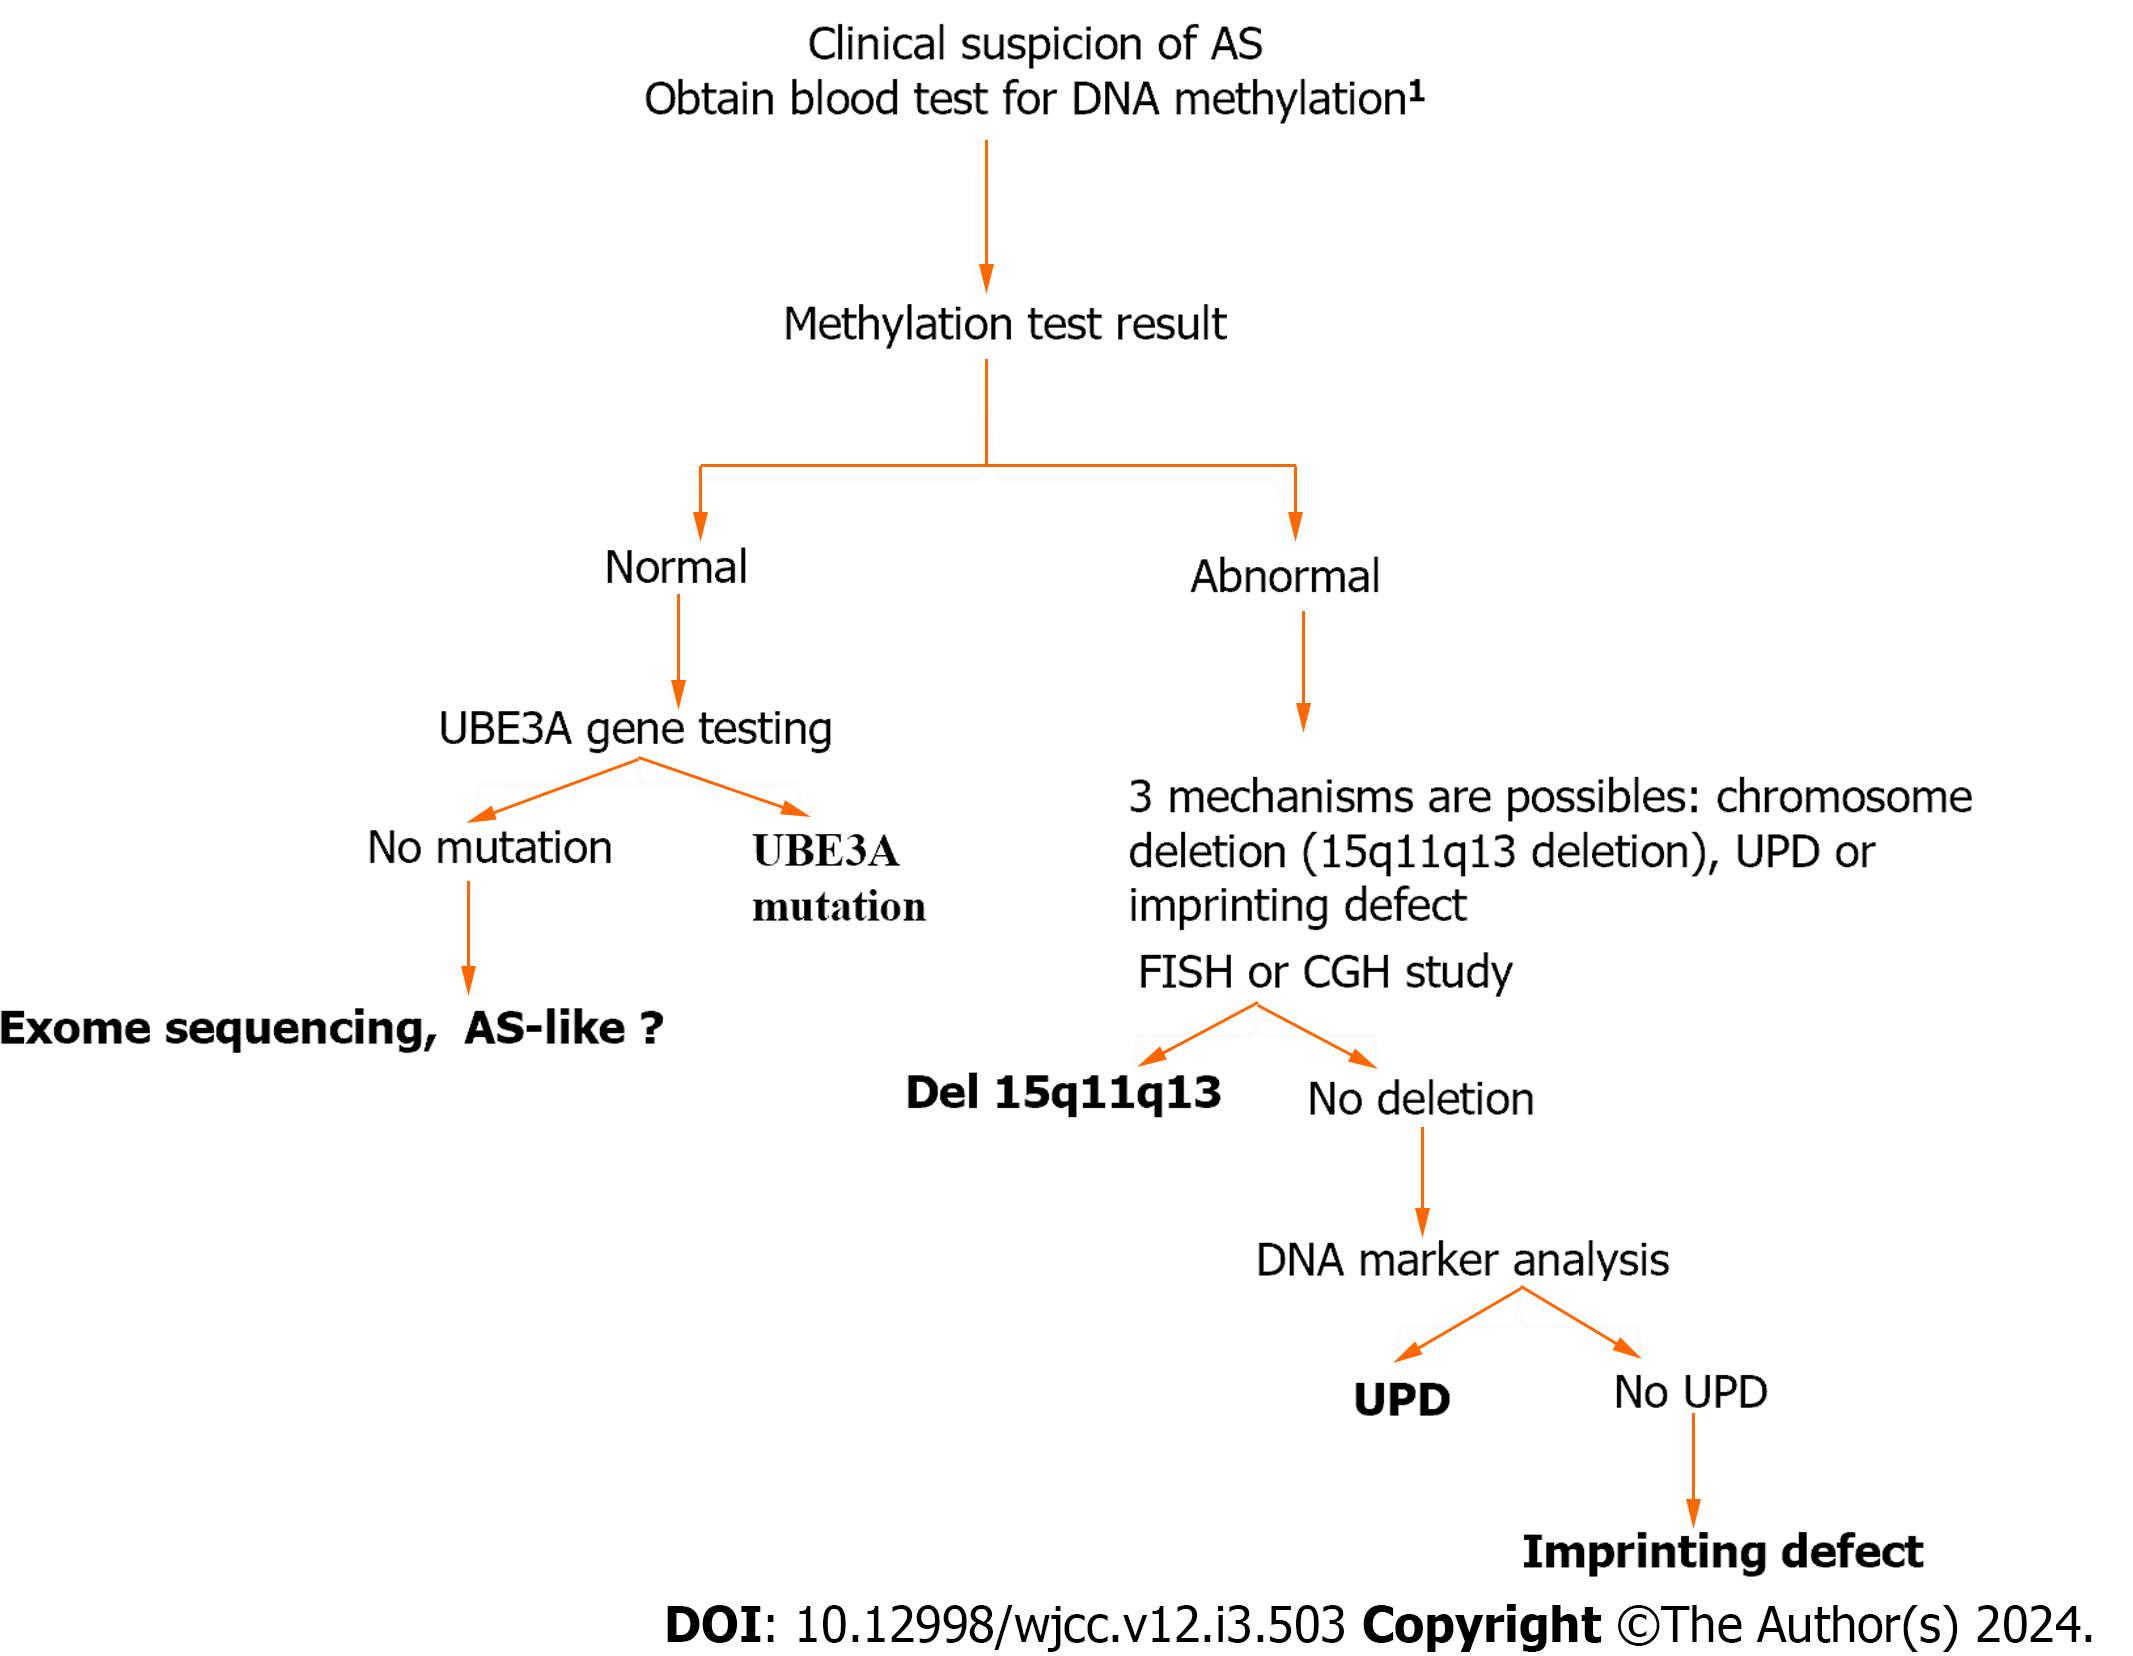
Figure 1 Simple algorithm shows the genetic testing in Angelman syndrome.
1Blood samples were collected for methylation analysis and Fluorescence in situ hybridization analysis at the same time. AS: Angelman syndrome; UPD: Uniparental disomy; UBE3A: Ubiquitin-protein ligase E3A.
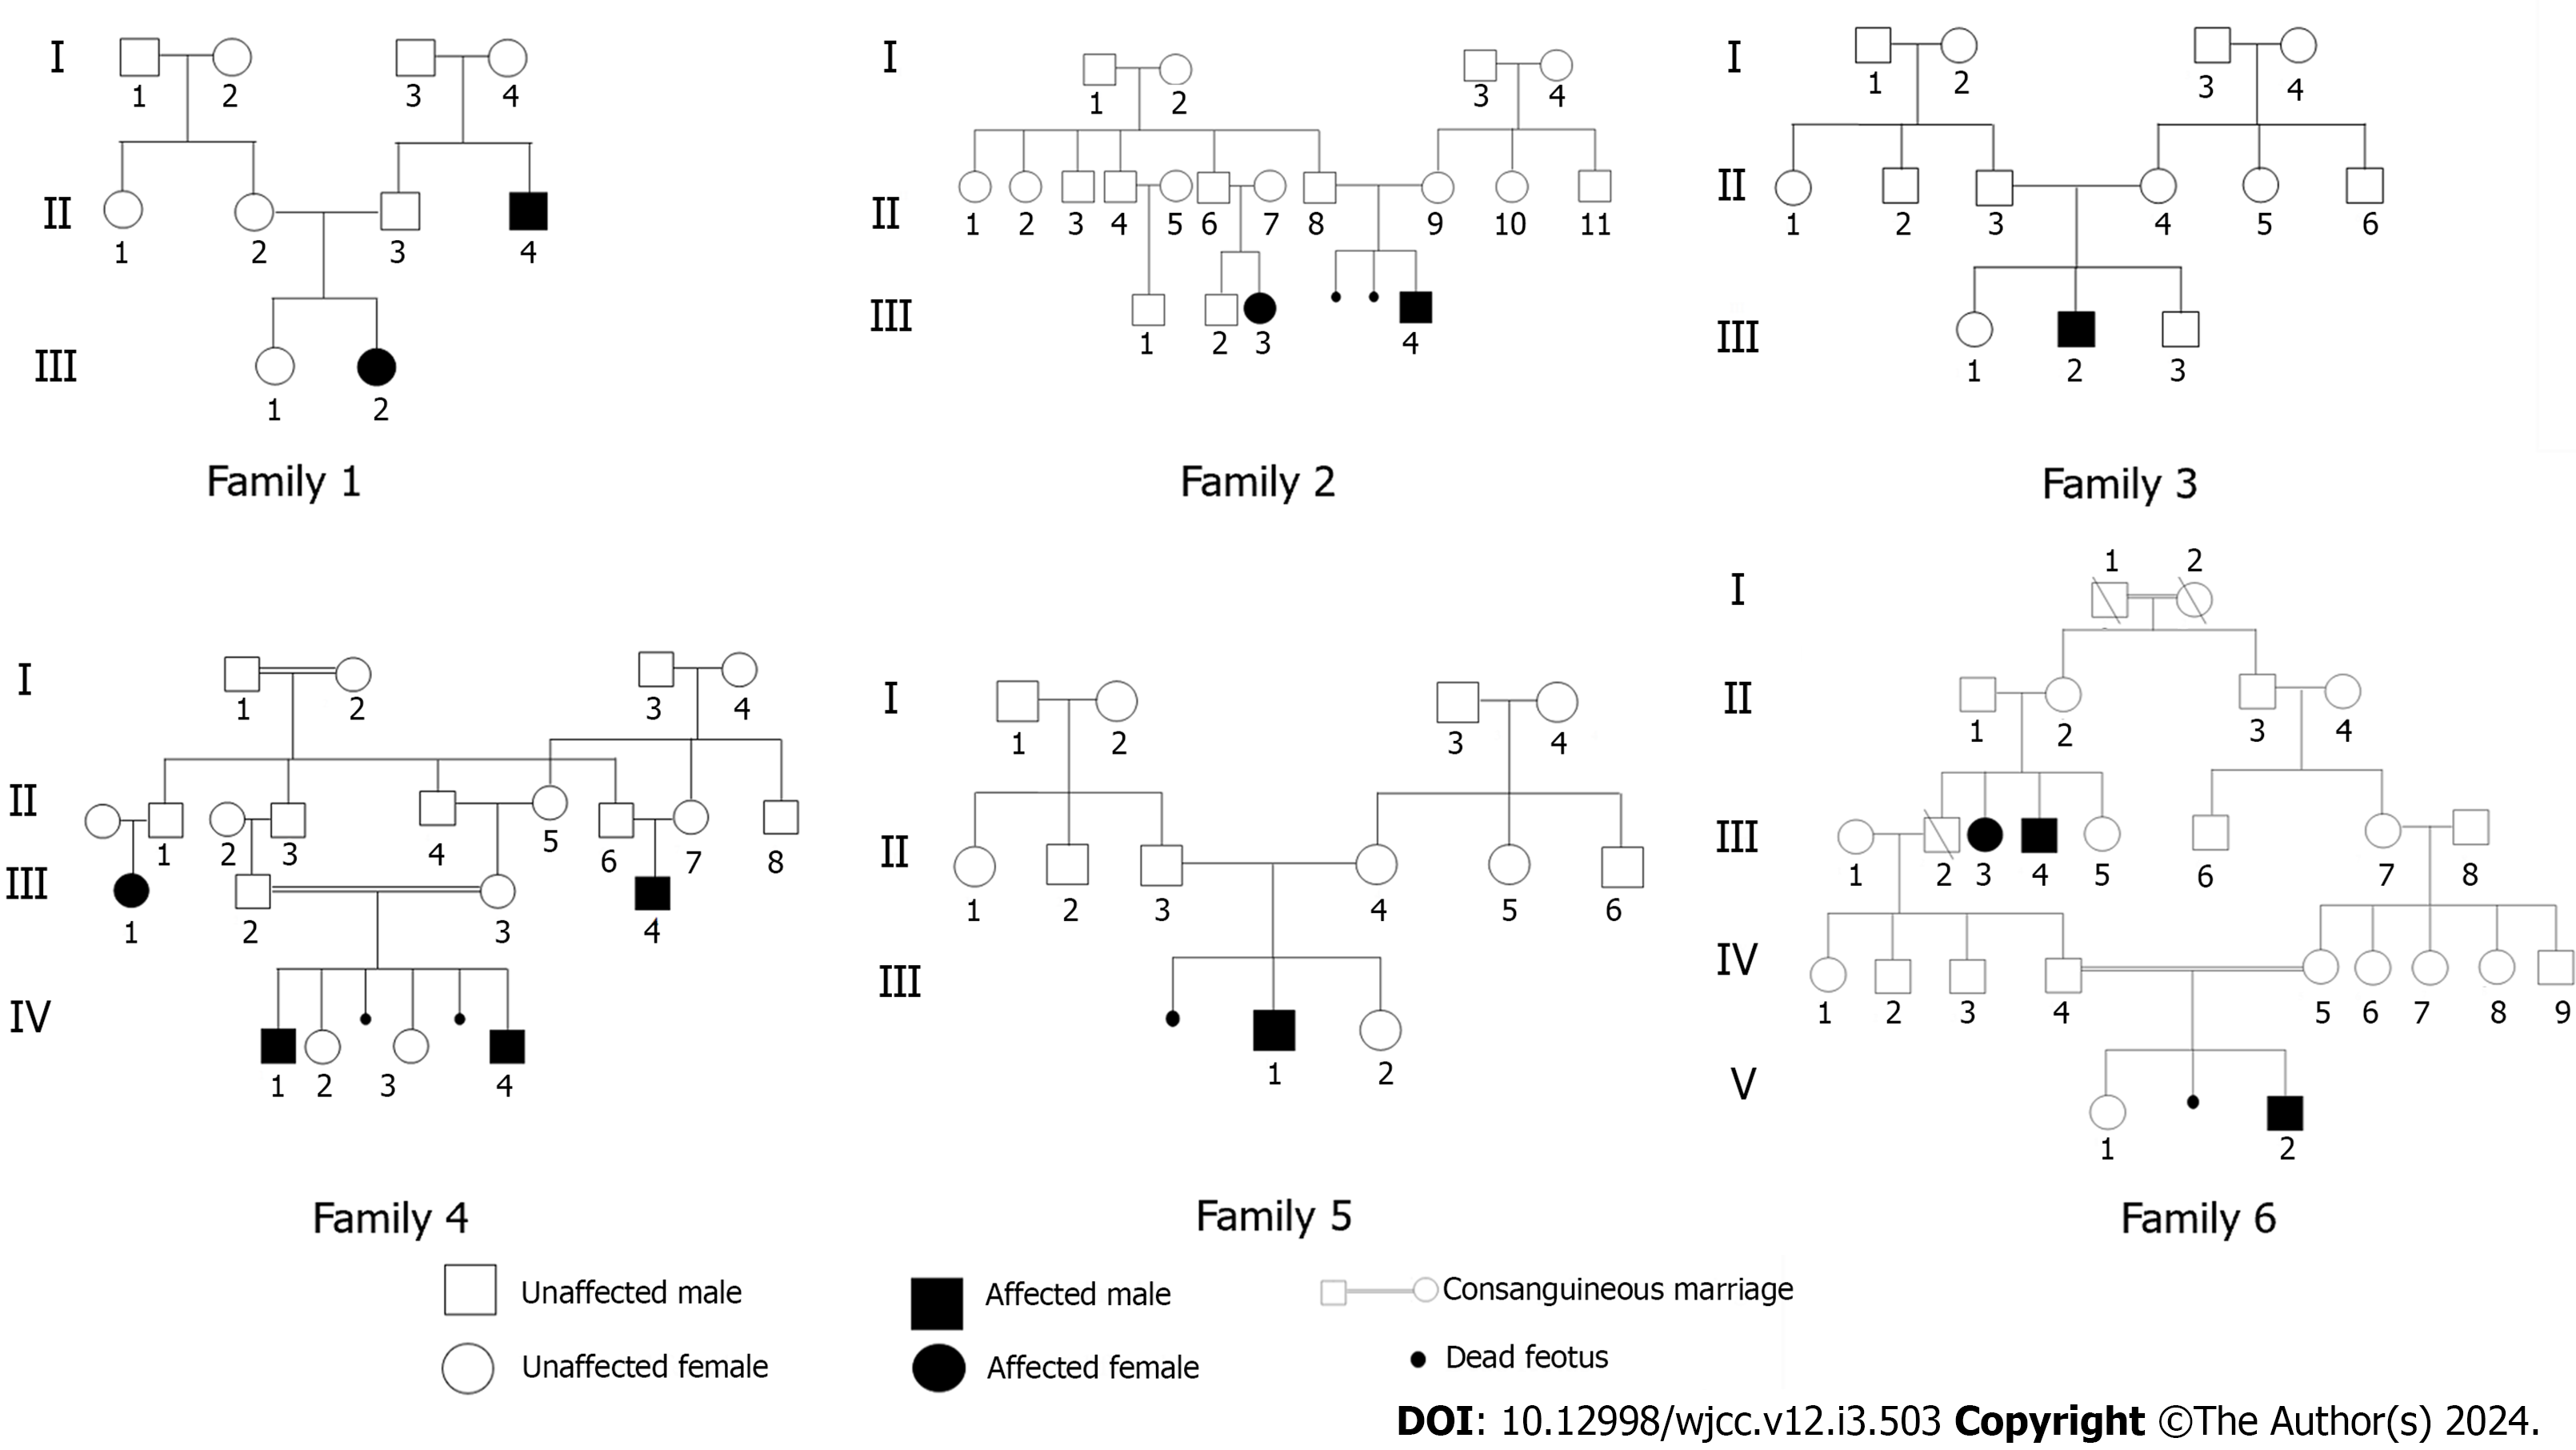
Figure 2 Pedigrees of familial Angelman syndrome cases.
Genotypes are shown for affected individuals indicated by black shading and for unaffected individuals who have been tested, squares represent males, circles represent females and a double line represents a consanguineous union.
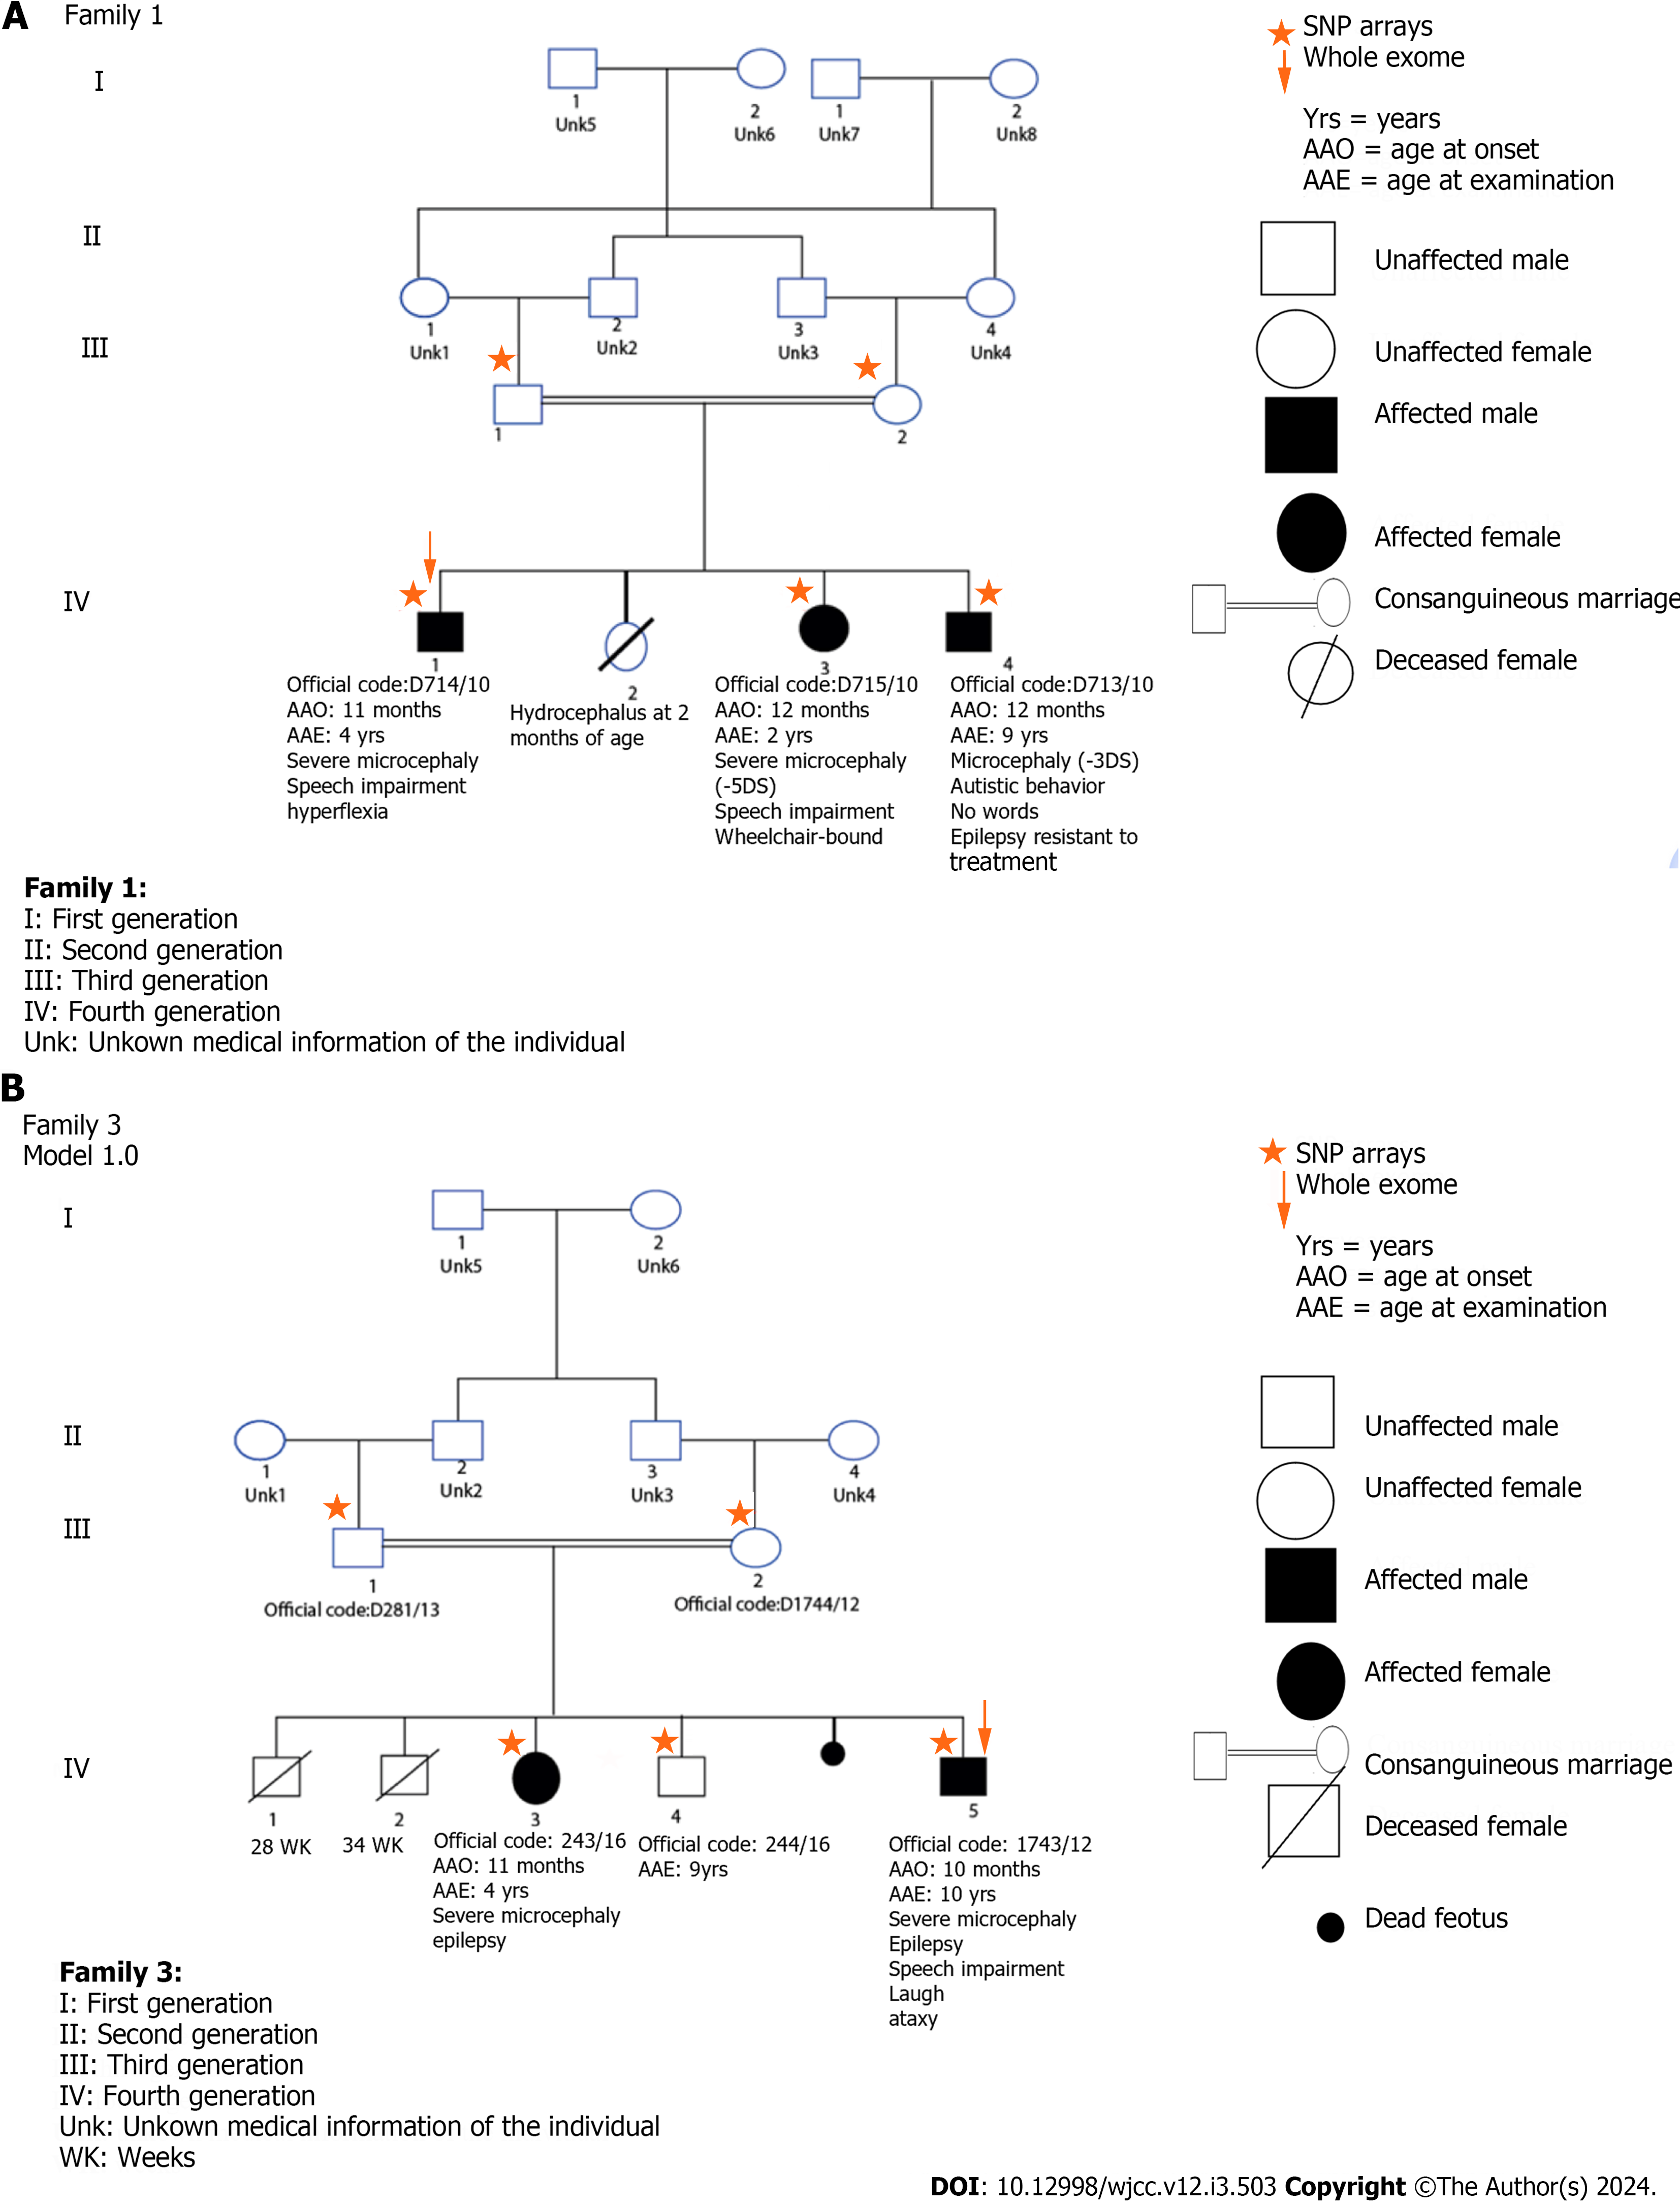
Figure 3 Family pedigree and variants segregation.
A: Family 1; B: Family 2. The orange arrow indicate patient screened by exome sequencing.
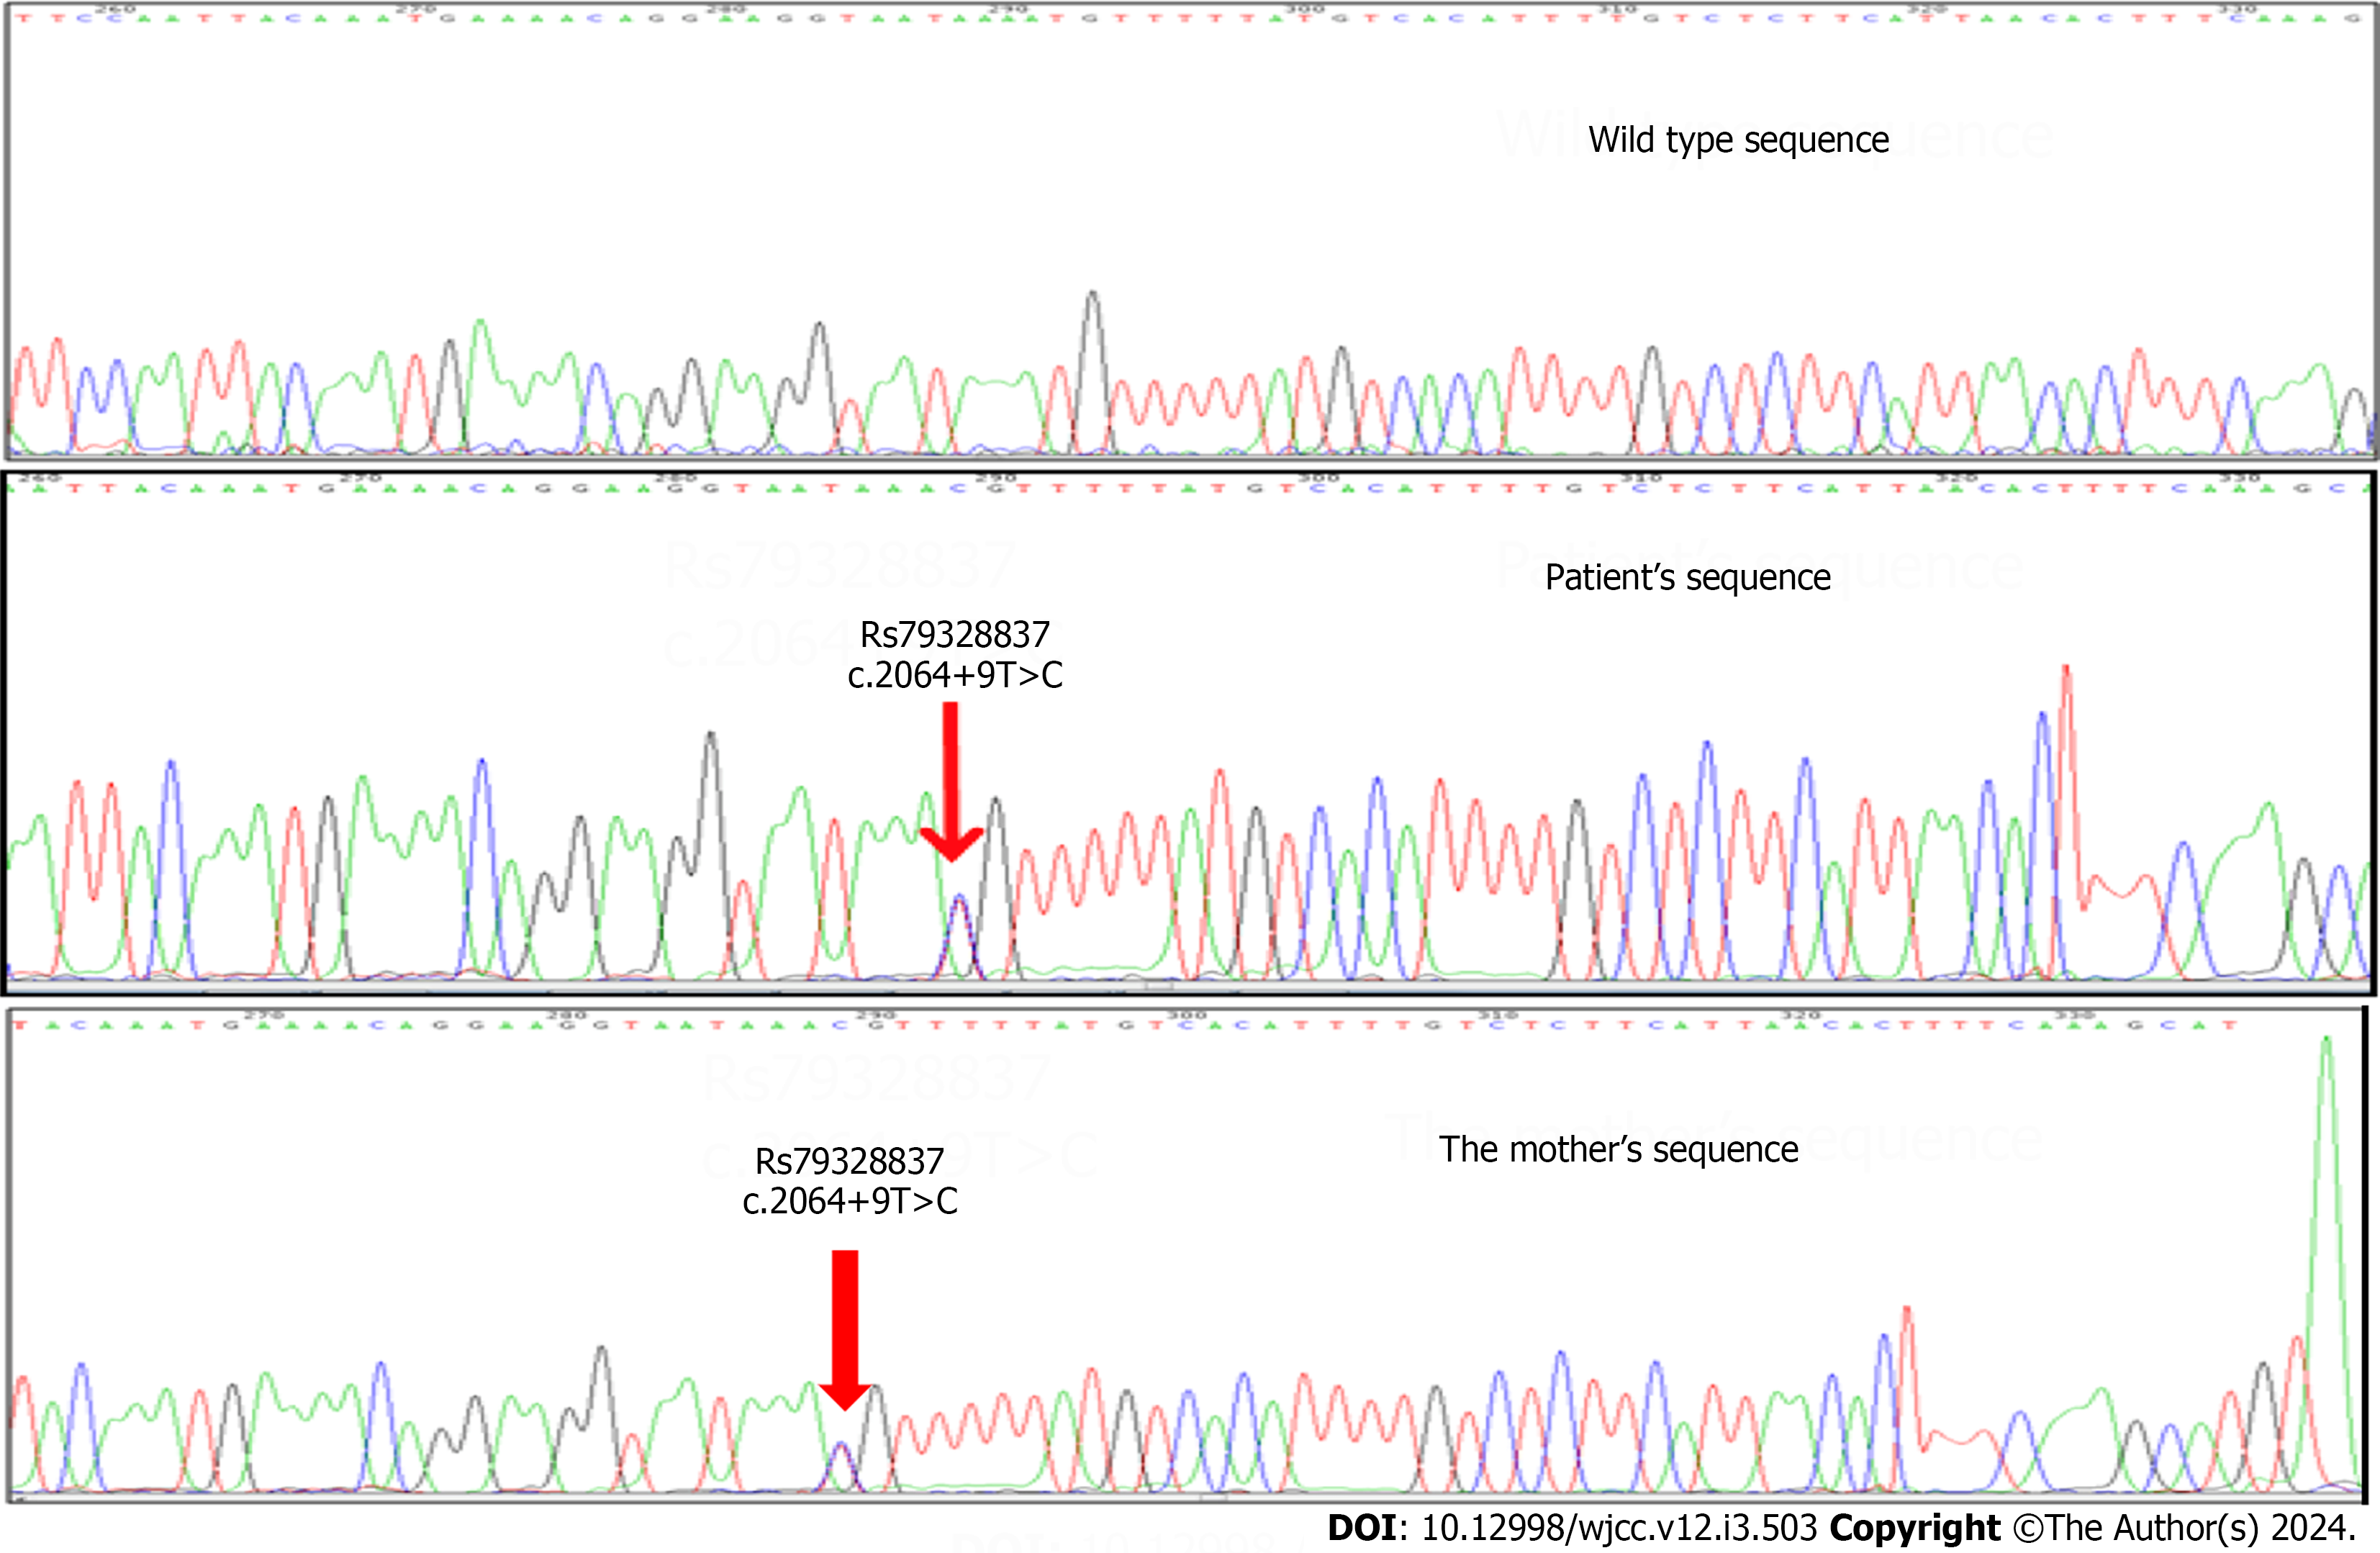
Figure 4 Chromatograph of a part of intron 13 sequence showing the c.
2064+9T>C polymorphism (RS79328837). Clinical significance: Benign allele with MAF: 0.002/10. The allele has no pathogenic effect.
Figure 5 Chromatograph of a part of exon 11 and intron 14 sequences in the same patient.
A: Chromatograph of a part of exon 11 sequence showing the c.1713A>G polymorphism (RS34670662). MAF: 0.025/127 and of the intron 14 sequence; B: Chromatograph showing the c.2221-40_2221-38delGTA (Rs149854051), MAF:0.054/270 in the same patient.
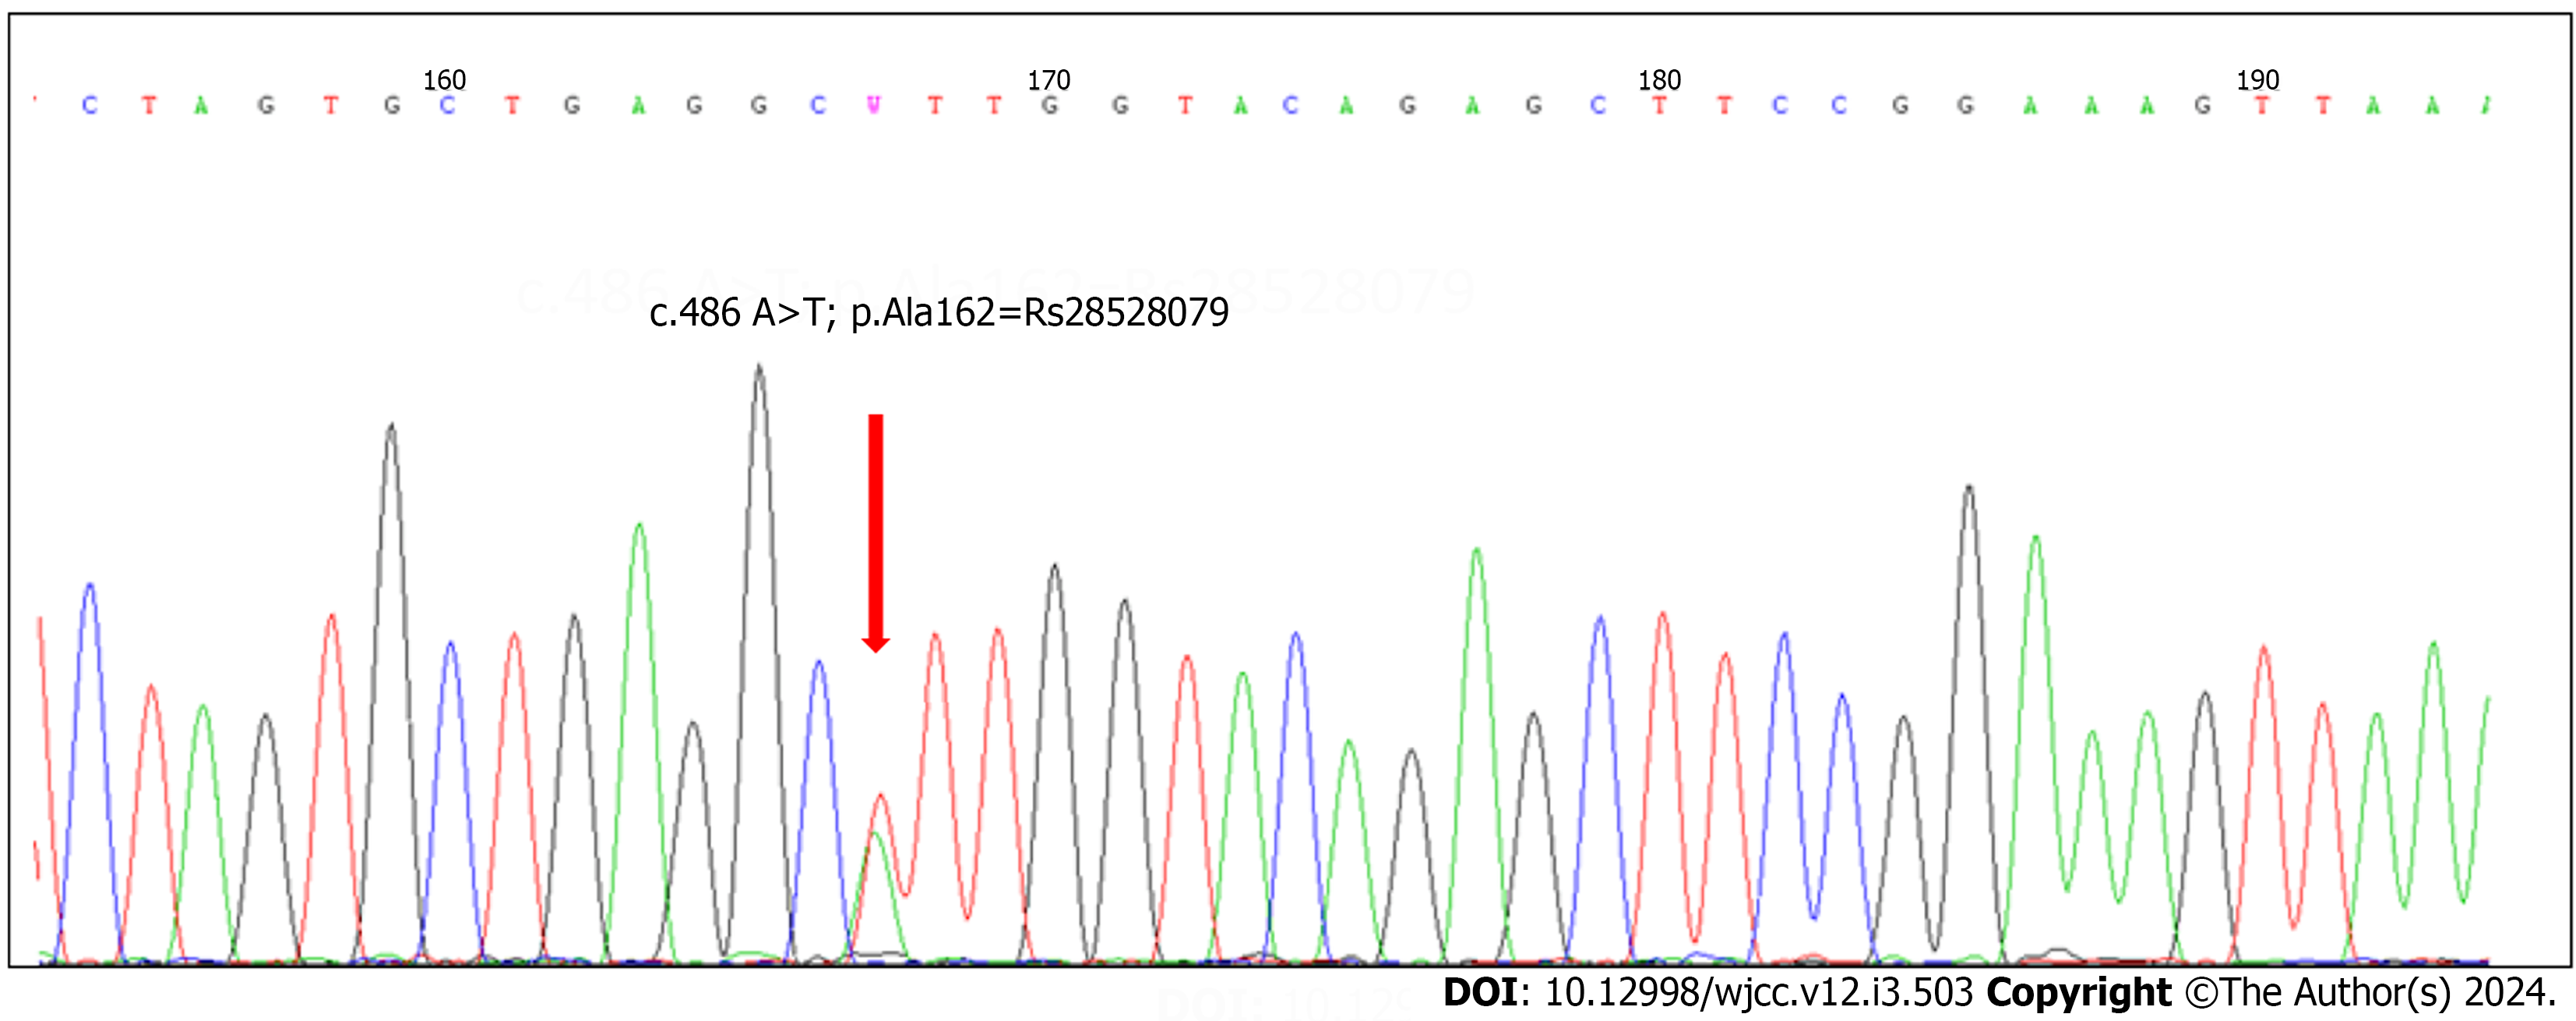
Figure 6 Chromatograph of a EXON 9 sequence showing the c.
486A>T; p.Ala162=Rs28528079. MAF/Minor Allele Count: A=0.0333/167.
- Citation: Manoubi W, Mahdouani M, Hmida D, Kdissa A, Rouissi A, Turki I, Gueddiche N, Soyah N, Saad A, Bouwkamp C, Elgersma Y, Mougou-Zerelli S, Gribaa M. Genetic investigation of the ubiquitin-protein ligase E3A gene as putative target in Angelman syndrome. World J Clin Cases 2024; 12(3): 503-516
- URL: https://www.wjgnet.com/2307-8960/full/v12/i3/503.htm
- DOI: https://dx.doi.org/10.12998/wjcc.v12.i3.503


