Copyright
©The Author(s) 2024.
World J Clin Cases. Oct 6, 2024; 12(28): 6222-6229
Published online Oct 6, 2024. doi: 10.12998/wjcc.v12.i28.6222
Published online Oct 6, 2024. doi: 10.12998/wjcc.v12.i28.6222
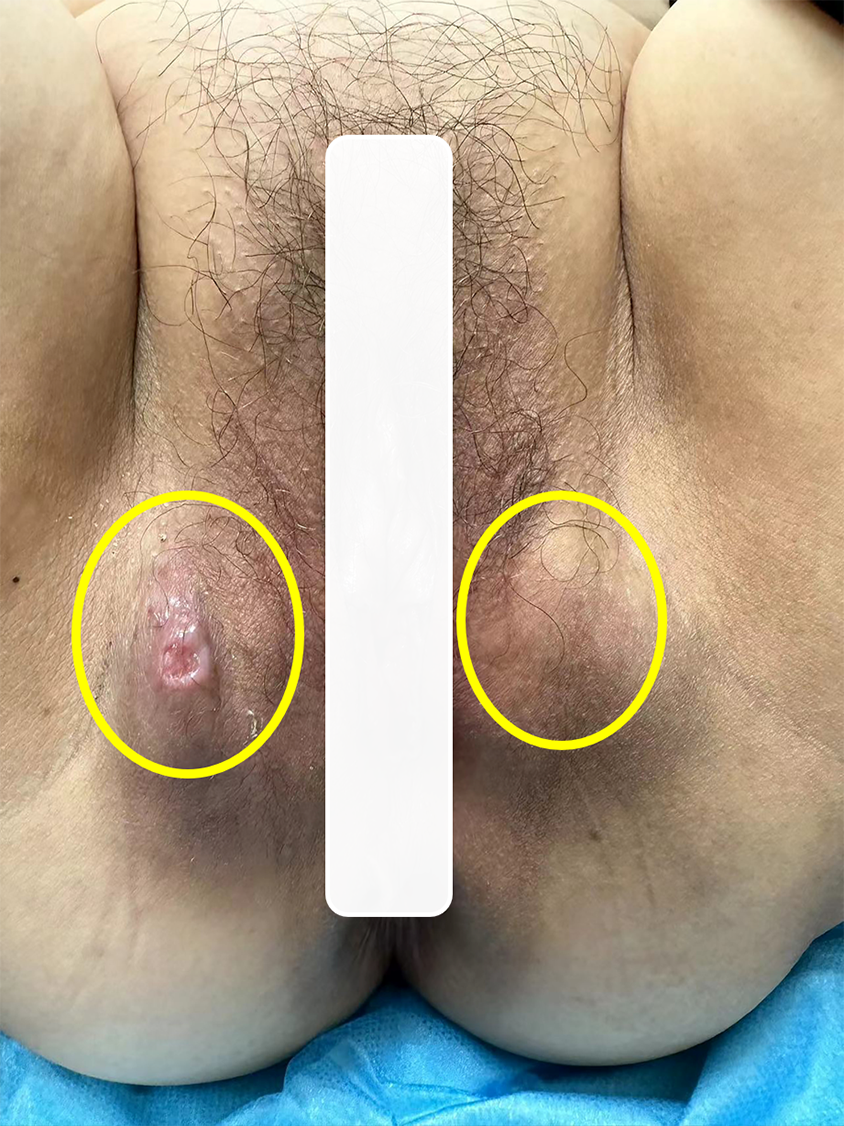
Figure 1 Photographs of the vulva and positron emission tomography/computed tomography images of the patient.
The gynecological examination revealed a 3.0 cm × 3.0cm × 2.0 cm mass in the right vulva region. On the skin surface, there was a vesicular area of approximately 0.5 cm × 0.5 cm, accompanied by a small amount of yellowish discharge. A 3.0 cm × 3.0 cm × 3.0 cm mass was identified in the left vulvar region.
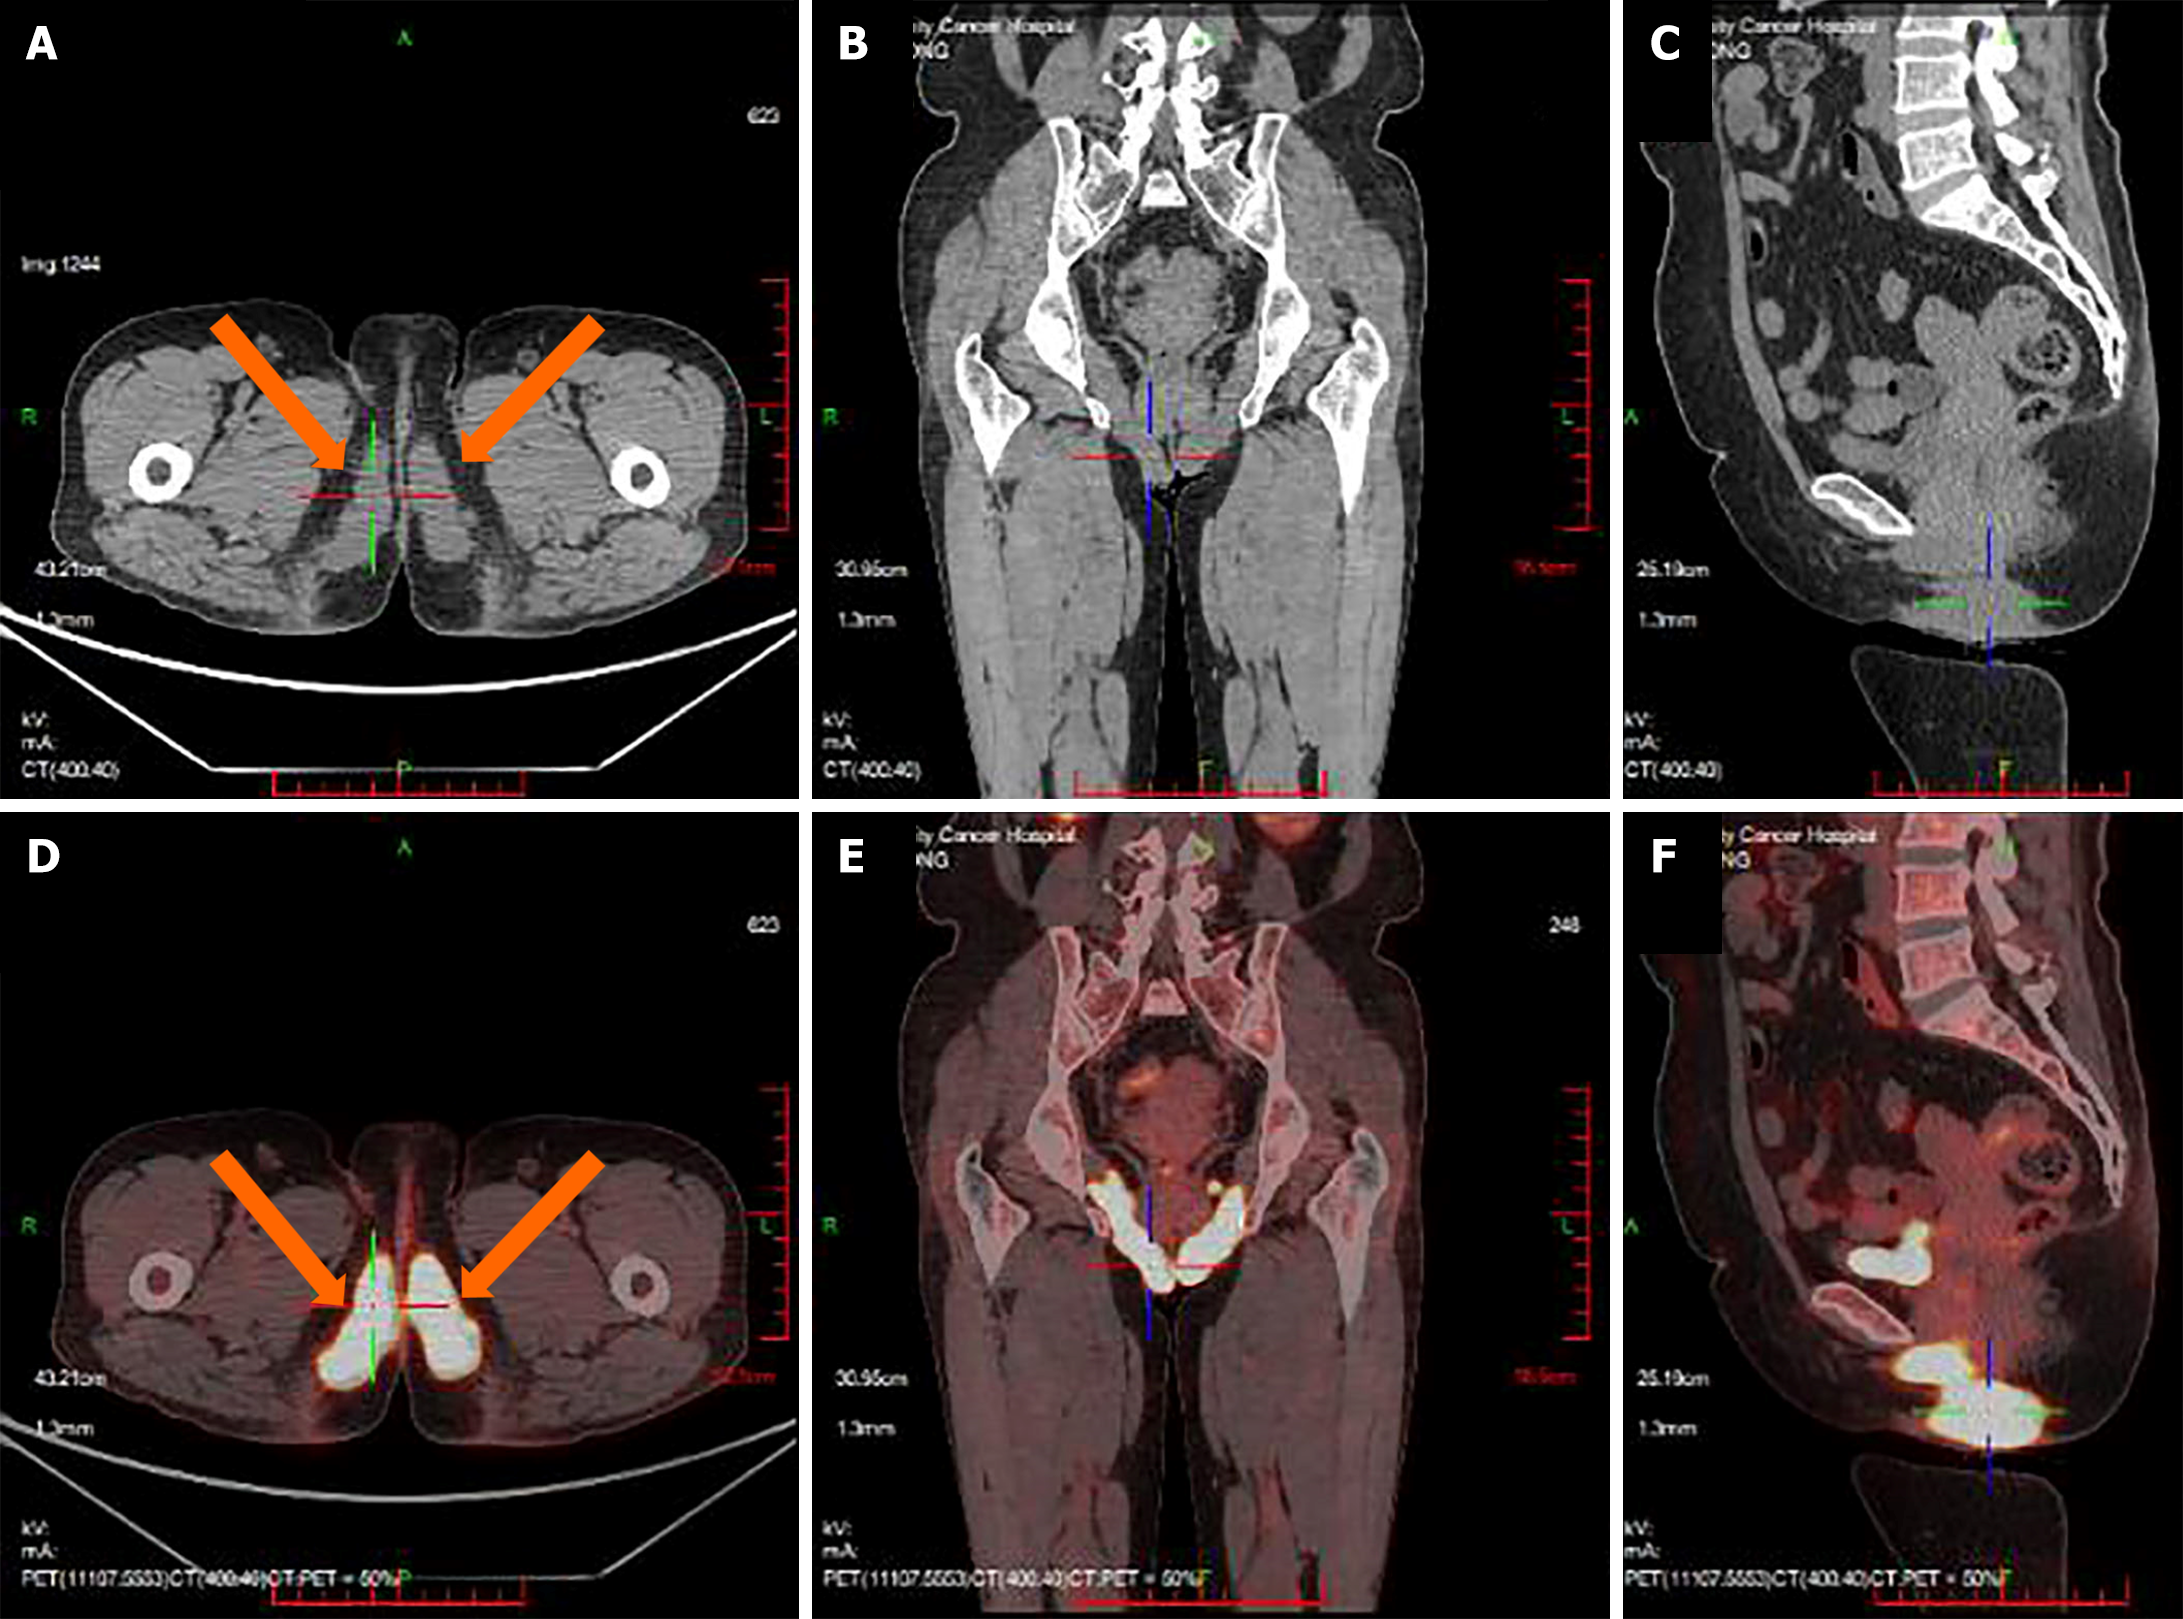
Figure 2 Photographs of the vulva and positron emission tomography/computed tomography images of the patient.
In the perineal area, striated, nodular soft-tissue shadows were observed, showing a symmetrically distributed "figure-of-eight" pattern. A: Cross-sectional computed tomography (CT) image of the perineal area; B: Coronal CT image of the perineal area; C: Sagittal CT image of perineal area; D: Cross-sectional functional imaging images of the perineal area; E: Coronal functional imaging images of the perineal area; F: Sagittal functional imaging images of the perineal area.
Figure 3 Pathology and immunohistochemical examination of the right vulvar mass.
A: Hematoxylin and eosin staining (100 ×); B: CD1a (100 ×); C: Langerin (100 ×).
Figure 4 Pelvic enhanced computed tomography imaging after chemotherapy.
A: Imaging was reviewed after two cycles of chemotherapy; B: Imaging was reviewed after four cycles of chemotherapy; C: Imaging was reviewed after six cycles of chemotherapy.
- Citation: Yuan CY, Zhang ZR, Guo MF, Zhang N. Recurrent multisystem Langerhans cell histiocytosis involving the female genitalia: A case report. World J Clin Cases 2024; 12(28): 6222-6229
- URL: https://www.wjgnet.com/2307-8960/full/v12/i28/6222.htm
- DOI: https://dx.doi.org/10.12998/wjcc.v12.i28.6222


