Copyright
©The Author(s) 2024.
World J Clin Cases. Sep 6, 2024; 12(25): 5775-5783
Published online Sep 6, 2024. doi: 10.12998/wjcc.v12.i25.5775
Published online Sep 6, 2024. doi: 10.12998/wjcc.v12.i25.5775
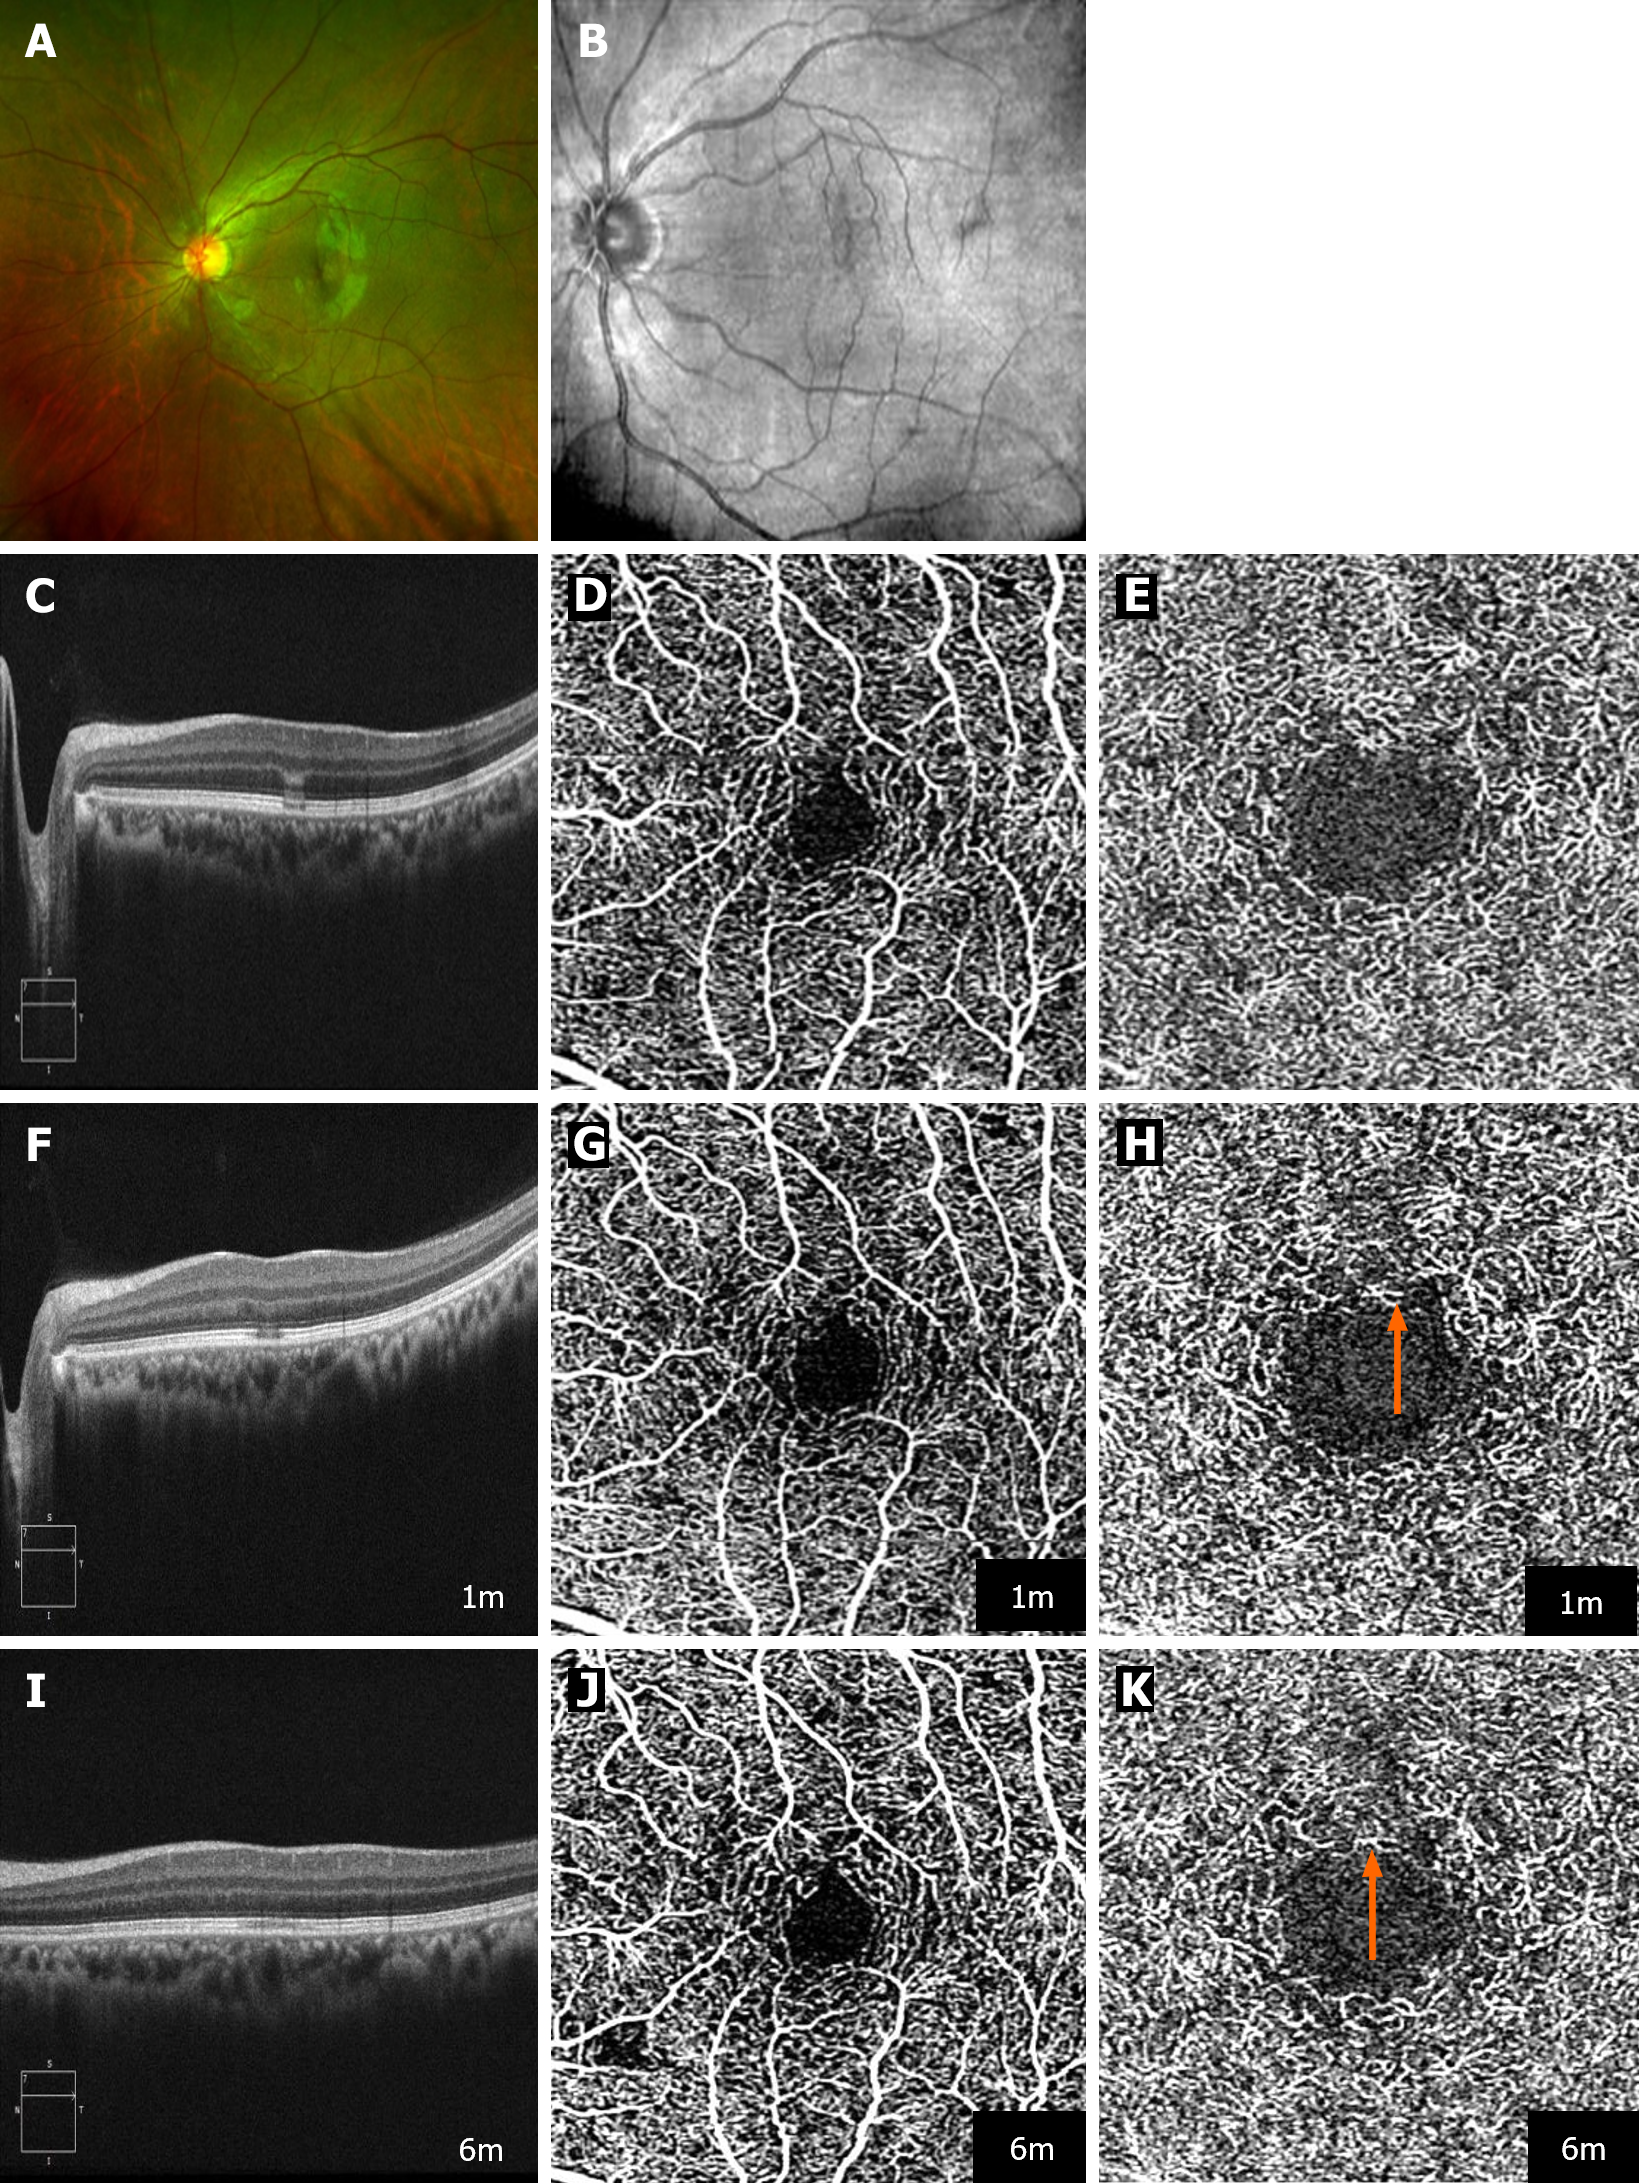
Figure 1 Multimodal imaging of the evolution of an acute macular neuroretinopathy lesion in the left eye of Case 1.
A: Ultra widefield pseudocolor fundus photography (Optos PLC, Dunfermline, Scotland, United Kingdom) shows a rugby ball-like lesion within the macular region; B: Near-infrared reflectance imaging of a hyporeflective lesion directed towards the macula; C, F and I: Sequential optical coherence tomography (OCT) B-scans shows the progression of the lesion. Initially, the images show a hyporeflective external limiting membrane, a hyperreflective myoid zone, and a hyporeflective ellipsoid zone (EZ), alongside the collapse of the outer plexiform layer with hyperreflective Henle's fiber layer and loss of the interdigitation zone (IZ). Follow-up at 1 mon reveals persistence of the hyporeflective EZ and deterioration in the IZ, which remains the sole impairment after 6 mon; D, G and J: Tracked OCT-angiography (OCTA) (Plex Elite 9000; Carl Zeiss Meditec, Inc., Dublin, CA, United States), targeting the superficial capillary plexus, indicating no observable flow signal deficits throughout the follow-up period; E, H and K: Tracked OCTA (Plex Elite 9000; Carl Zeiss Meditec, Inc.) at the deep capillary plexus level, showing an emergence and subsequent exacerbation of flow signal deficits (indicated by orange arrow) at 1 mo and 6 mo.
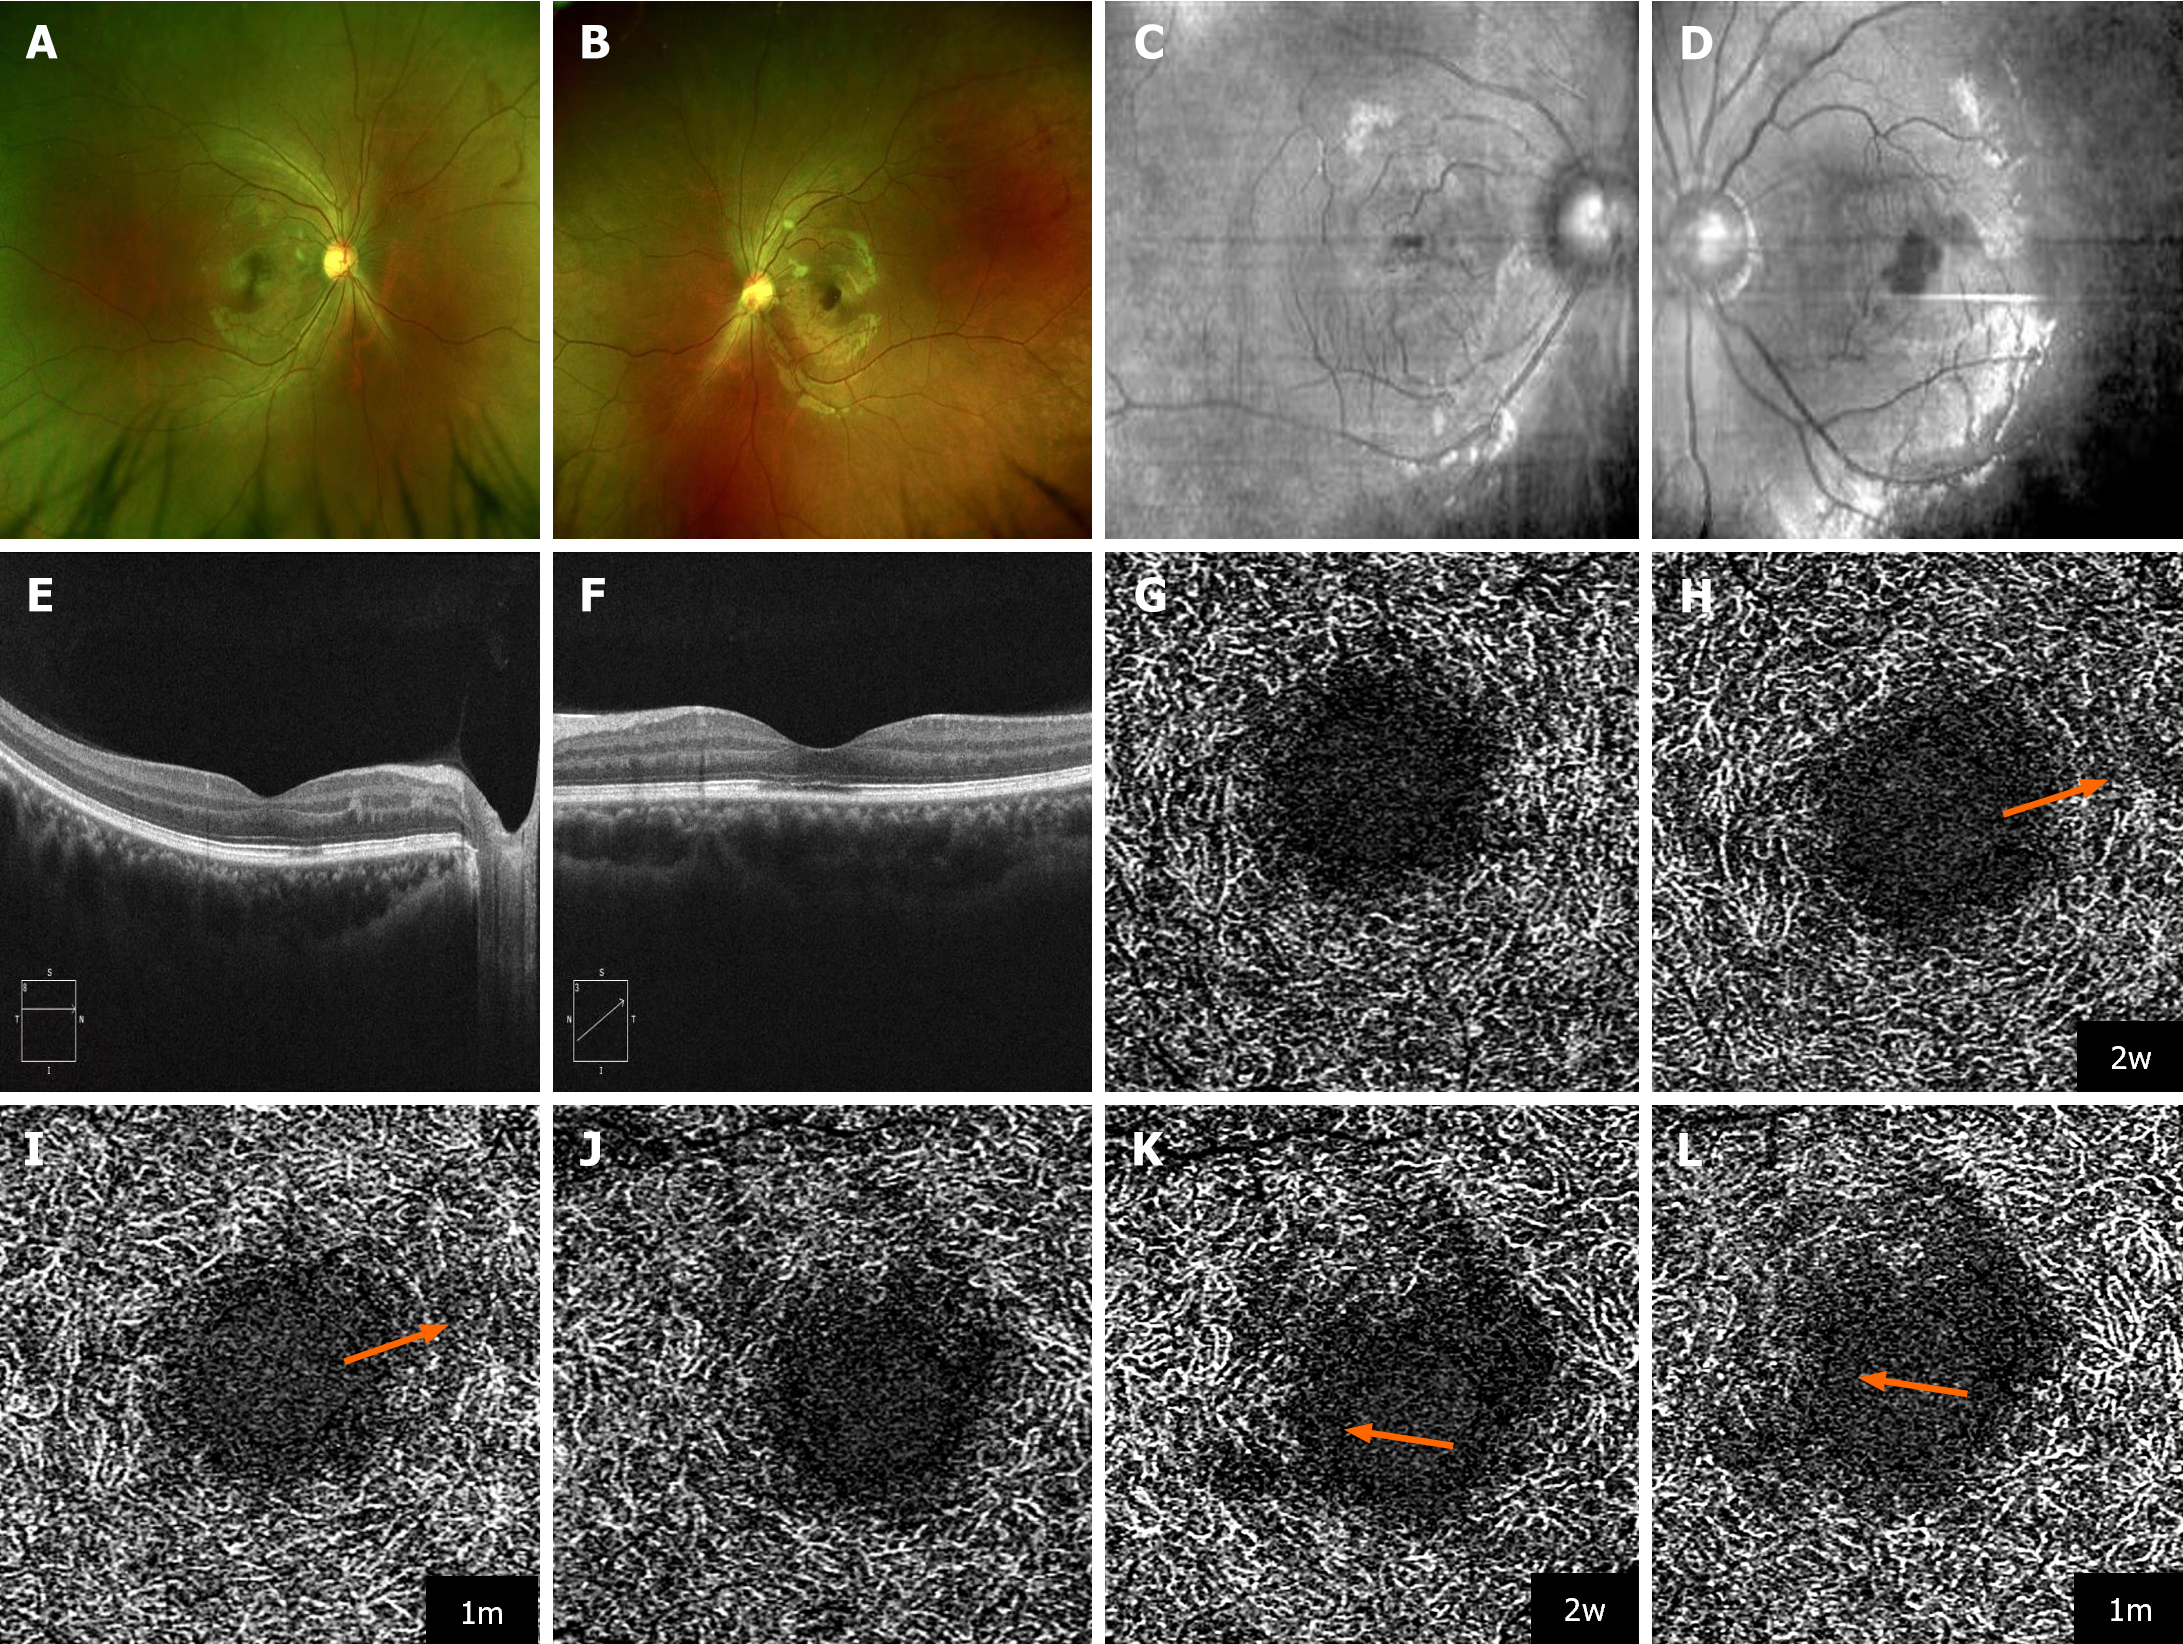
Figure 2 Multimodal imaging and deep capillary plexus flow signal evolution in acute macular neuroretinopathy in Case 2.
A and B: Ultrawide field pseudocolor fundus photography (Optos PLC, Dunfermline, Scotland, United Kingdom) shows scattered cotton-wool spots in both eyes; C and D. Near-infrared reflectance imaging shows hyporeflective lesions within the macular region; E and F. Optical coherence tomography (OCT) B-scans provide detailed visualization of hyperreflective foci within the outer plexiform layer and hyporeflective foci in the ellipsoid zone/interdigitation zone in both eyes, with additional hyperreflective foci observed in the inner nuclear layer of the right eye; G-I: Tracked OCT angiography (OCTA) (Plex Elite 9000; Carl Zeiss Meditec, Inc., Dublin, CA, United States), focused on the deep capillary plexus, reveals a gradual decrease in the flow signal (orange arrow) in the right eye in the follow-up period; J-L: Similar OCTA imaging of the deep capillary plexus for the left eye also shows progressive reduction in flow signal (orange arrow), underscoring the bilateral impact on vascular density over time.
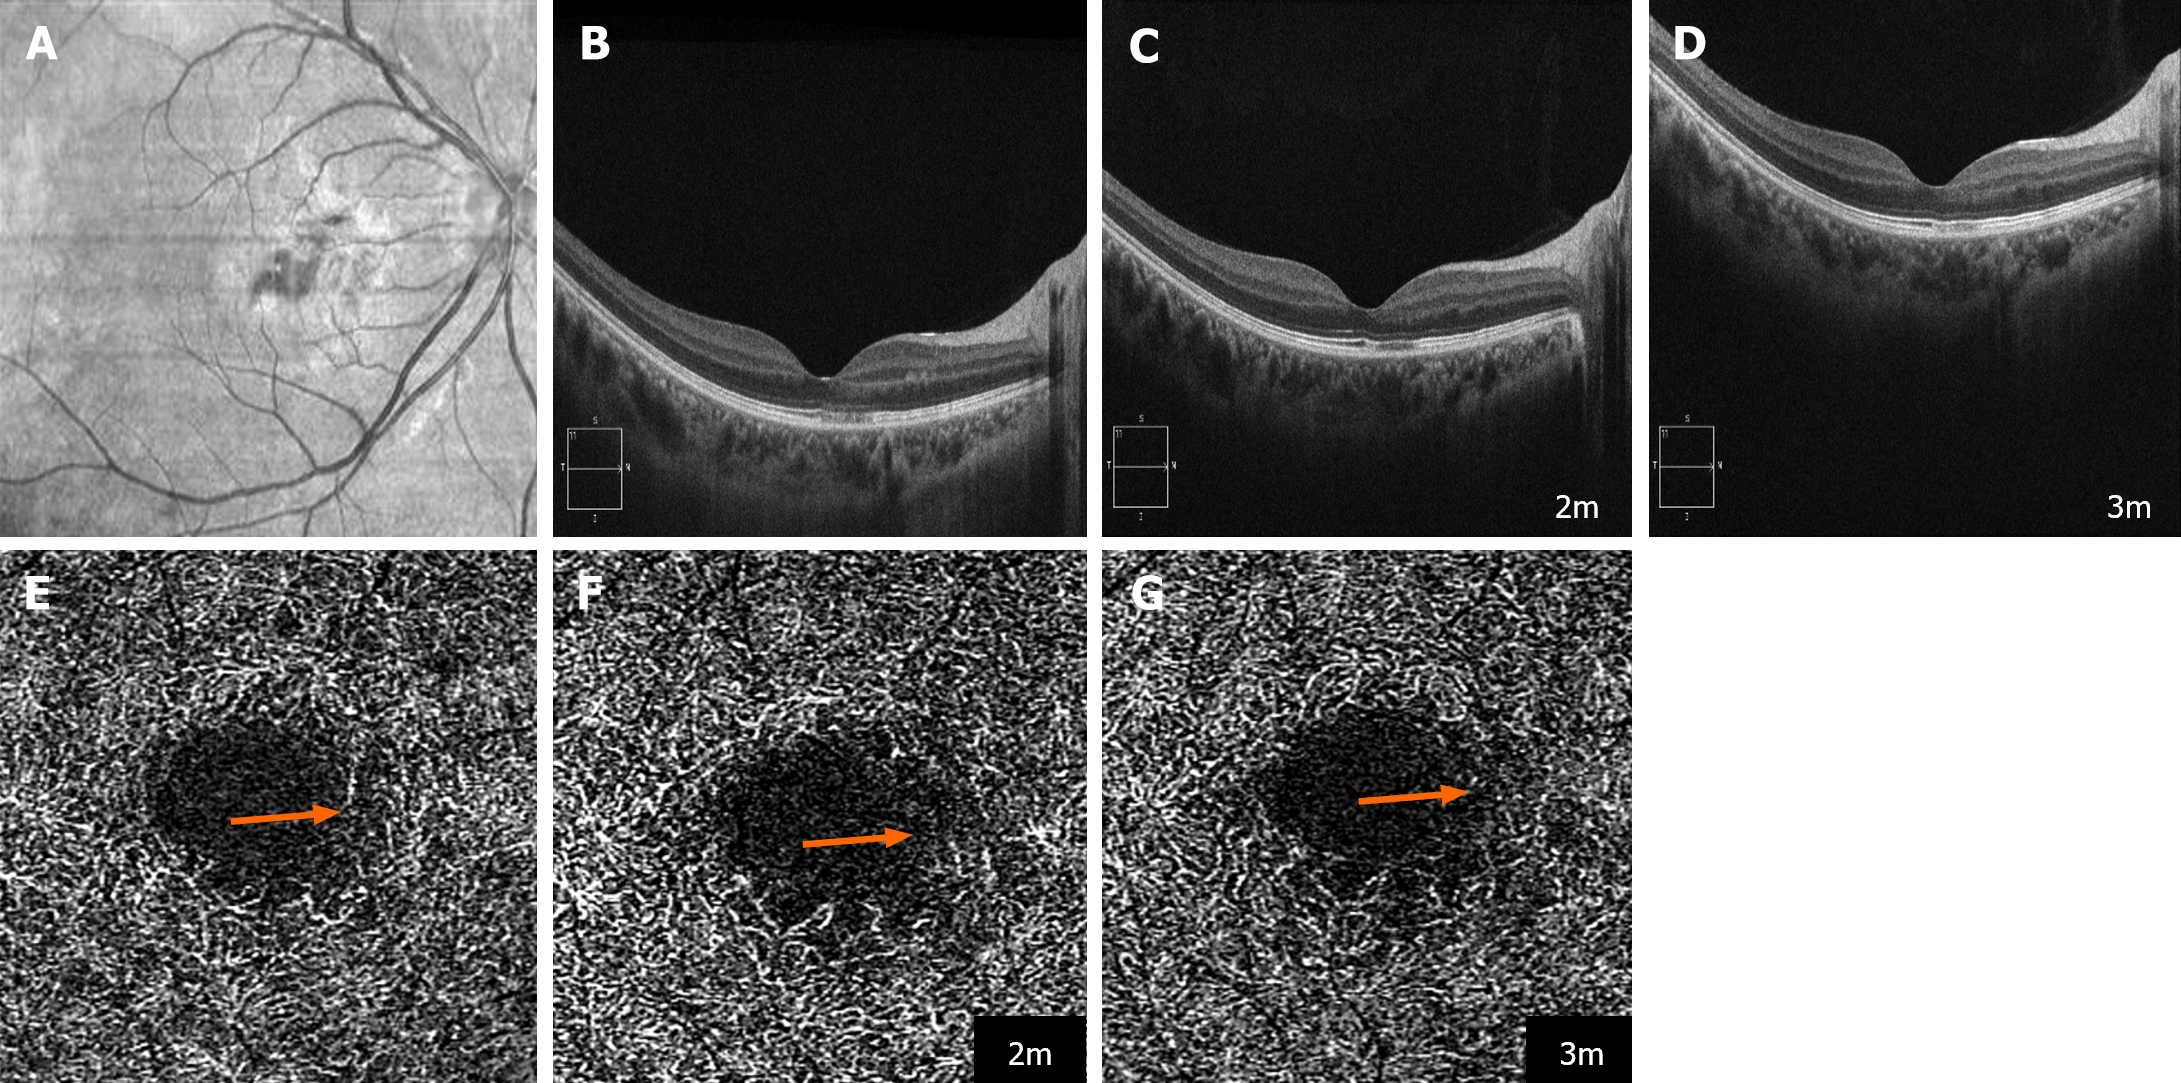
Figure 3 Multimodal imaging evolution of acute macular neuroretinopathy with paracentral acute middle maculopathy in the right eye of Case 3.
A: Near-infrared imaging shows hyporeflective lesions within the macular area, indicative of the interplay between acute macular neuroretinopathy and paracentral acute middle maculopathy; B-D: Sequential optical coherence tomography (OCT) B-scans detail the progression of the lesion. Initially, hyperreflective lesions in the outer plexiform layer coexist with hyporeflective lesions in the ellipsoid zone/interdigitation zone (IZ) and hyperreflective lesions in the inner nuclear layer within the macular region. By 2 mon, the lesions in the IZ transition to hyporeflective foci, a change that persisted in subsequent follow-up evaluations; E-G: Tracked OCT angiography (OCTA) (Plex Elite 9000; Carl Zeiss Meditec, Inc., Dublin, CA, United States), targeting the deep capillary plexus, illustrates a gradual reduction in the flow signal (indicated by orange arrow), signifying a decrease in vascular density over the course of the follow-up.
- Citation: Bi C, Huang CM, Shi YQ, Huang C, Yu T. Acute macular neuroretinopathy following COVID-19 infection: Three case reports. World J Clin Cases 2024; 12(25): 5775-5783
- URL: https://www.wjgnet.com/2307-8960/full/v12/i25/5775.htm
- DOI: https://dx.doi.org/10.12998/wjcc.v12.i25.5775


