Copyright
©The Author(s) 2024.
World J Clin Cases. Aug 26, 2024; 12(24): 5568-5582
Published online Aug 26, 2024. doi: 10.12998/wjcc.v12.i24.5568
Published online Aug 26, 2024. doi: 10.12998/wjcc.v12.i24.5568
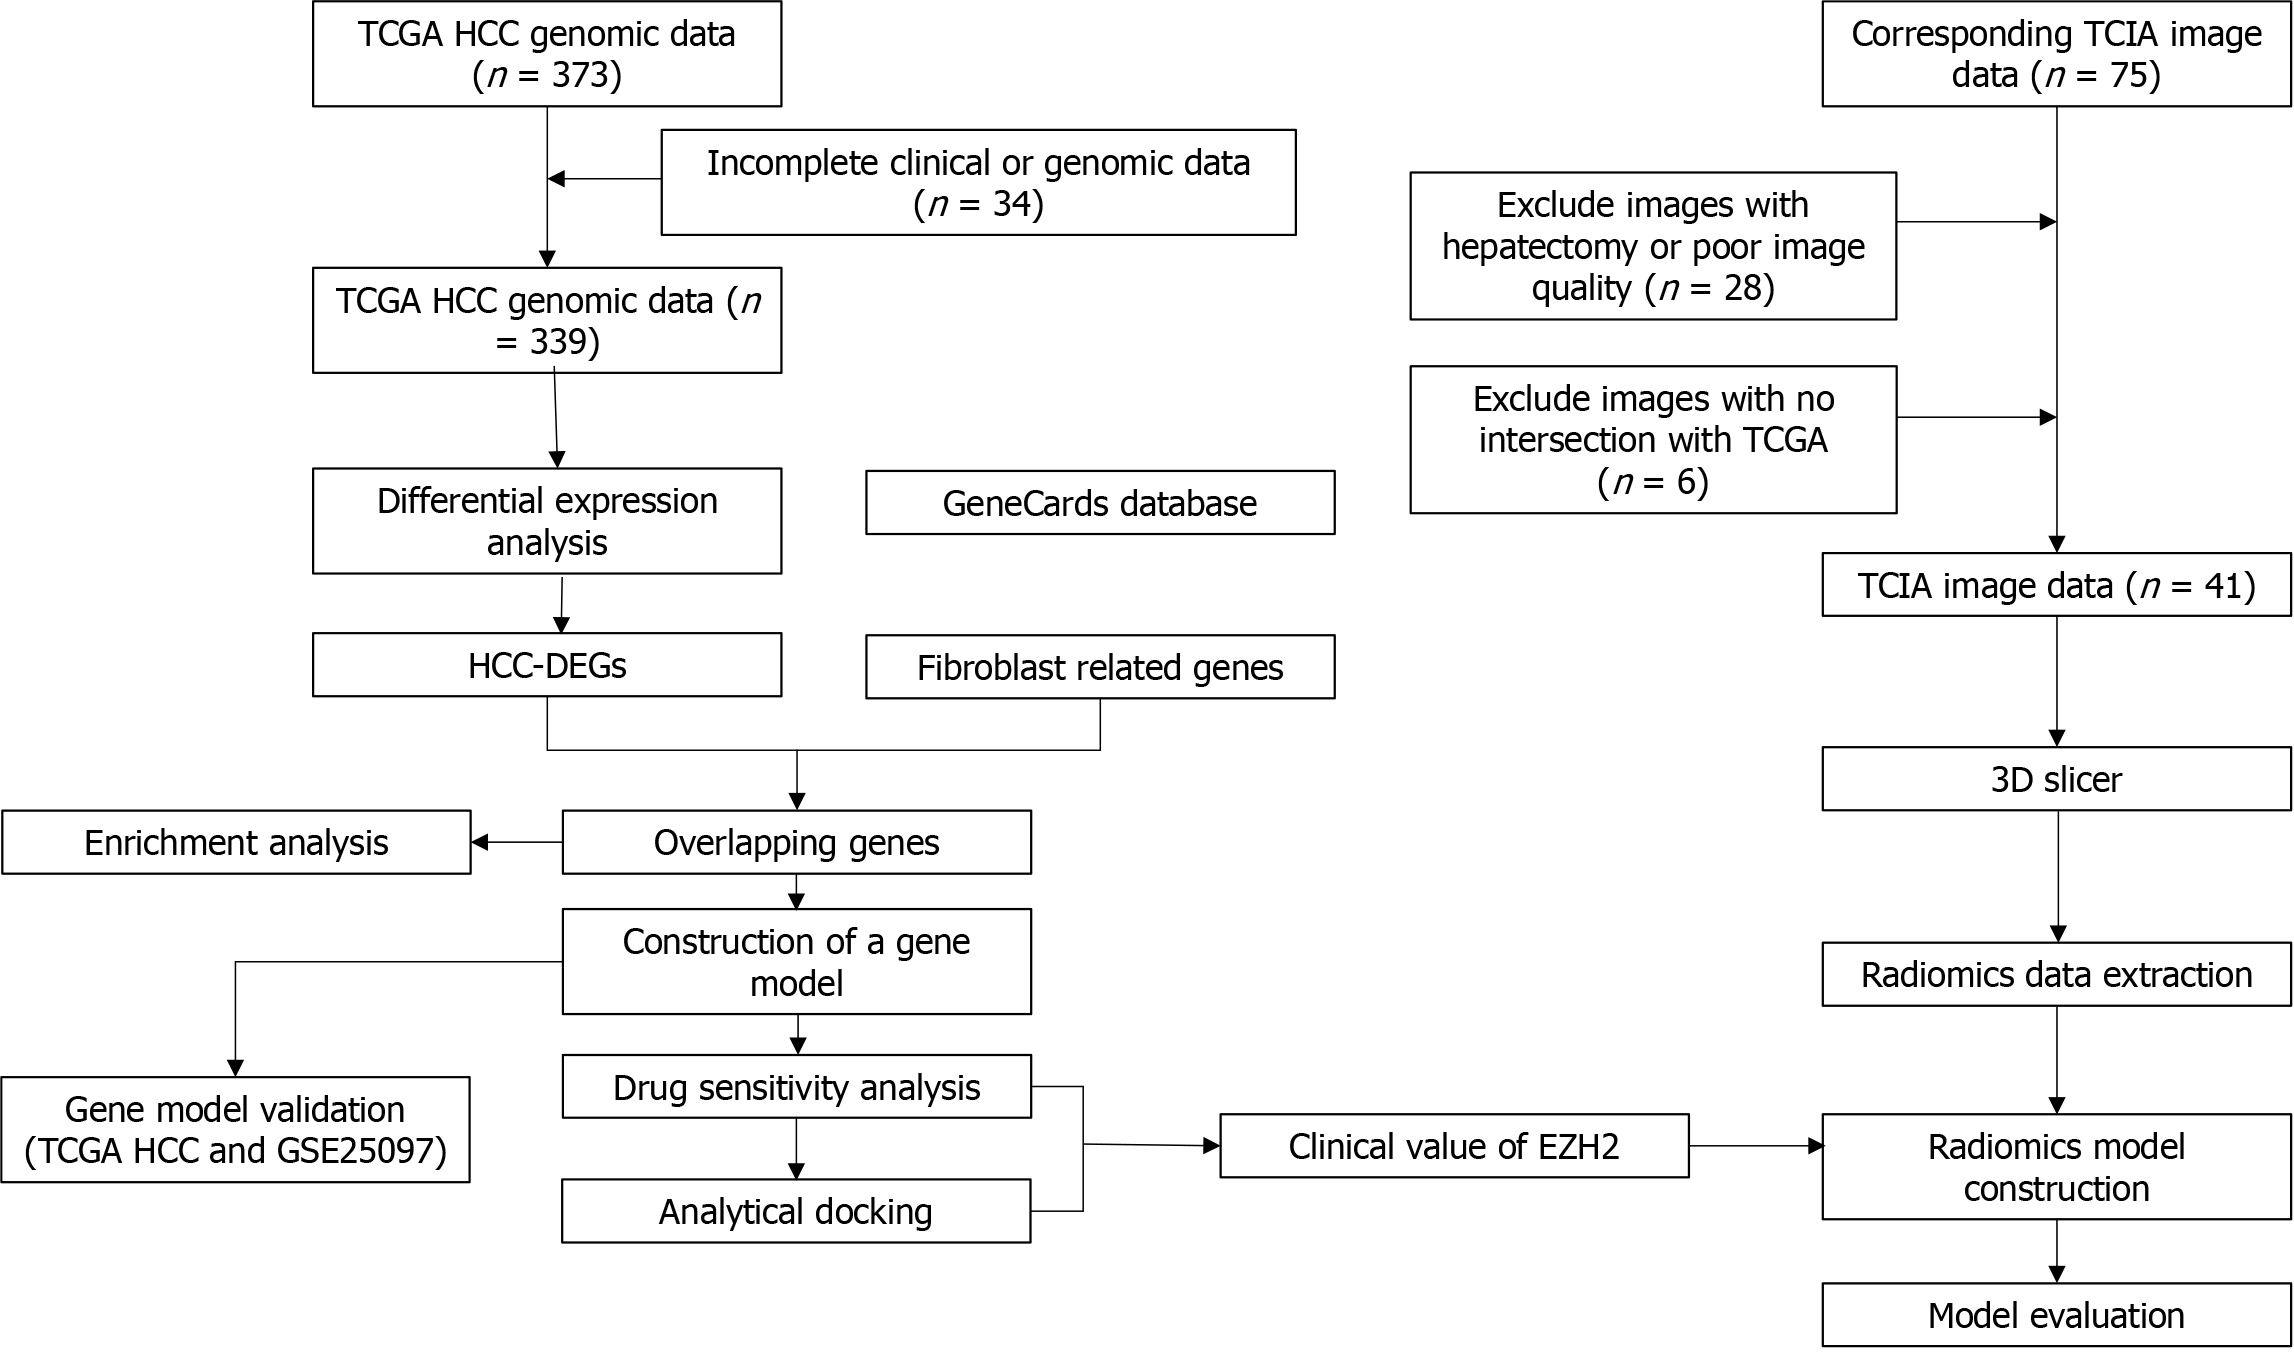
Figure 1 Entire analytical process of the study.
DEGs: Differentially expressed genes; HCC: Hepatocellular carcinoma; TCGA: The Cancer Genome Atlas; TCIA: The Cancer Imaging Archive.
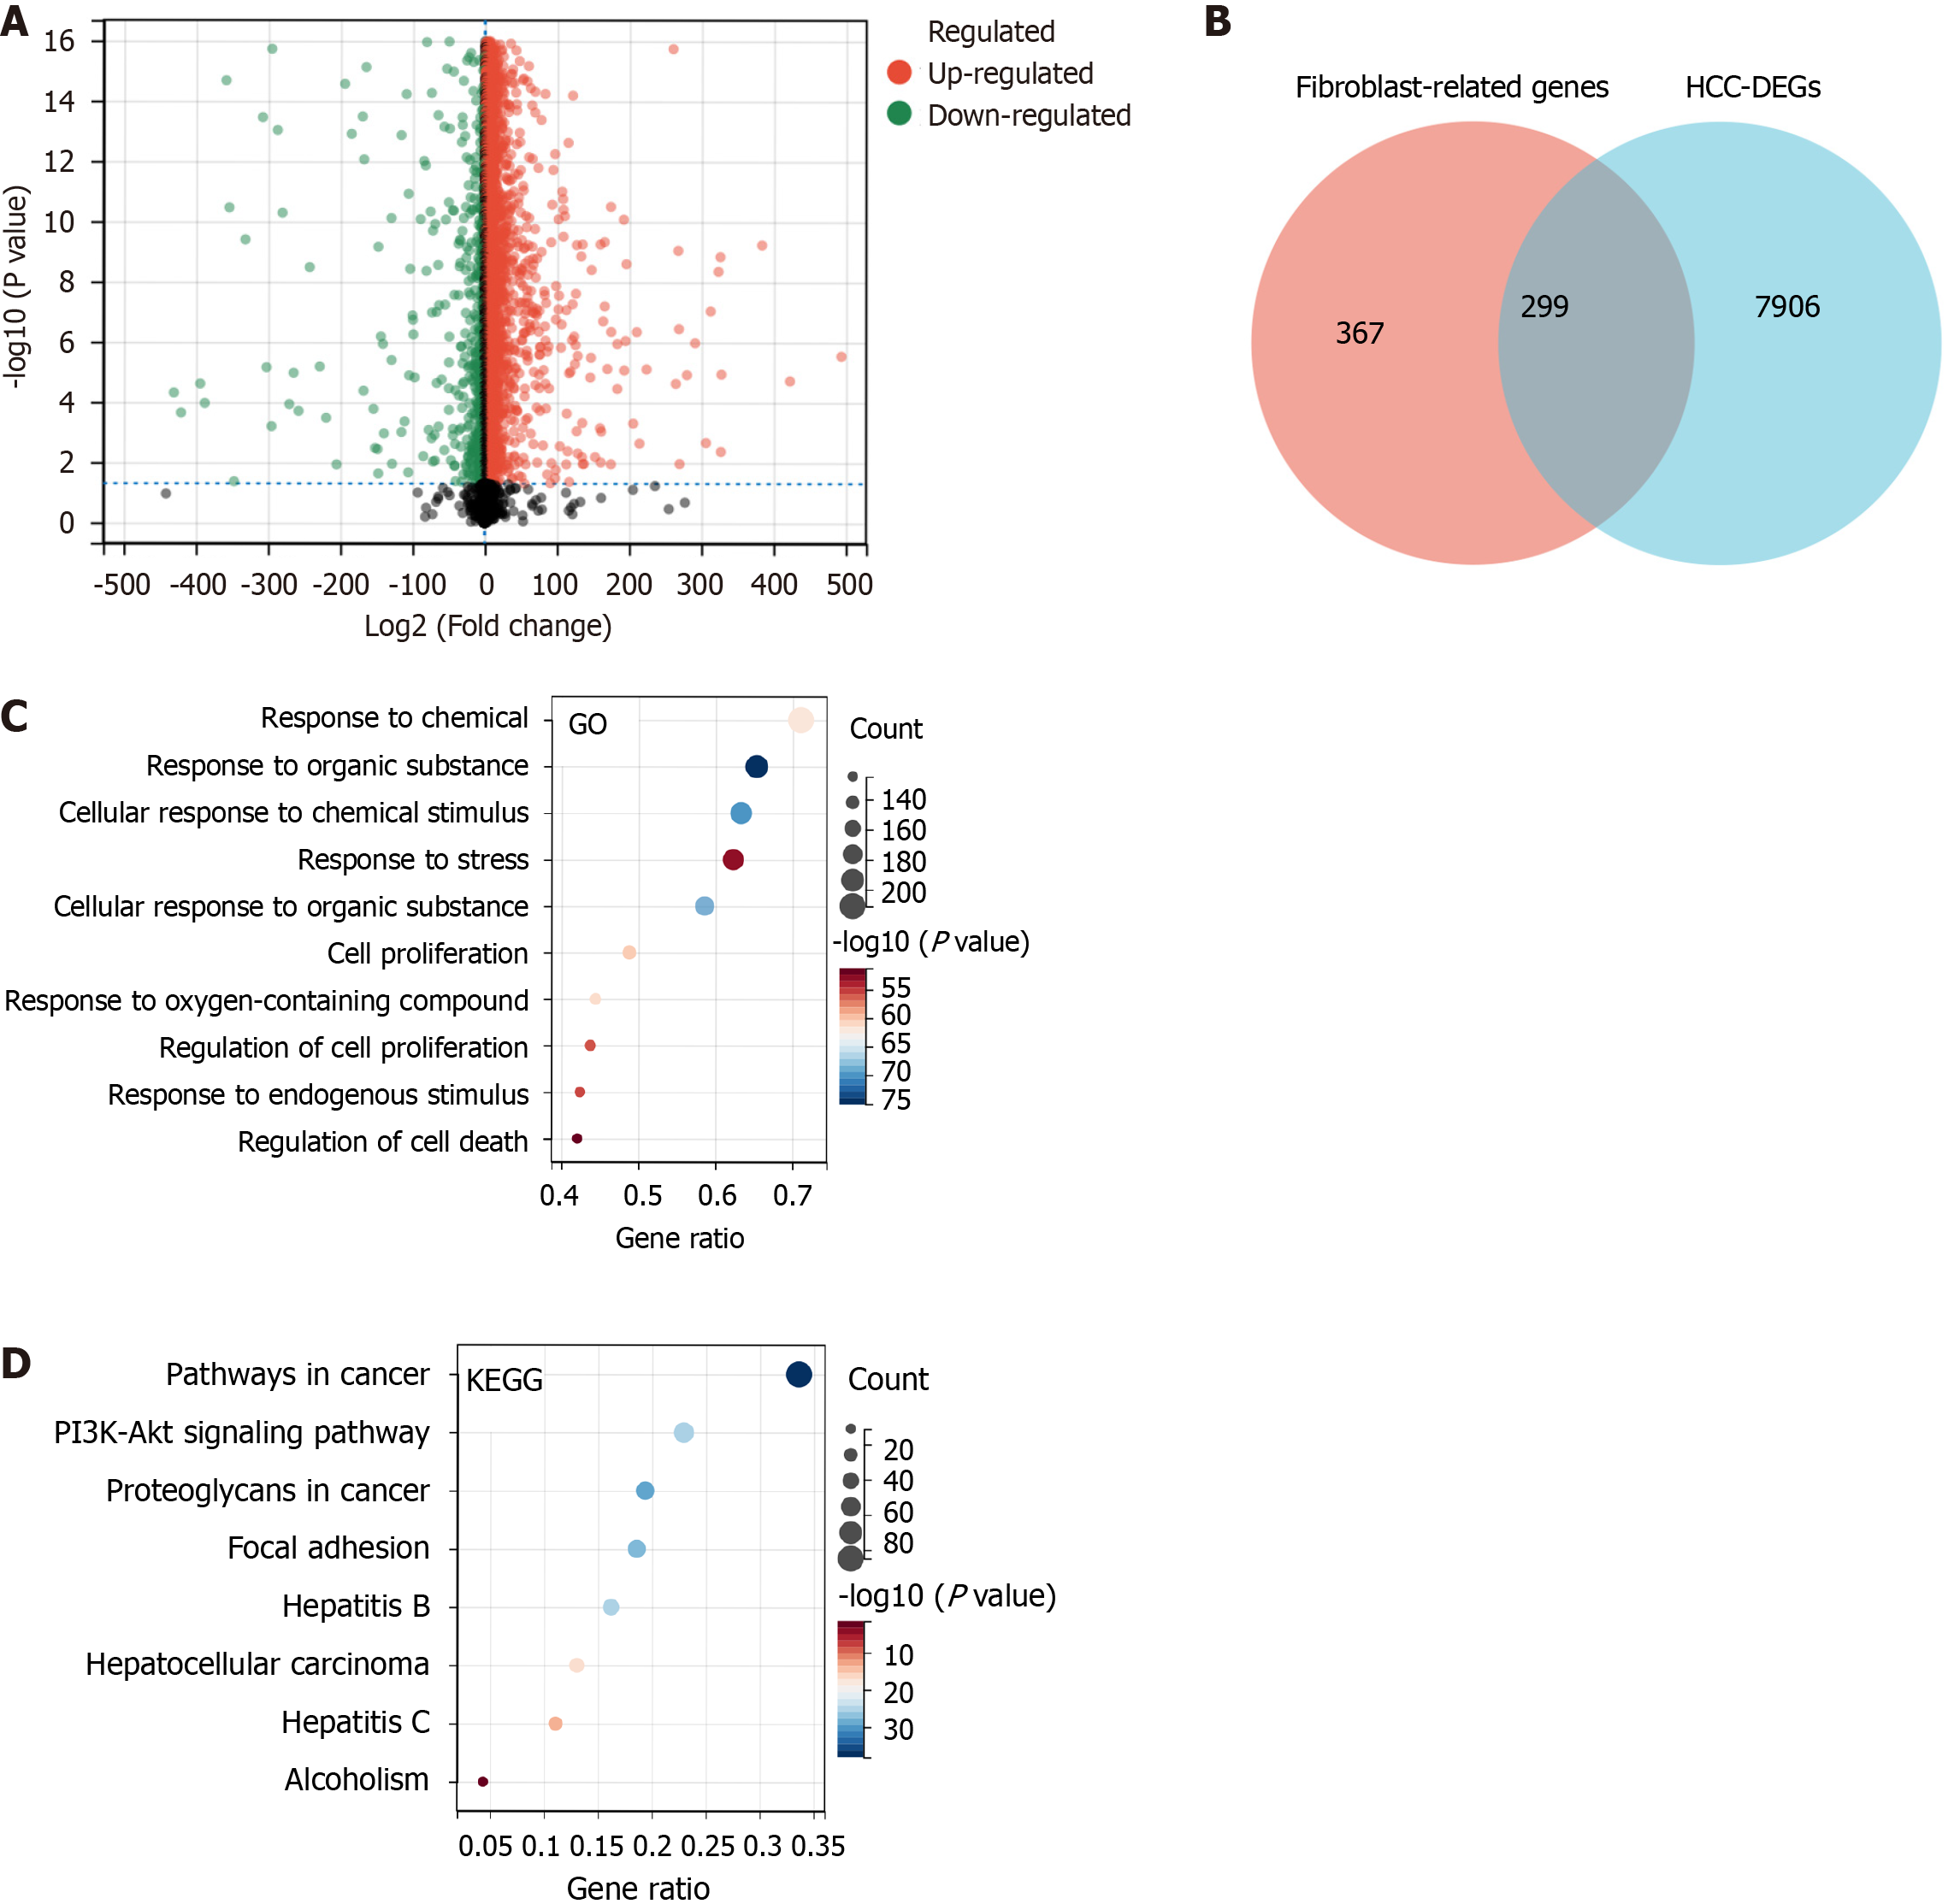
Figure 2 Identification and enrichment analysis of differentially expressed fibroblast-related genes.
A: Volcano plot was used to visualize the results of differential analysis between normal and tumor tissues in hepatocellular carcinoma (HCC); B: Venn diagram of fibroblast-related genes (FRGs) and HCC-differentially expressed genes (DEGs); C: Gene ontology (GO) enrichment analyses of differentially expressed FRGs; D: Kyoto Encyclopedia of Genes and Genomes (KEGG) enrichment analyses of differentially expressed FRGs.
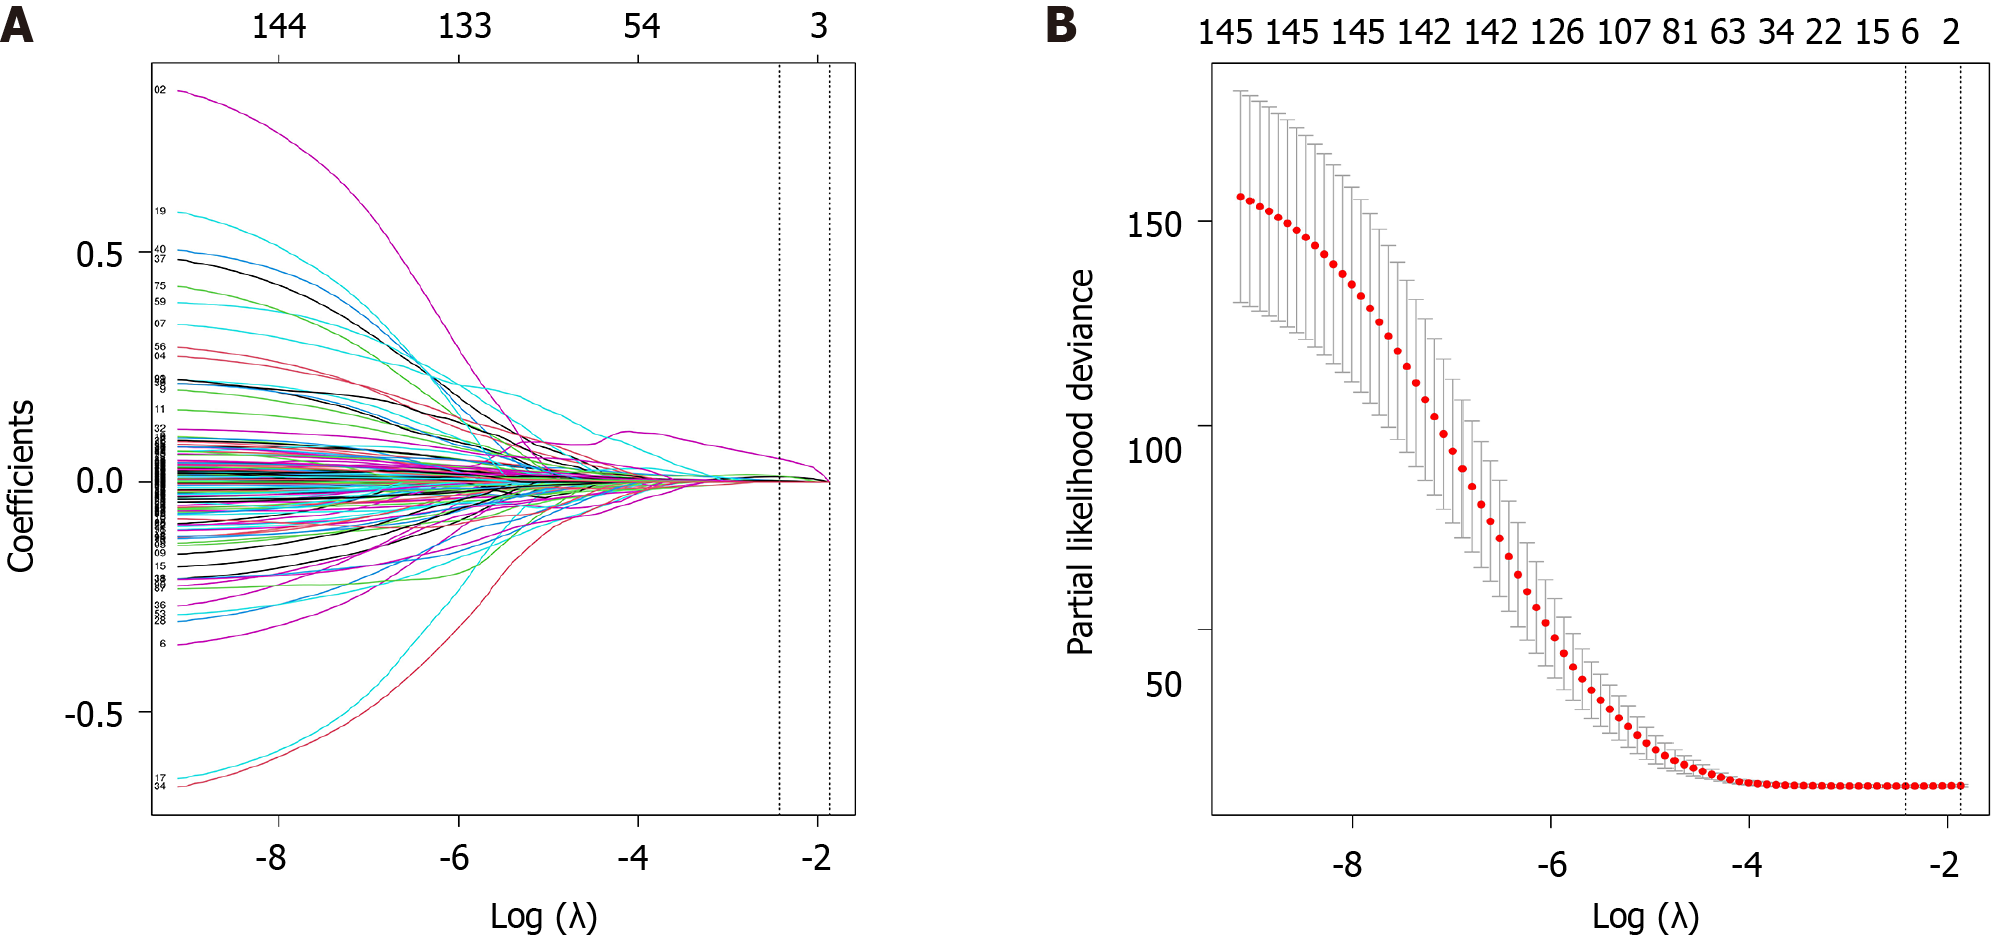
Figure 3 Selection of hub genes related to hepatocellular carcinoma prognosis.
A: Least absolute shrinkage and selection operator (LASSO) correlation coefficient change curve; B: LASSO cross-validation curve.
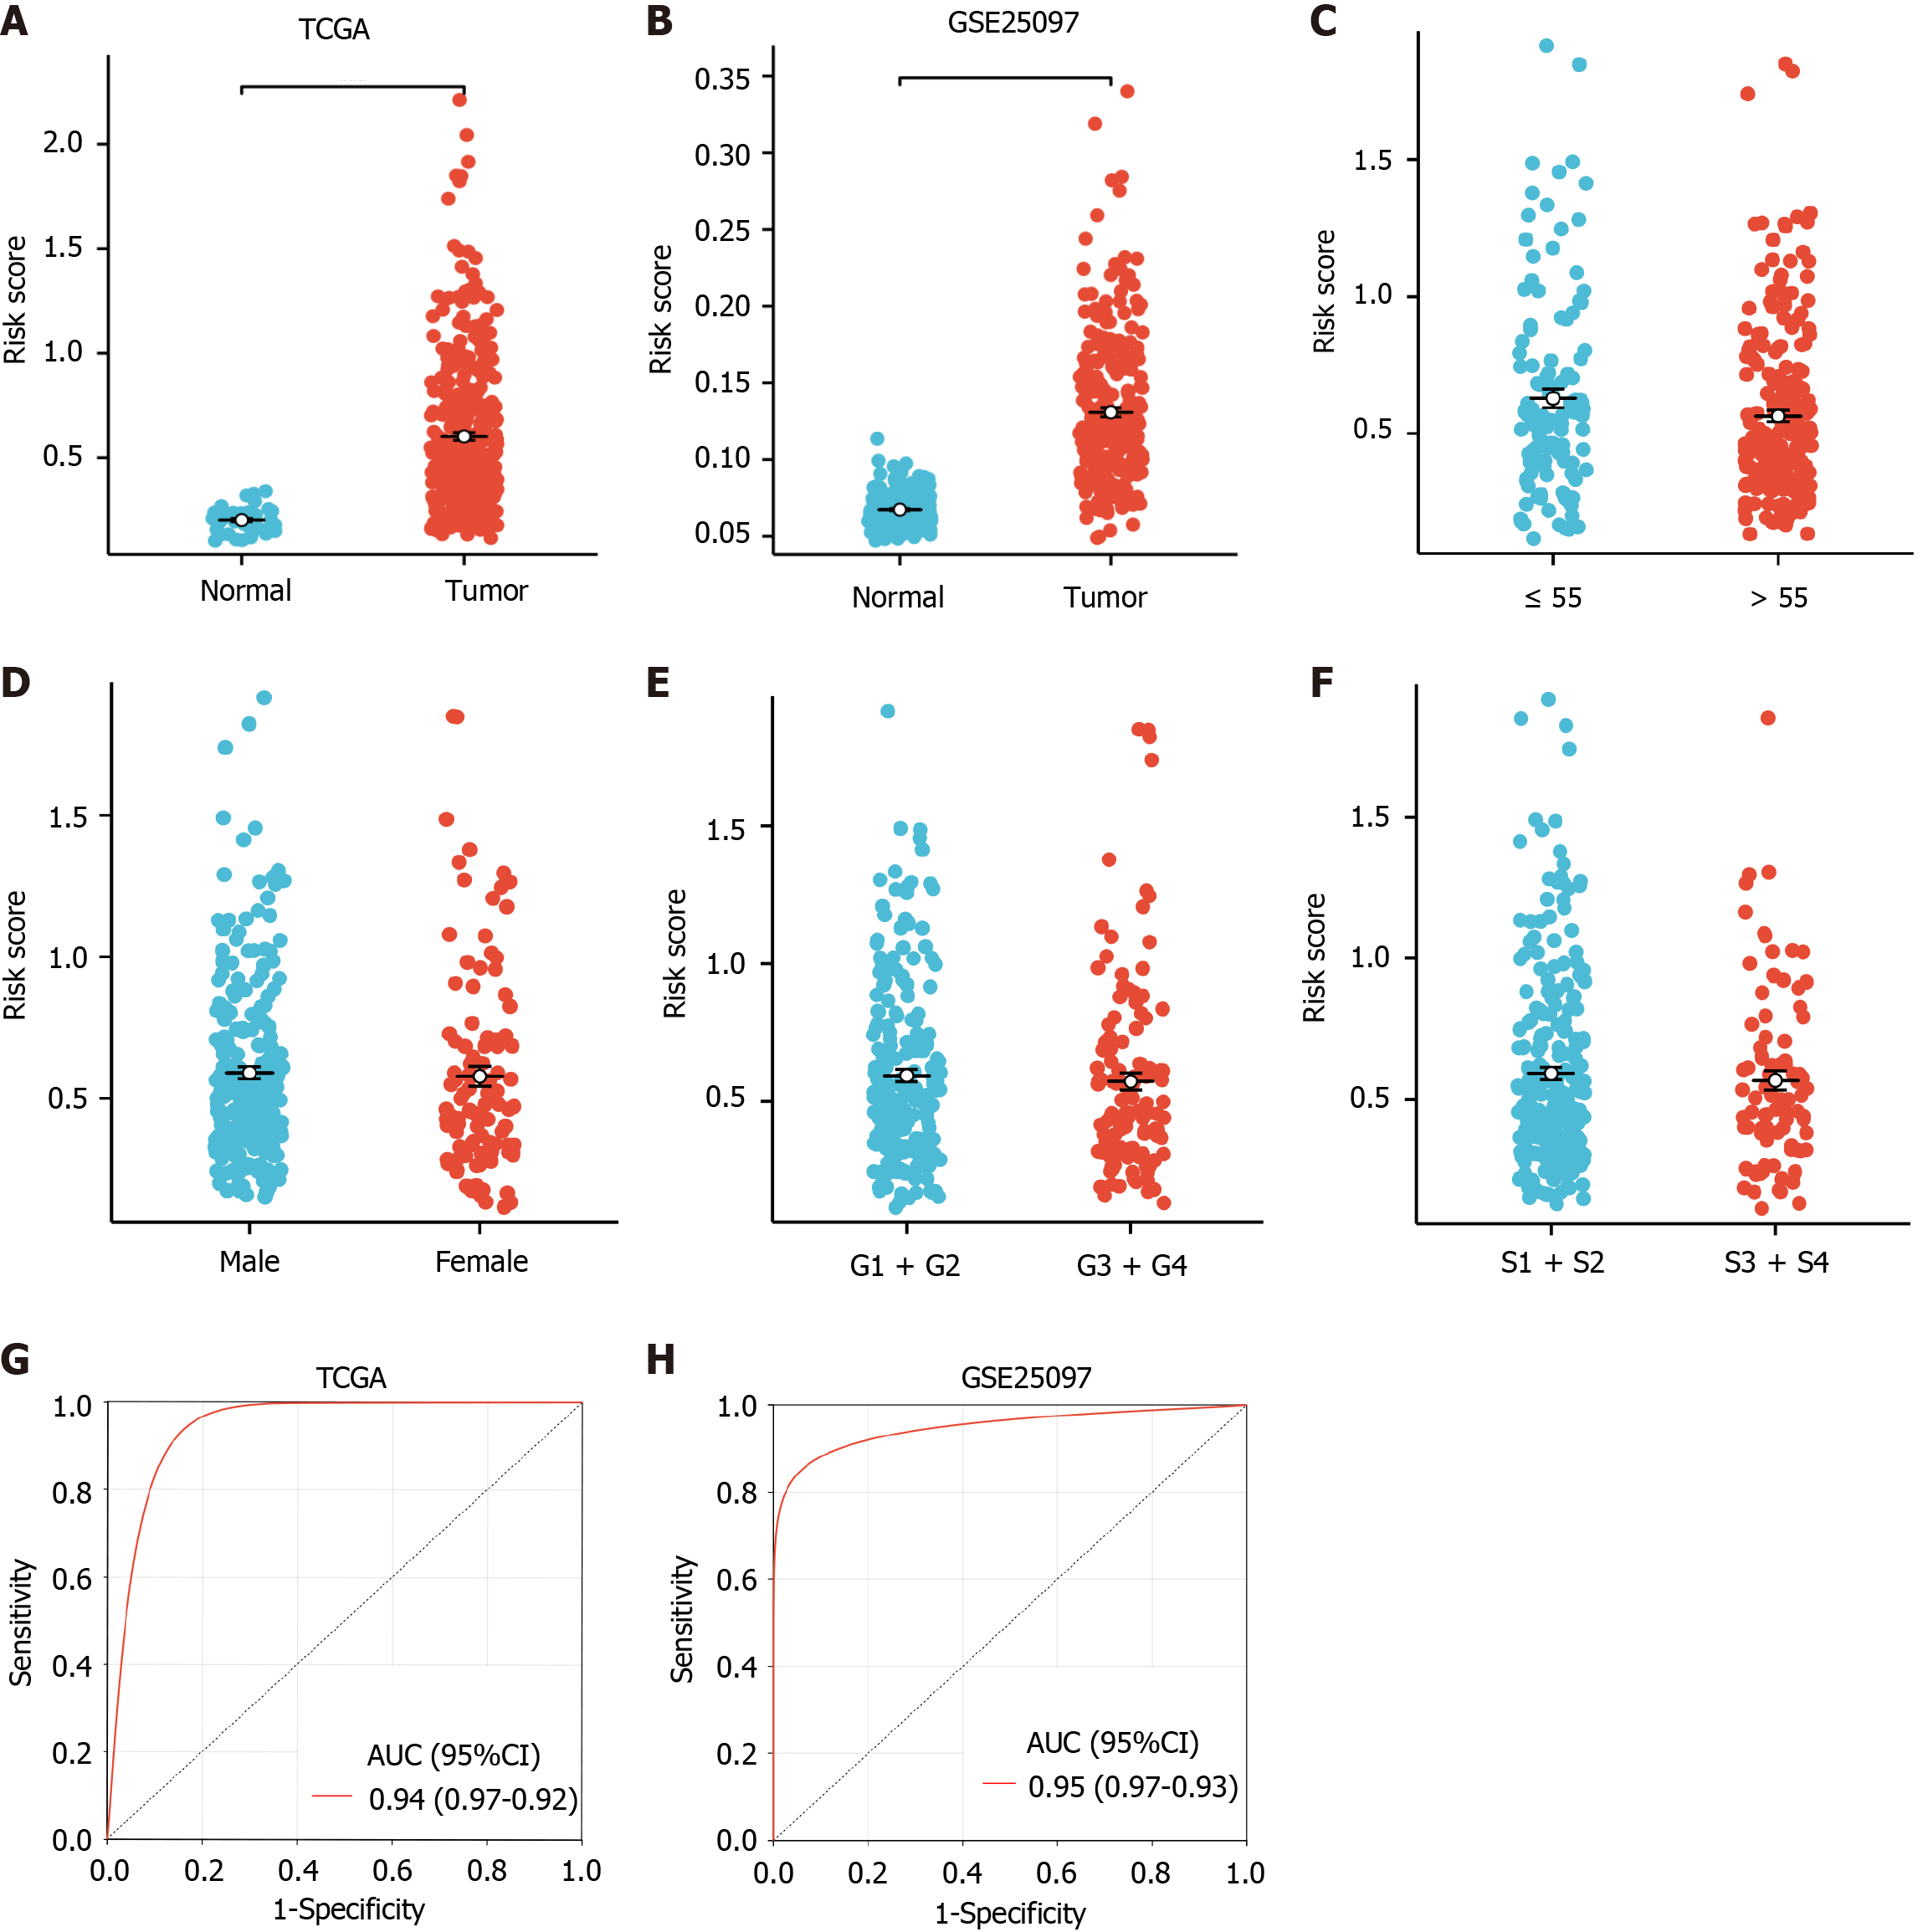
Figure 4 Evaluation and validation of risk model.
A and B: Based on the Cancer Genome Atlas (TCGA)-Hepatocellular carcinoma (HCC) and GSE25097 datasets, the risk score was higher in the HCC samples; C: Relationship of risk score with age; D: Relationship of risk score with sex; E: Relationship of risk score with grade; F: Relationship of risk score with pathological stage; G: Receiver operating characteristic (ROC) curve of the risk score in the TCGA-HCC; H: ROC curve of the risk score in the GSE25097 datasets for distinguishing HCC and normal samples. S1 + S2: Stage I and stage II; S3 + S4: Stage III and stage IV. AUC: Area under the curve; CI: Confidence interval.
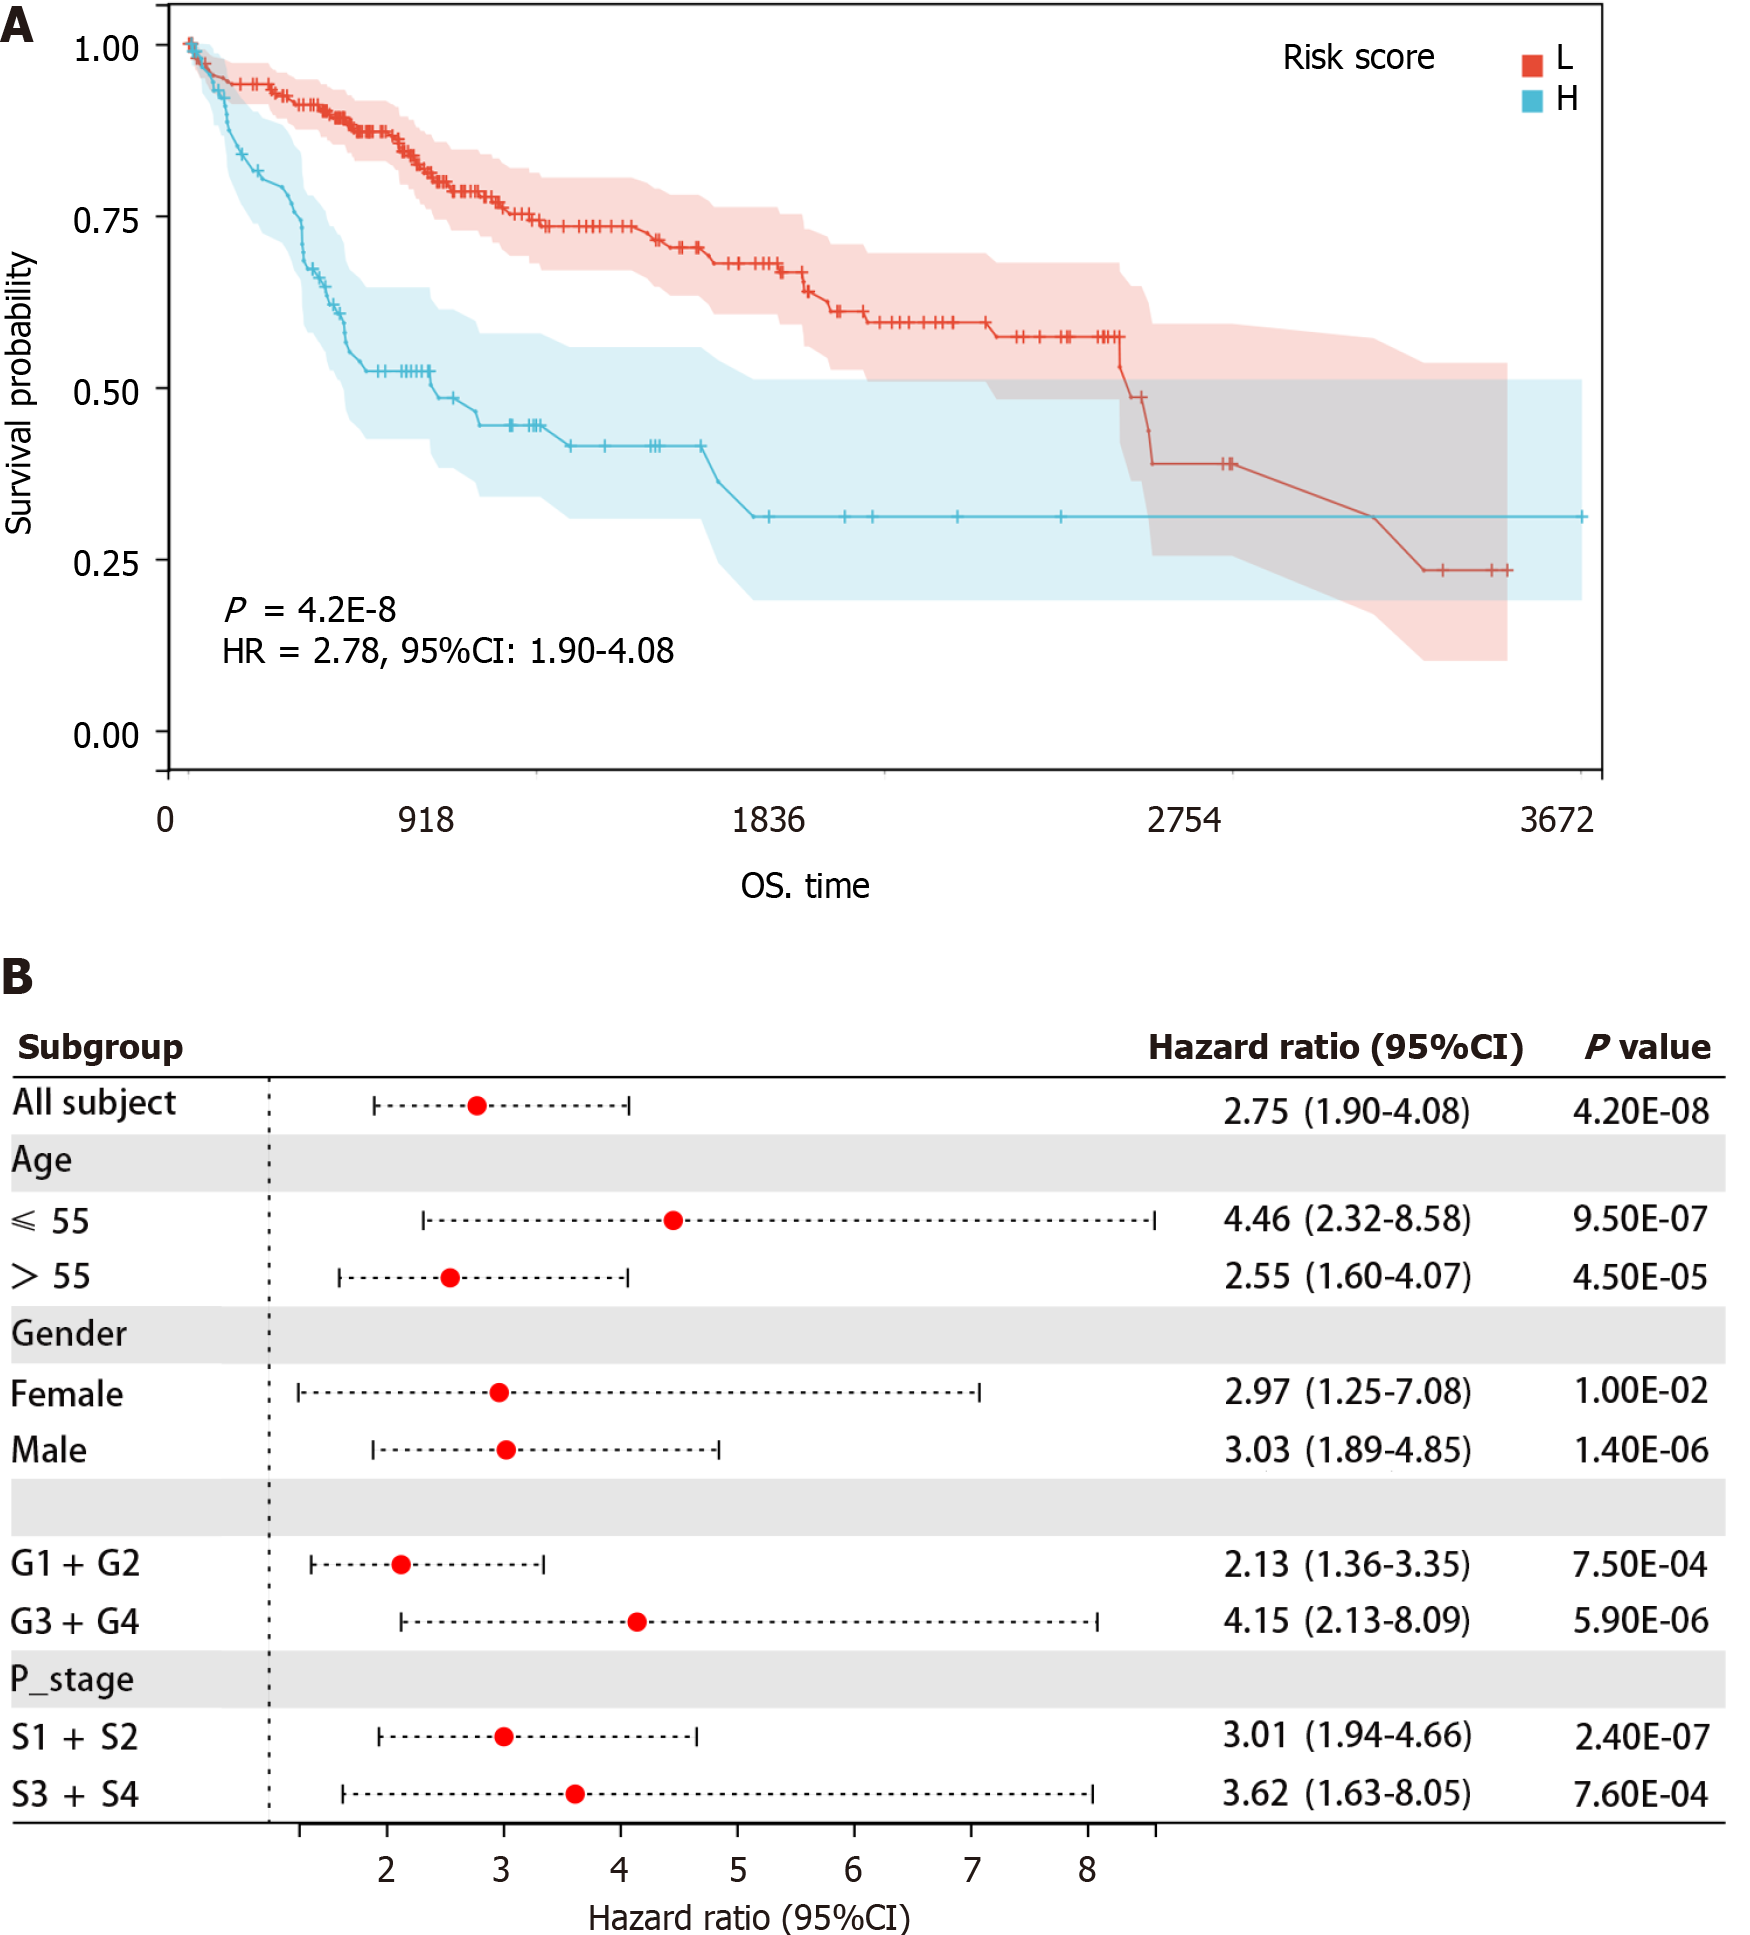
Figure 5 Prognostic model of the risk model.
A: Kaplan-Meier curve showed that a higher risk score was associated with poor prognosis; B: Correlation between risk scores in clinical features and hepatocellular carcinoma prognosis. S1 + S2: Stage I and stage II; S3 + S4: Stage III and stage IV. CI: Confidence interval; H: High; HR: Hazard ratio; L: Low; OS: Overall survival.
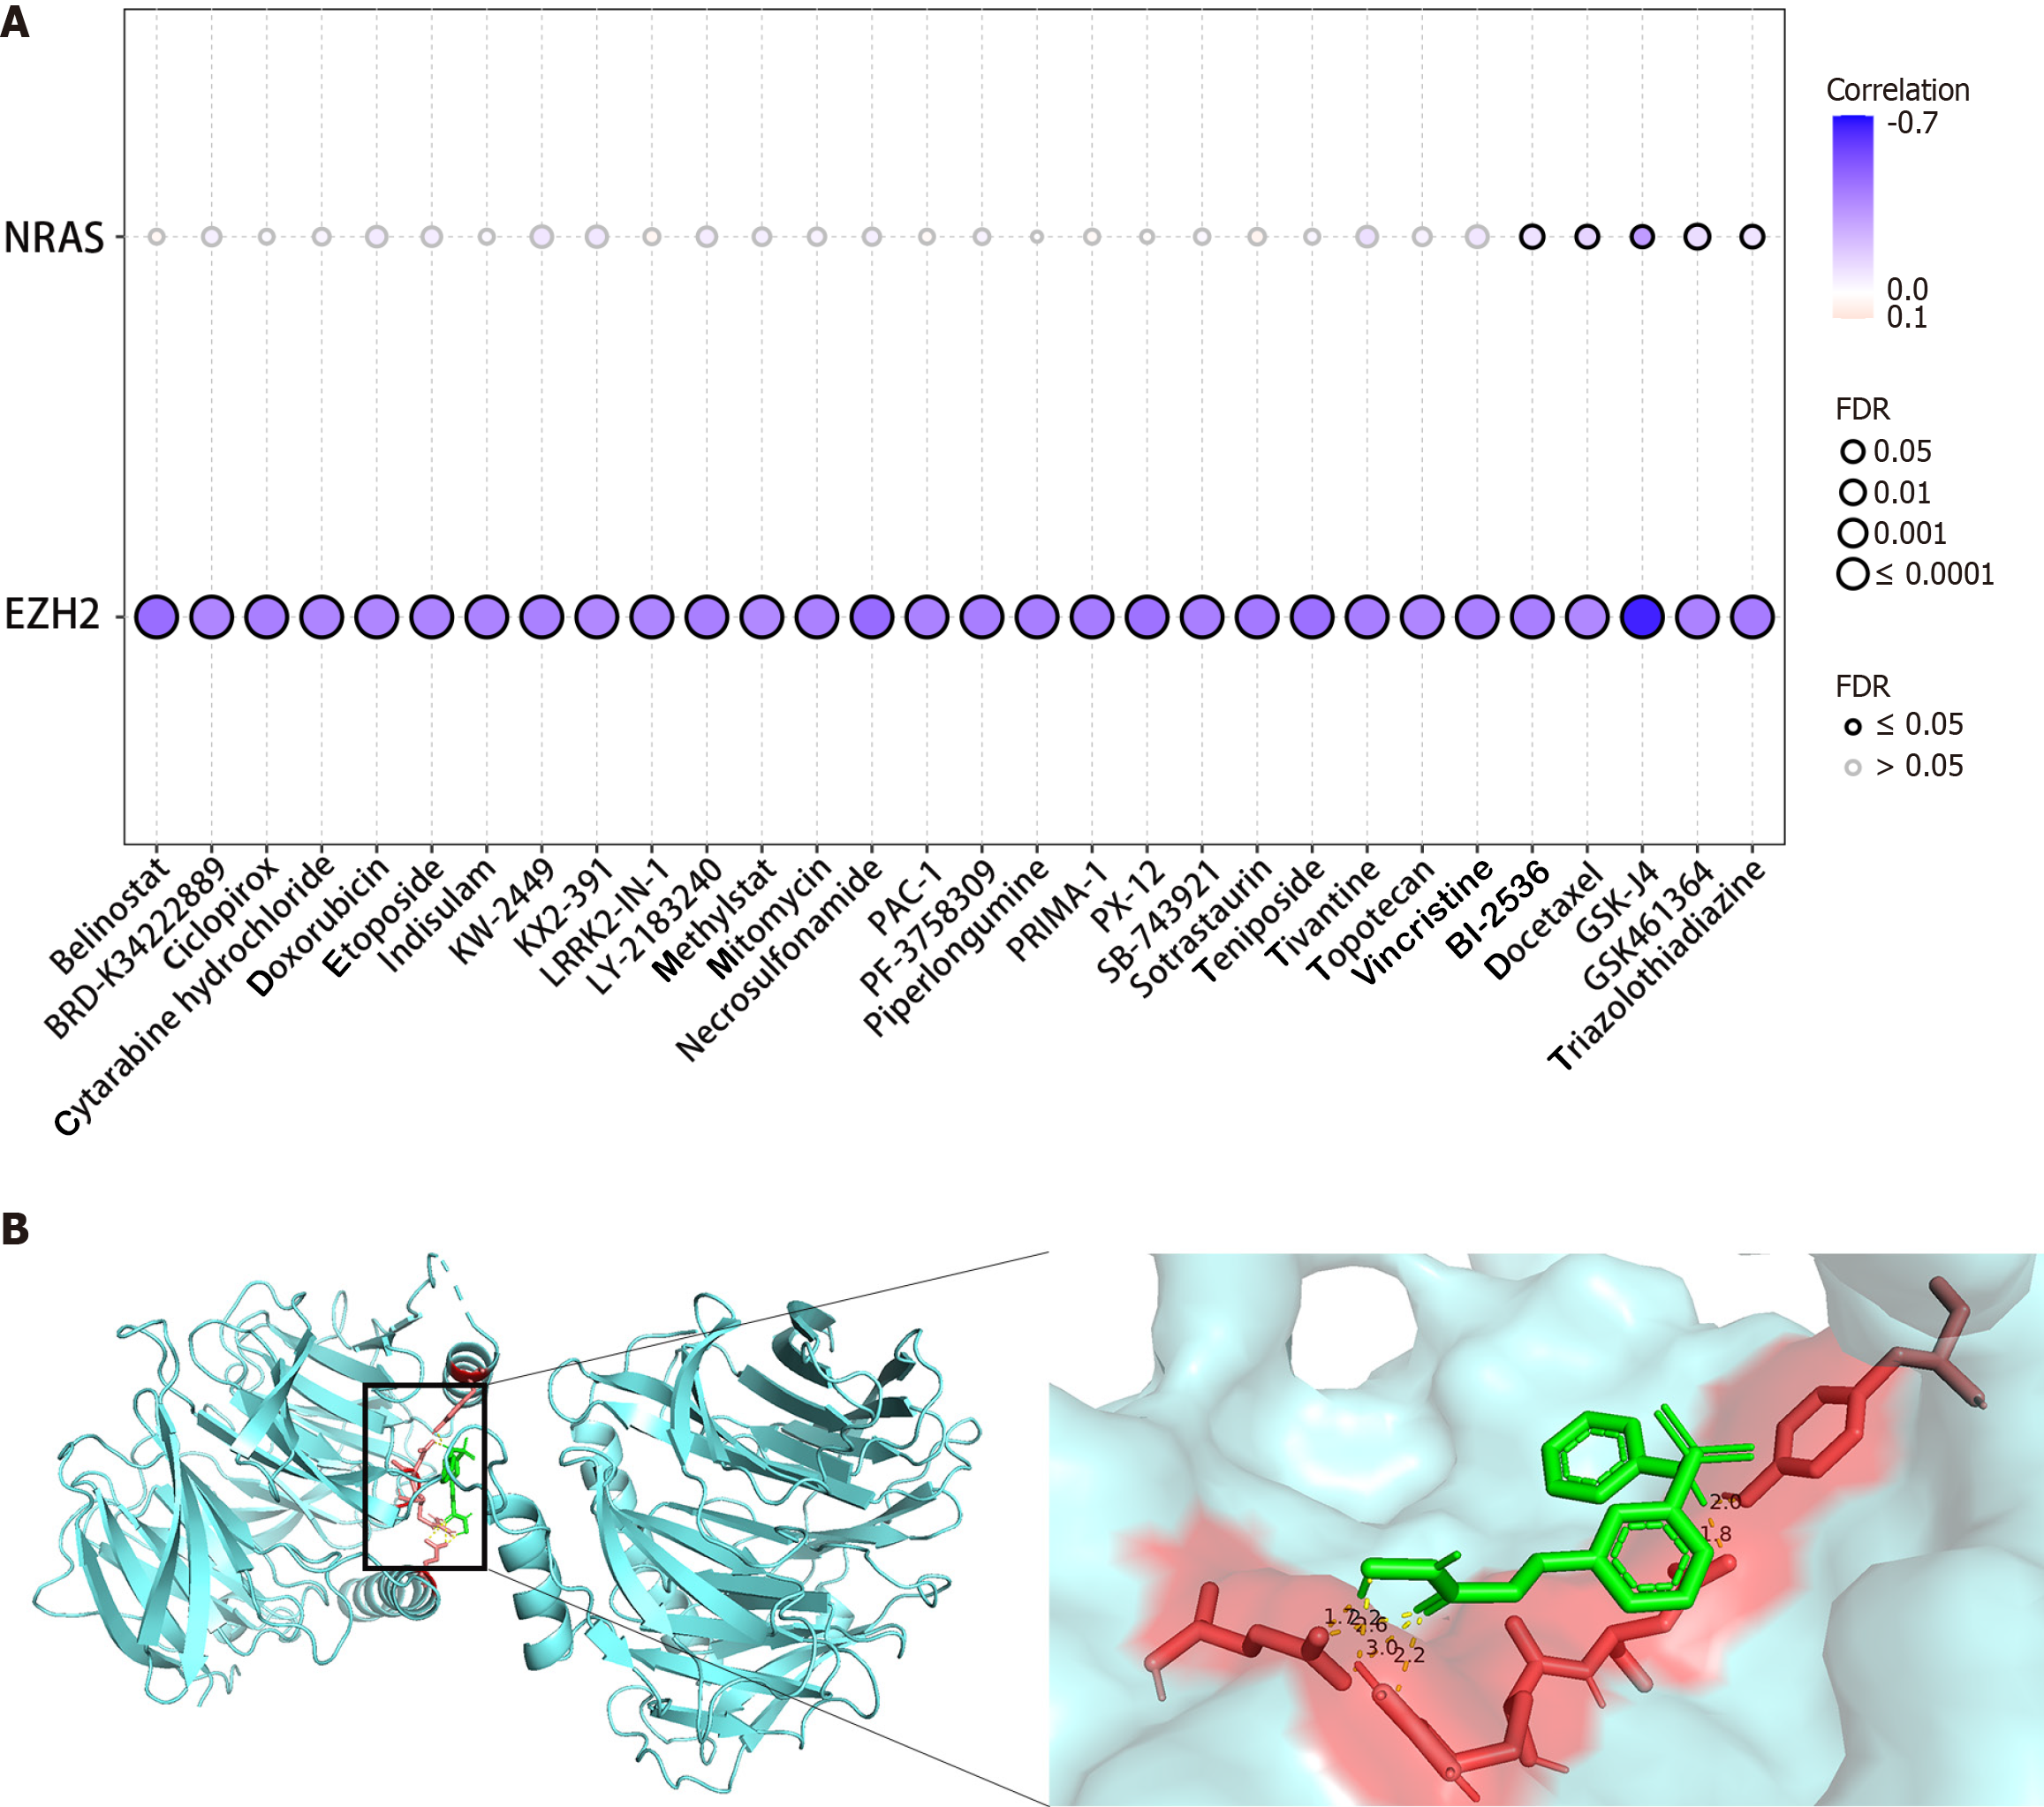
Figure 6 Drug sensitivity analysis and molecular docking.
A: Correlation of EZH2 and NRAS with chemotherapy and cancer drugs; B: Molecular docking between EZH2 and belinostat. FDR: False discovery rate.
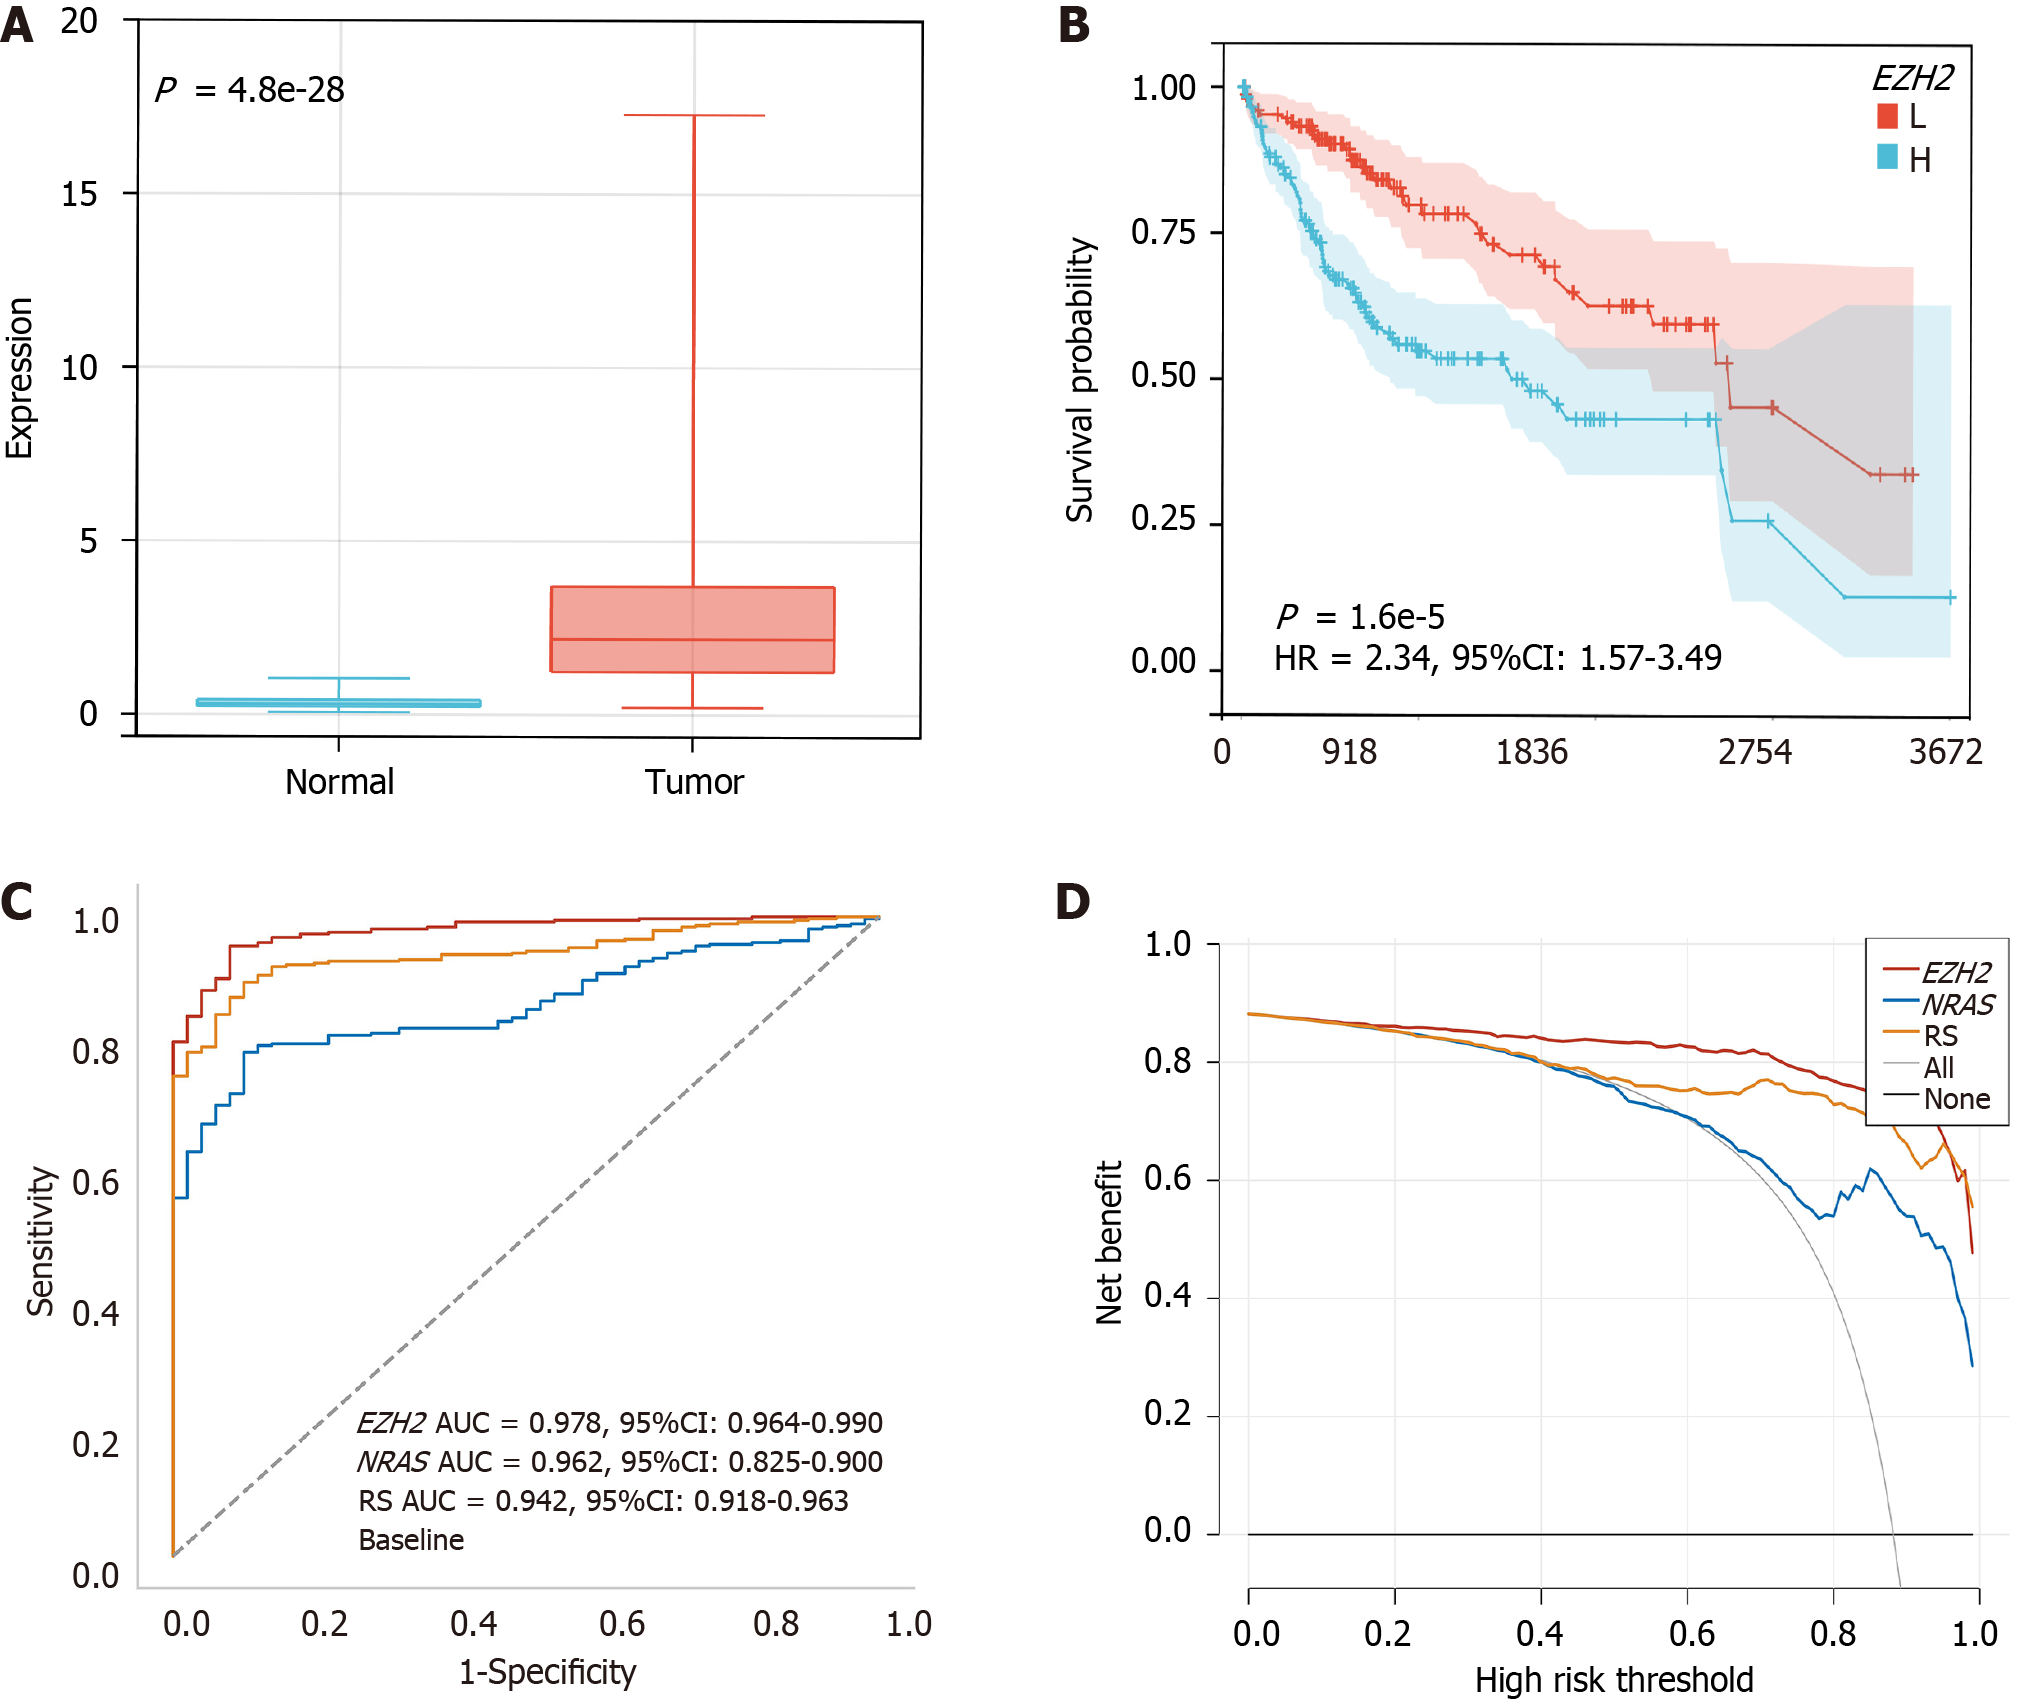
Figure 7 Clinical value of EZH2 in hepatocellular carcinoma.
A: Expression of EZH2 in hepatocellular carcinoma (HCC) and normal groups; B: High (H) levels of EZH2 were associated with poor HCC prognosis; C: Receiver operating characteristic curve of EZH2, NARS, and risk score (RS) in diagnosing HCC; D: Decision curve analysis of EZH2, NRAS, and RS in diagnosing HCC. AUC: Area under the curve; CI: Confidence interval; HR: Hazard ratio; L: Low.
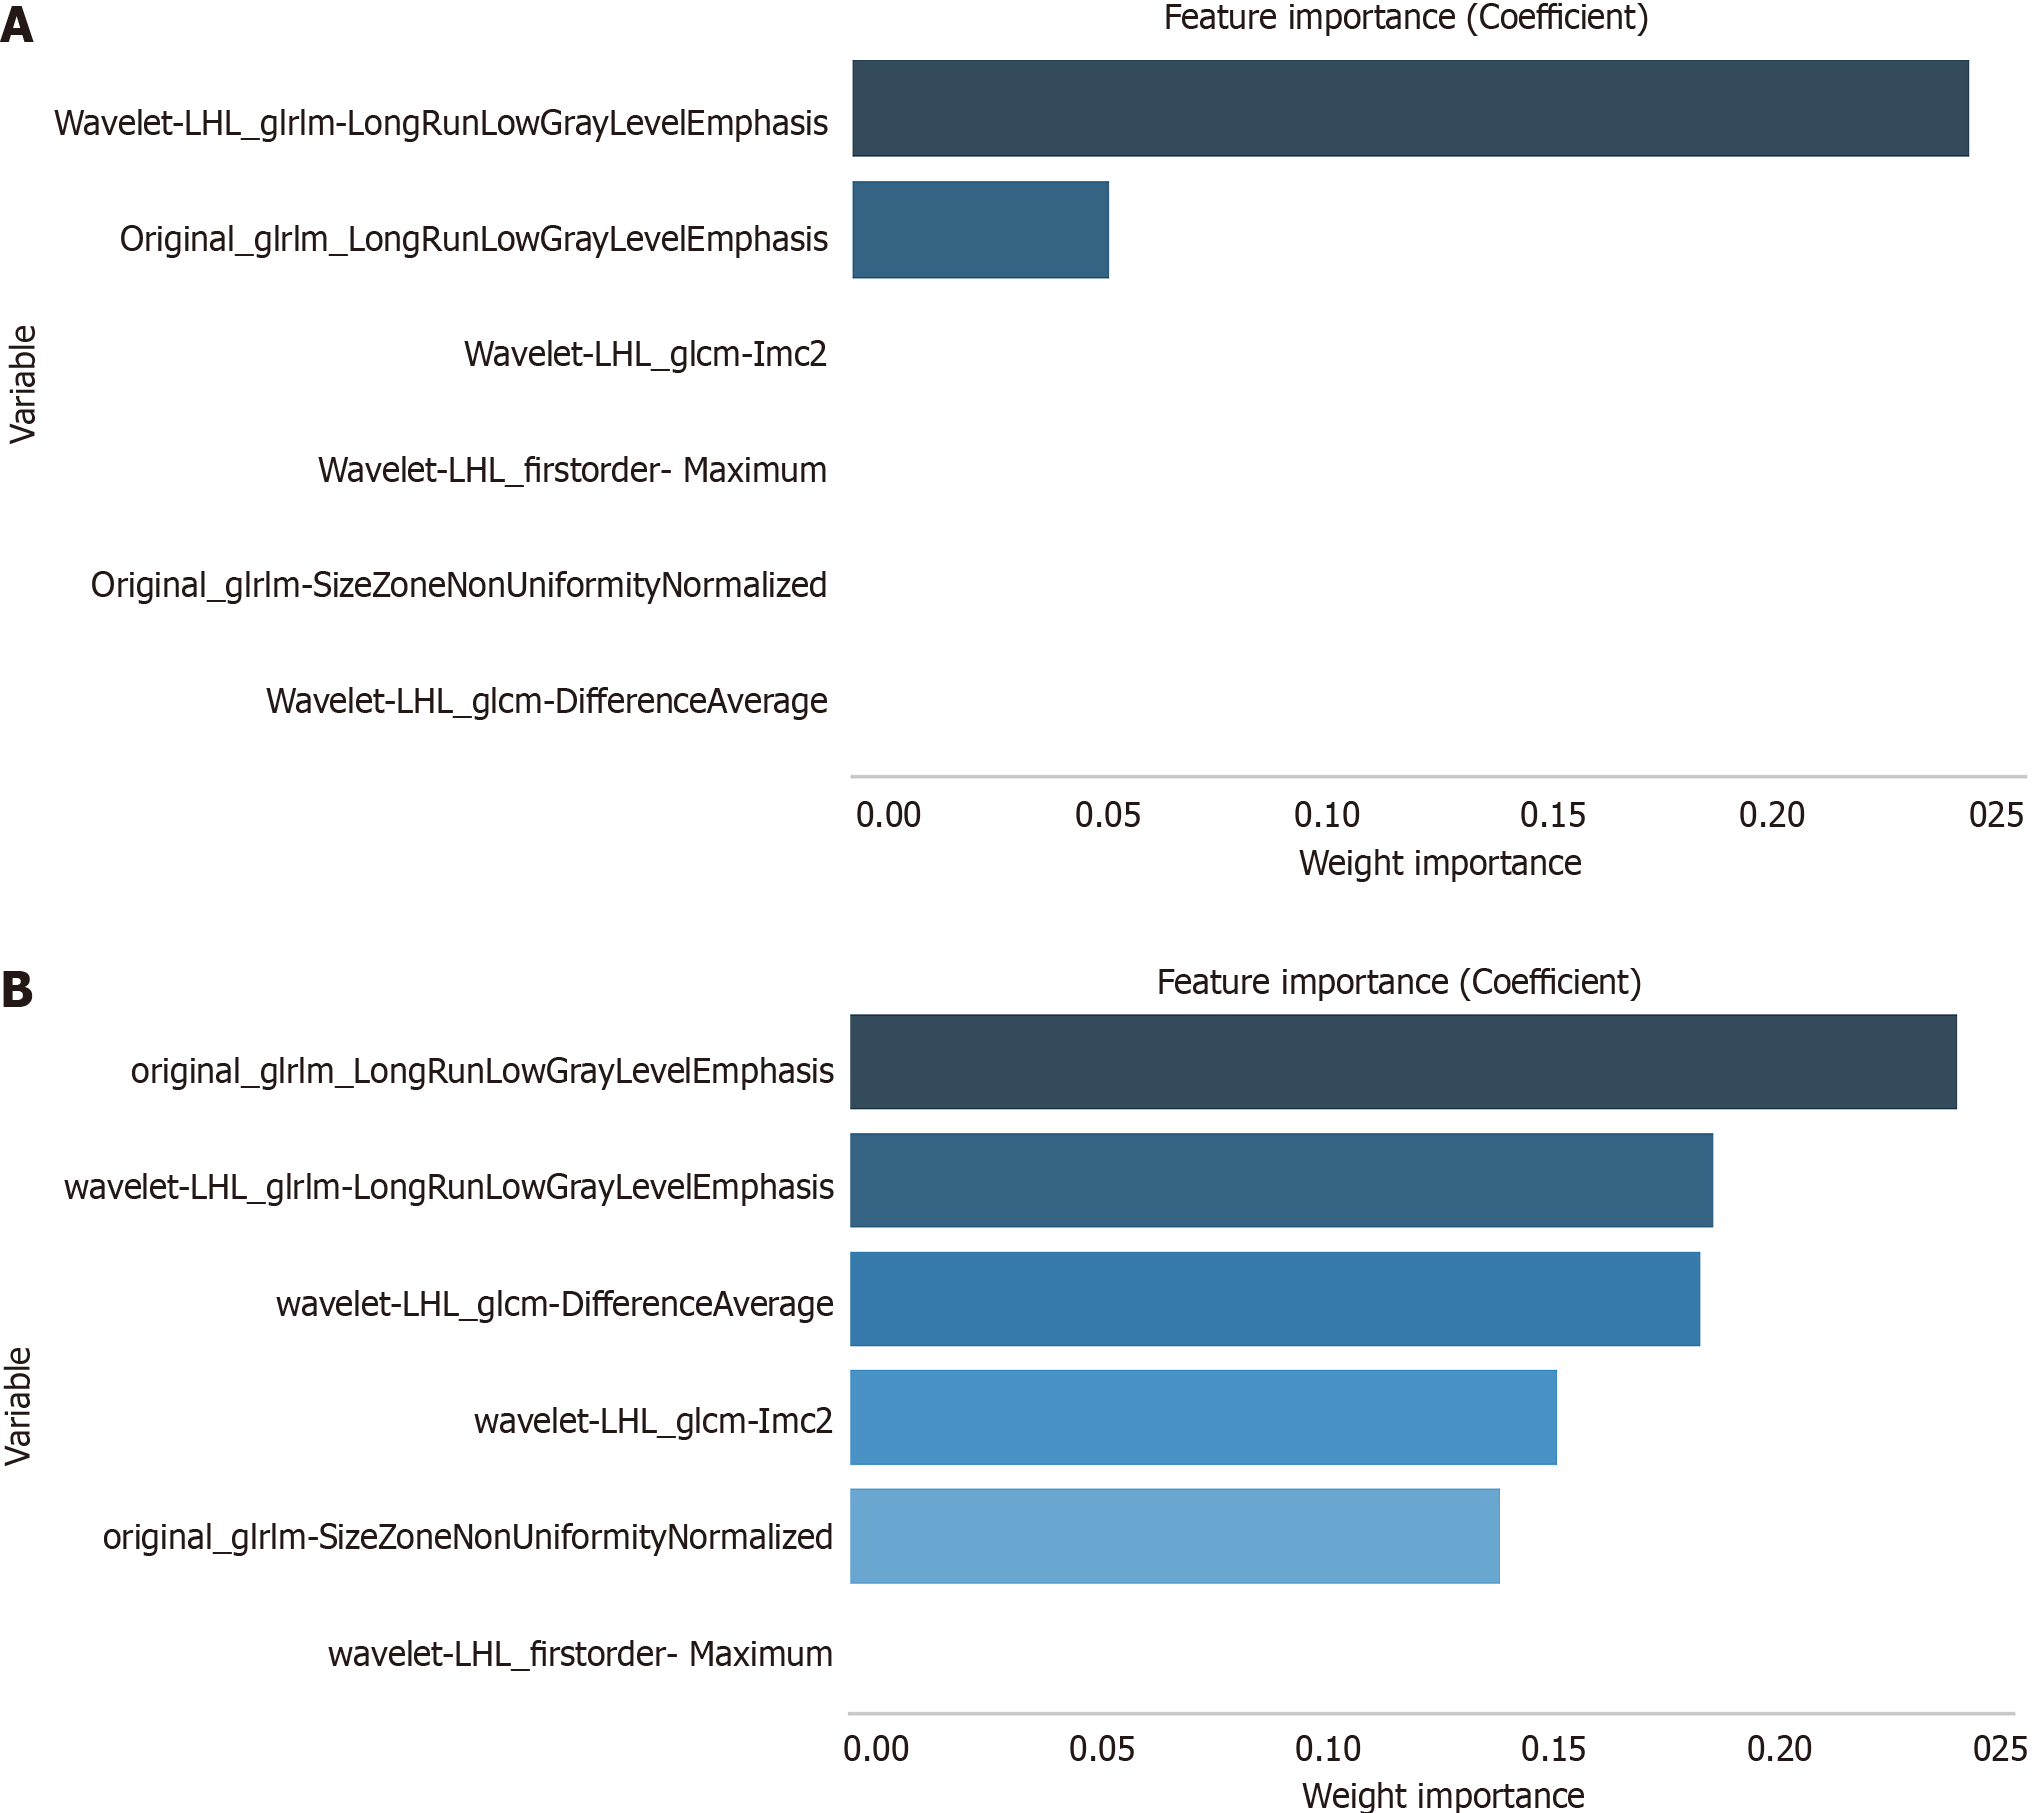
Figure 8 Screening of radiomics features related to EZH2 and radiomics model construction.
A: Feature importance based on the logistic algorithm; B: Feature importance based on the random forest algorithm.
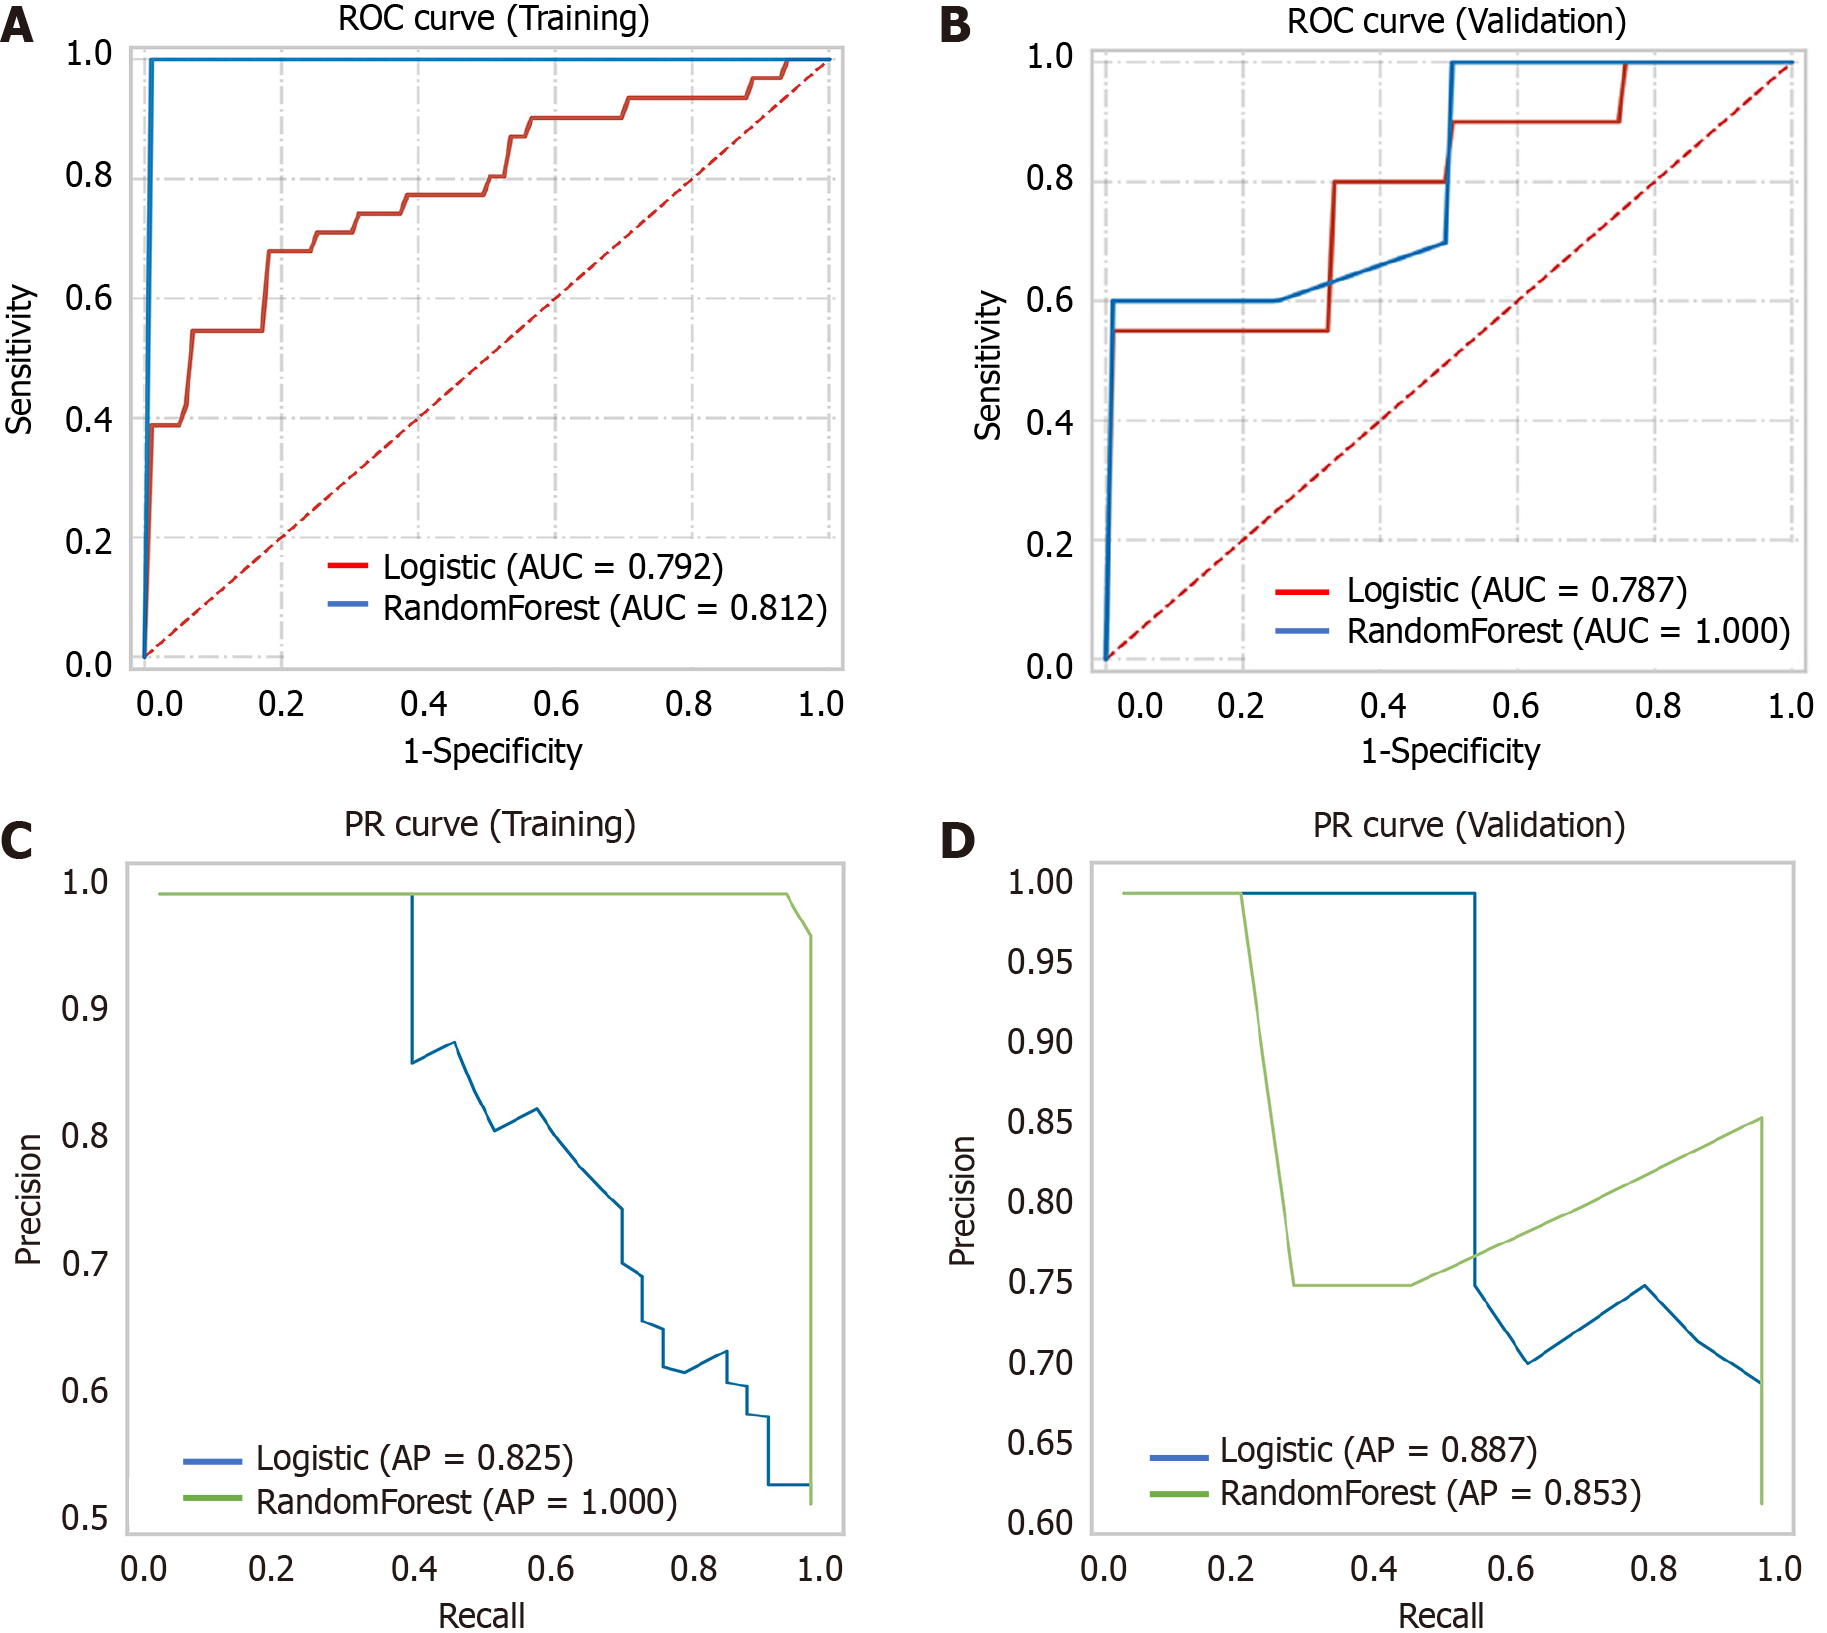
Figure 9 Results of predicting EZH2 in the training set and validation set based on the logistic and random forest classifier algorithm.
A: Receiver operating characteristic (ROC) curve in the training sets based on the logistic and random forest classifier algorithm; B: ROC curve in the validation sets based on the logistic and random forest classifier algorithm; C: Precision (PR) curve in the training sets based on the logistic and random forest classifier algorithm; D: PR curve in the validation sets based on the logistic and random forest classifier algorithm. AP: Average precision; AUC: Area under the curve.
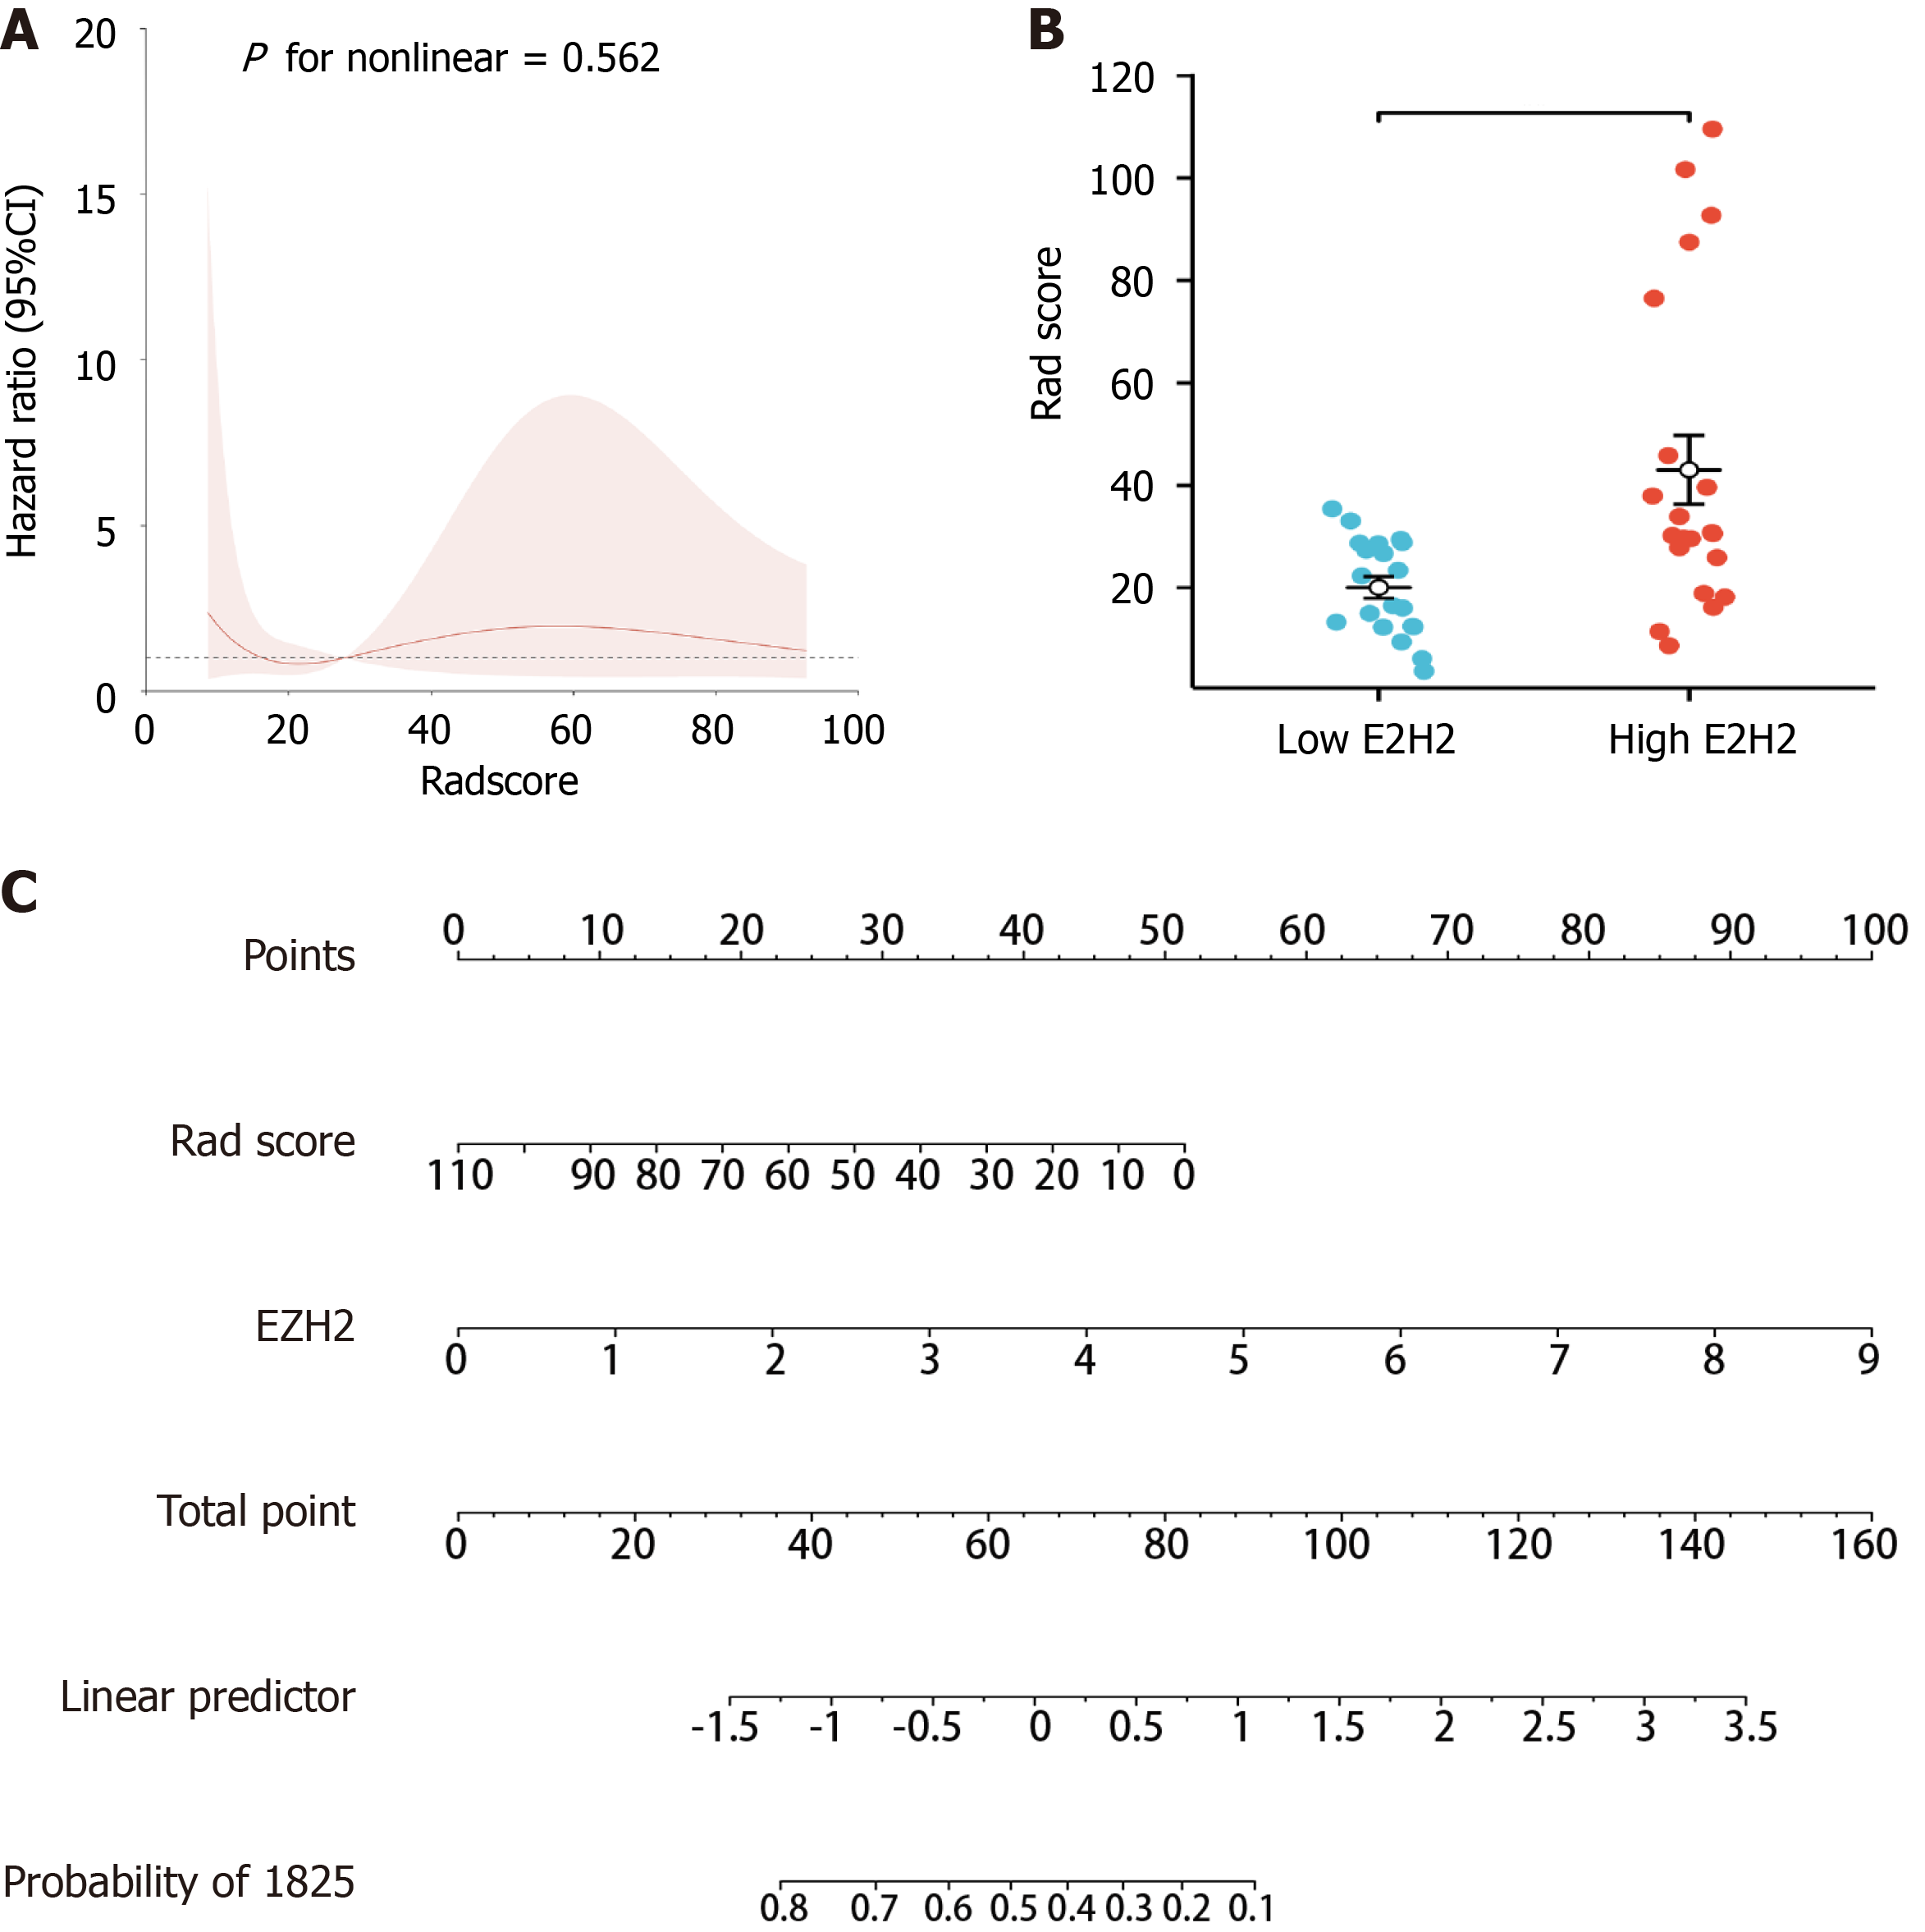
Figure 10 Clinical value of the radiomics model.
A: Linear association of EZH2 and radiomics model; B: Higher Radscore in the high EZH2 expression group; C: Value of the rad score and EZH2 in predicting hepatocellular carcinoma prognosis.
- Citation: Yu TY, Zhan ZJ, Lin Q, Huang ZH. Computed tomography-based radiomics predicts the fibroblast-related gene EZH2 expression level and survival of hepatocellular carcinoma. World J Clin Cases 2024; 12(24): 5568-5582
- URL: https://www.wjgnet.com/2307-8960/full/v12/i24/5568.htm
- DOI: https://dx.doi.org/10.12998/wjcc.v12.i24.5568


