Copyright
©The Author(s) 2024.
World J Clin Cases. Aug 16, 2024; 12(23): 5329-5337
Published online Aug 16, 2024. doi: 10.12998/wjcc.v12.i23.5329
Published online Aug 16, 2024. doi: 10.12998/wjcc.v12.i23.5329
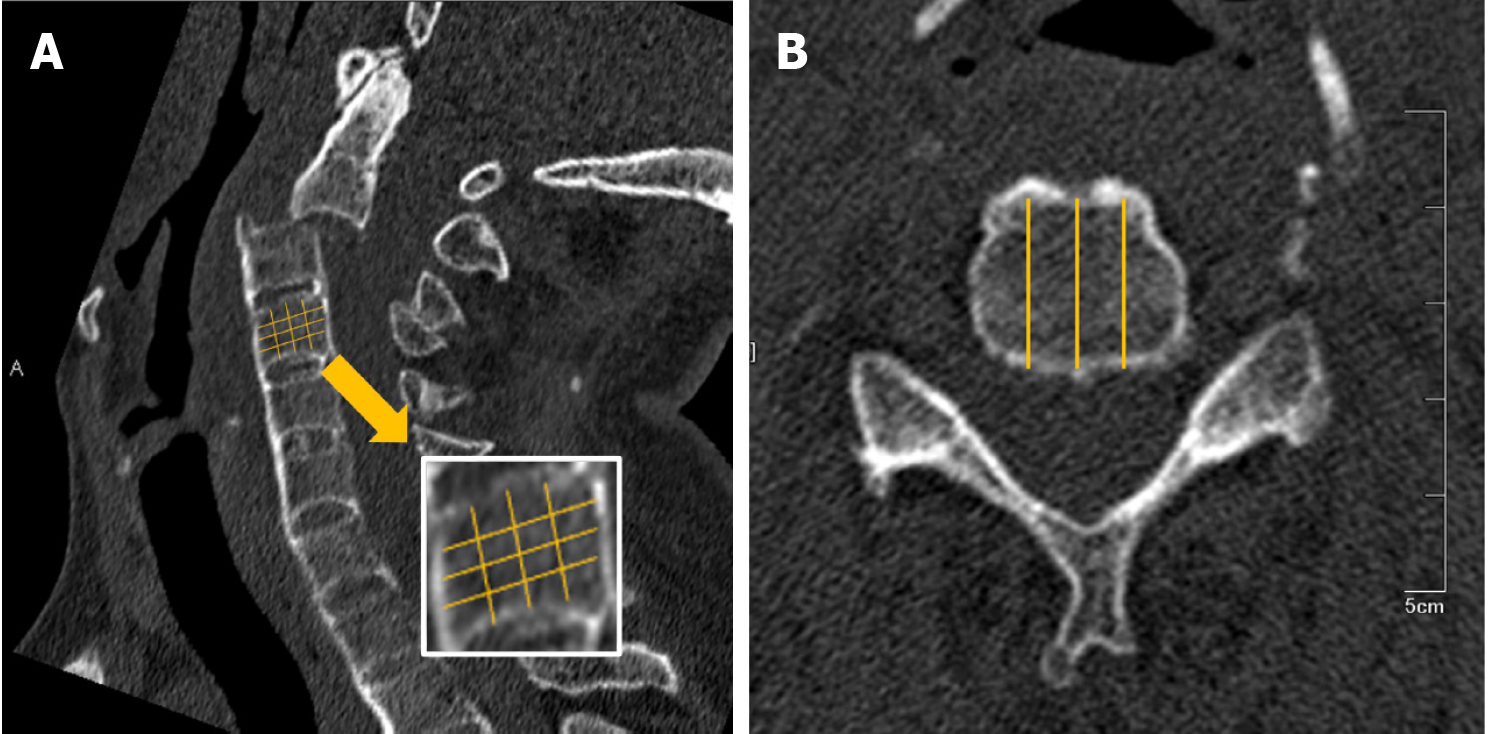
Figure 1 Hounsfield unit imaging assessments.
A: A 60-year-old male cervical fracture-dislocation patient with ankylosing spondylitis. Using a three-dimensional reconstruction, the middle sagittal plane was selected. Using nine reference lines, every vertebra was equally divided into 16 regions; B: The right, middle, and left sagittal planes were selected according to three reference lines.
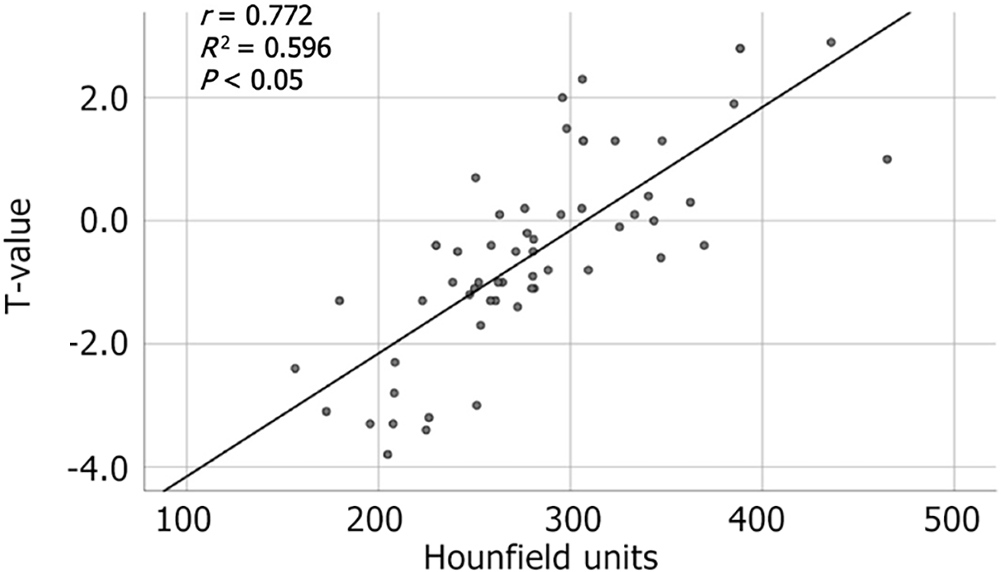
Figure 2 Scatter plot showing the correlation between the Hounsfield units obtained from cervical vertebrae and T-values obtained from dual-energy X-ray absorptiometry of the lumbar vertebrae of 59 normal patients.
A significant correlation was found (r = 0.772, r2 = 0.596, P < 0.05).
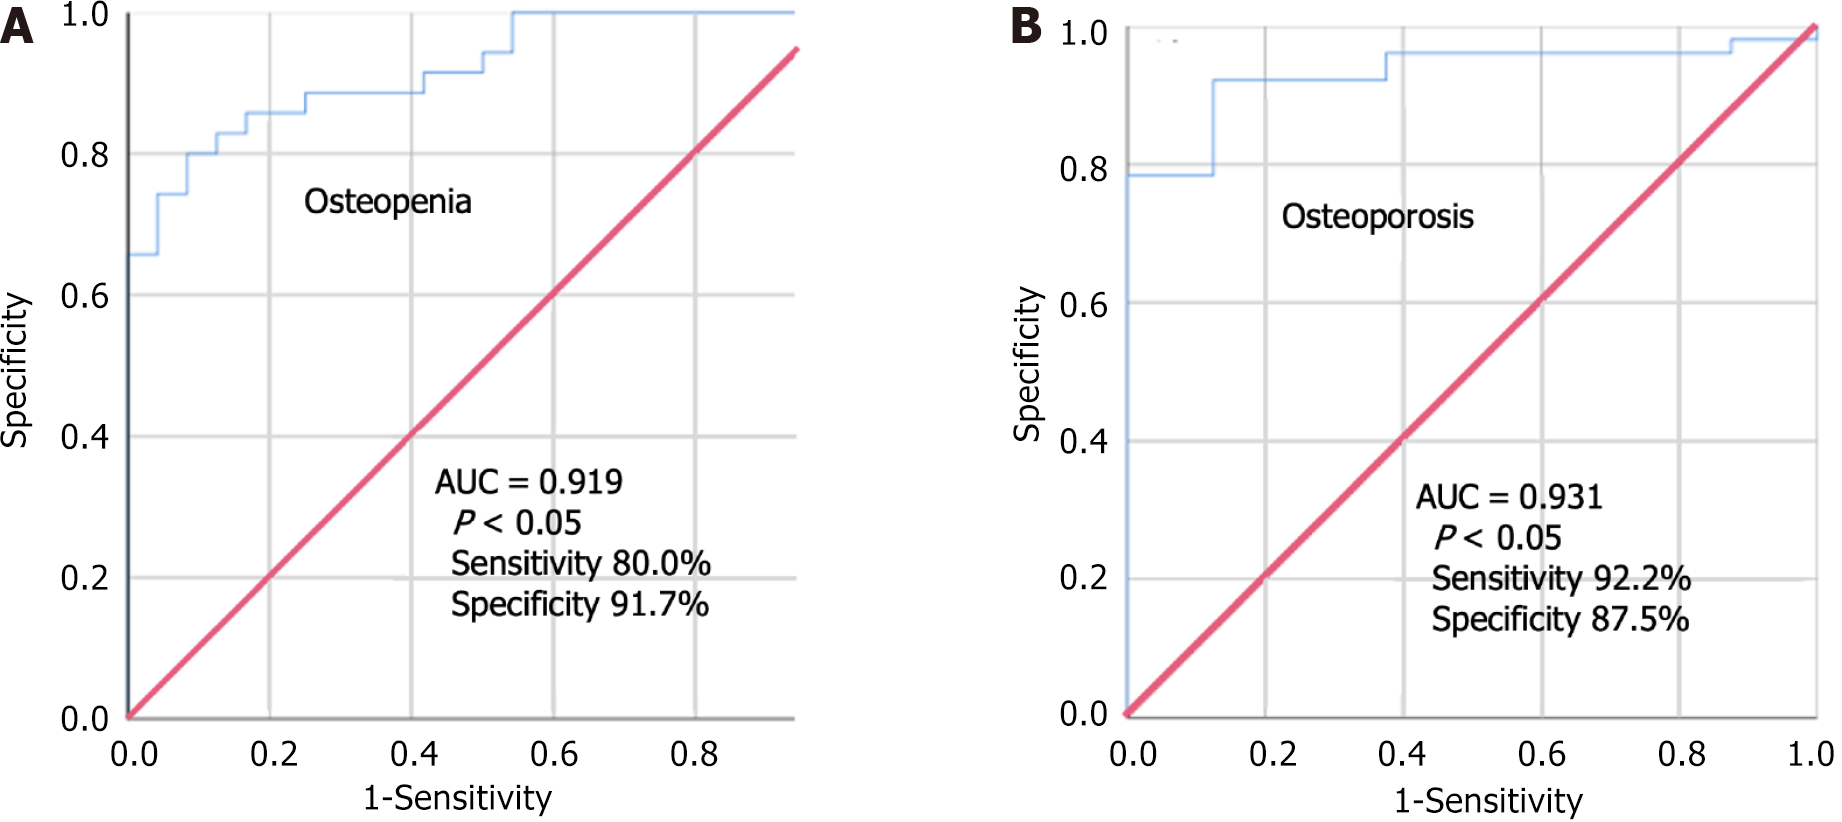
Figure 3 Receiver operation characteristic curve to diagnose osteopenia and osteoporosis.
A: Hounsfield unit measurement had a sensitivity of 92.2% and specificity of 87.5% with an area under the curve (AUC) of 0.931 (P < 0.05) in diagnosing osteopenia; B: Hounsfield unit measurement had a sensitivity of 80.0% and specificity of 91.7% with an AUC of 0.919 (P < 0.05) in diagnosing osteoporosis.
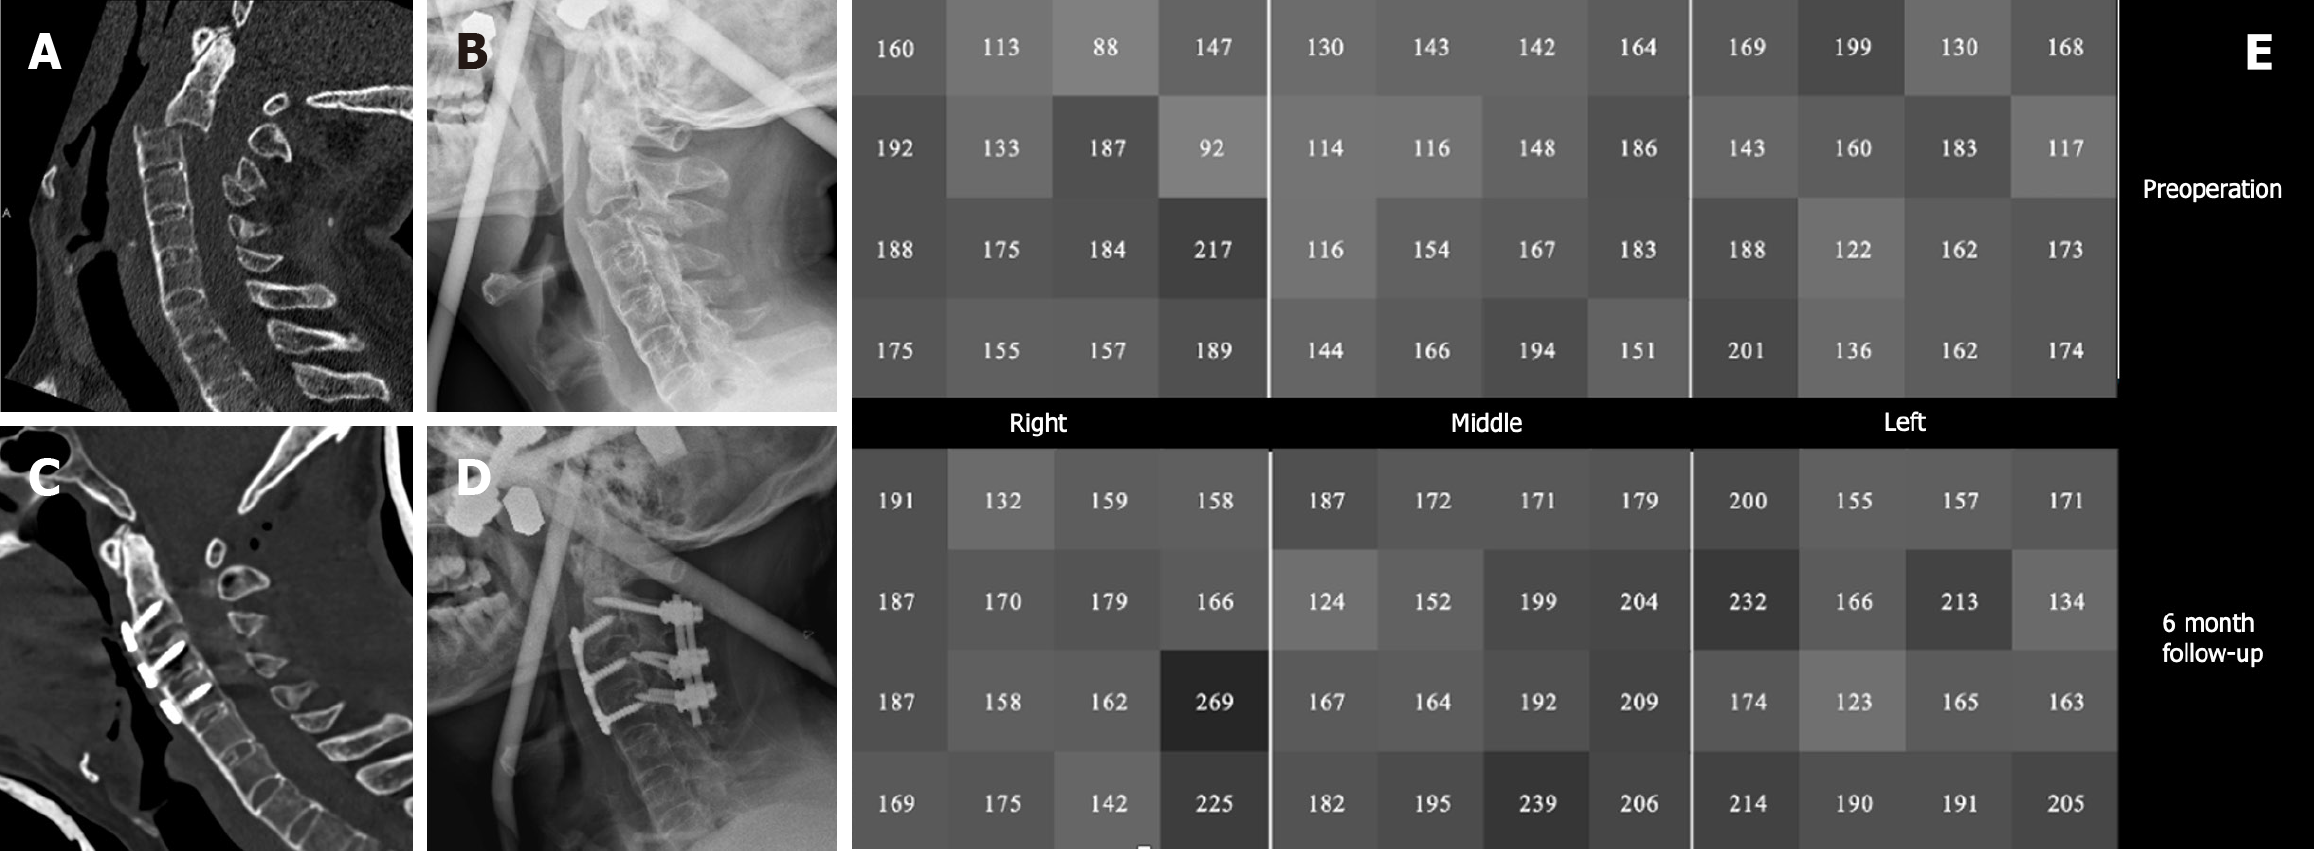
Figure 4 A 68-year-old man developed paralysis after a traffic accident.
A: Preoperative computed tomography suggested ankylosing spondylitis combined with C2/3 fracture-dislocation; B and C: We performed a reduction with a Halo vest and an anterior combined posterior surgery; D: Postoperative bisphosphonates were used for anti-osteoporosis treatment, and cervical computed tomography was repeated at 6 mo postoperatively; E: We calculated the Hounsfield unit values of the C5 vertebra and found that the postoperative Hounsfield unit values (179.67) were significantly higher than preoperative (157.44).
- Citation: Gao ZY, Peng WL, Li Y, Lu XH. Hounsfield units in assessing bone mineral density in ankylosing spondylitis patients with cervical fracture-dislocation. World J Clin Cases 2024; 12(23): 5329-5337
- URL: https://www.wjgnet.com/2307-8960/full/v12/i23/5329.htm
- DOI: https://dx.doi.org/10.12998/wjcc.v12.i23.5329


