Copyright
©The Author(s) 2024.
World J Clin Cases. Aug 6, 2024; 12(22): 5196-5207
Published online Aug 6, 2024. doi: 10.12998/wjcc.v12.i22.5196
Published online Aug 6, 2024. doi: 10.12998/wjcc.v12.i22.5196
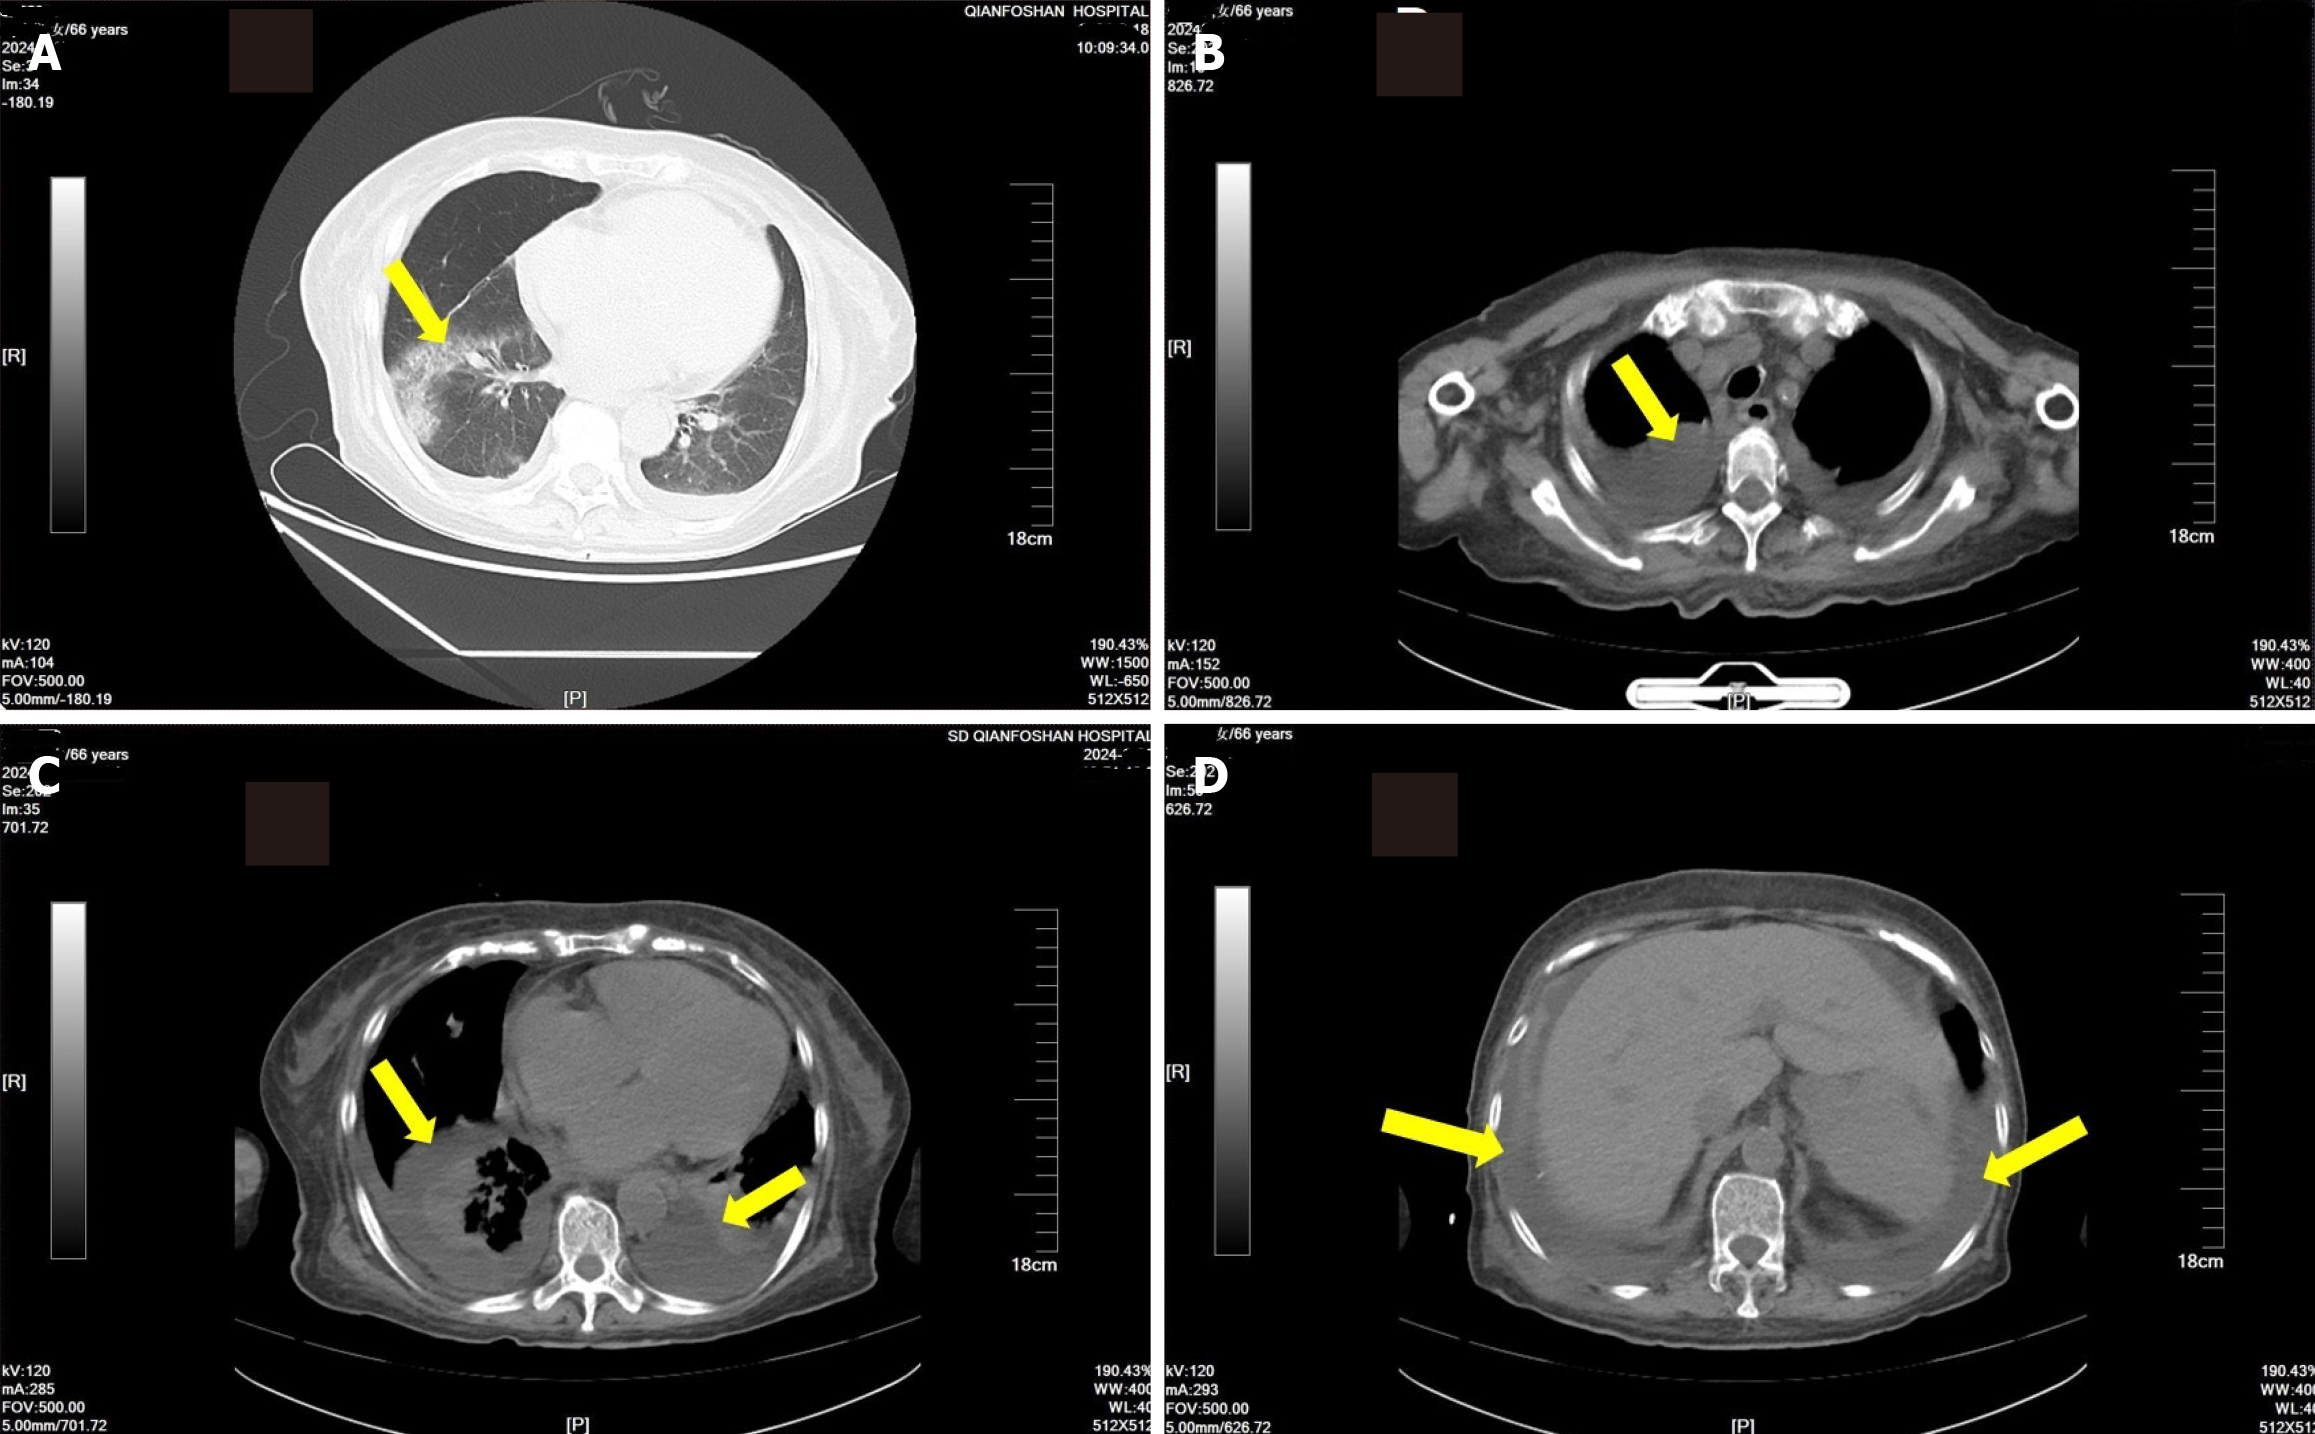
Figure 1 Computed tomography images.
A: Pneumonia; B and C: Pleural effusion; D: Ascites.
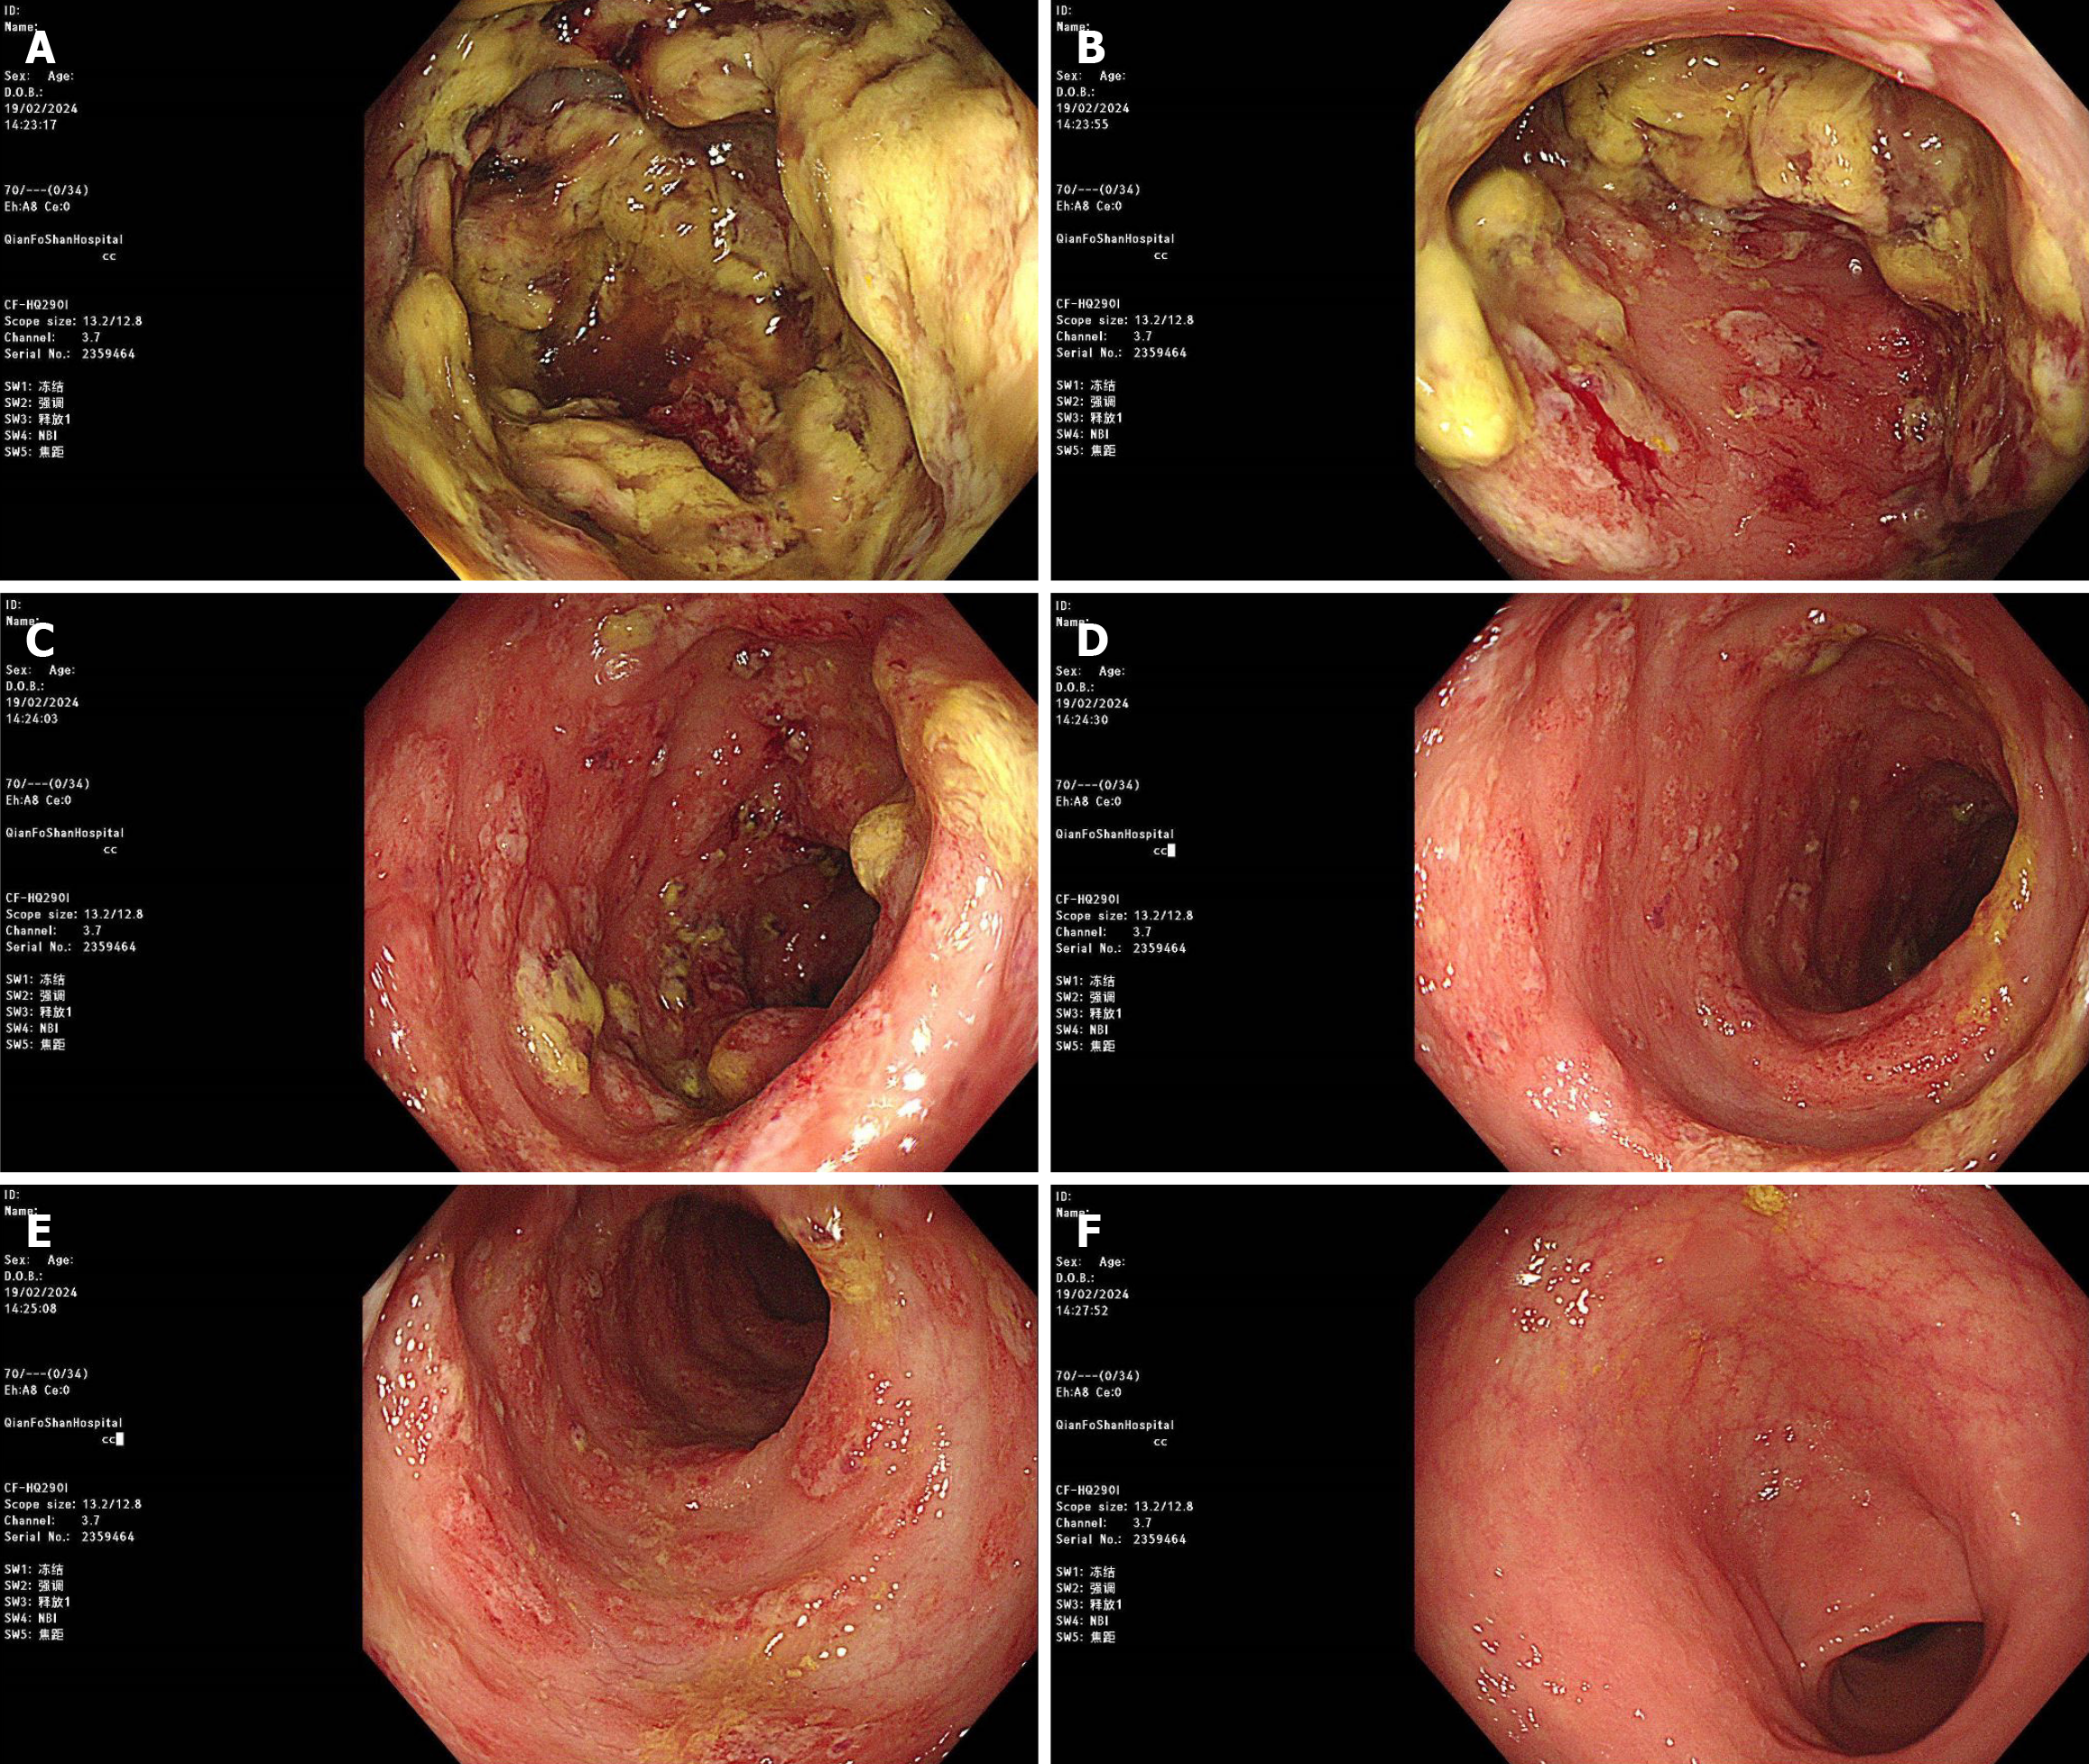
Figure 2 Colonoscopy images.
A and B: Local ulcer formation with intestinal lumen stenosis at 60 cm (A) and 55 cm (B) from the anus; C: Local mucosal edema with ulcer formation in the descending colon; D-F: Local mucosal congestion and edema with erosion in the sigmoid colon (D and E) and rectum (F).
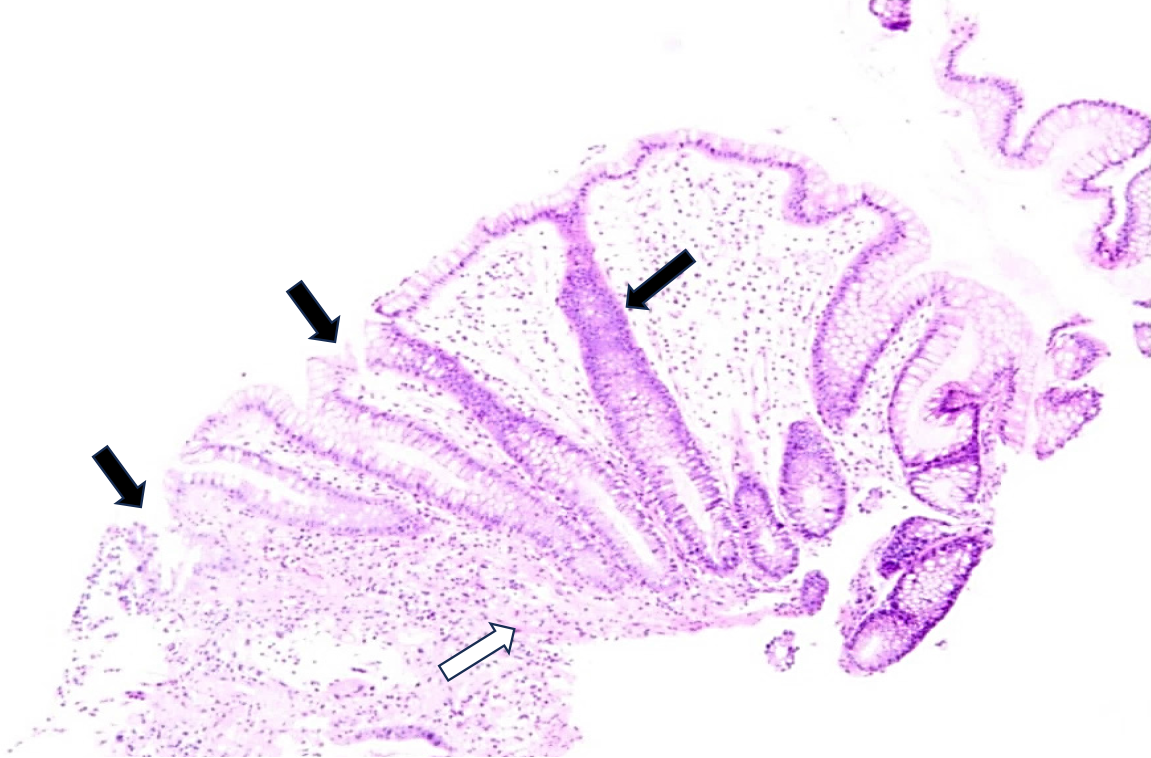
Figure 3 Colon tissue pathology image.
Inflammatory cell infiltration with ulcer (black arrows); Fibrogranuloma tissue hyperplasia (white arrow) (hematoxylin-eosin staining, × 100).
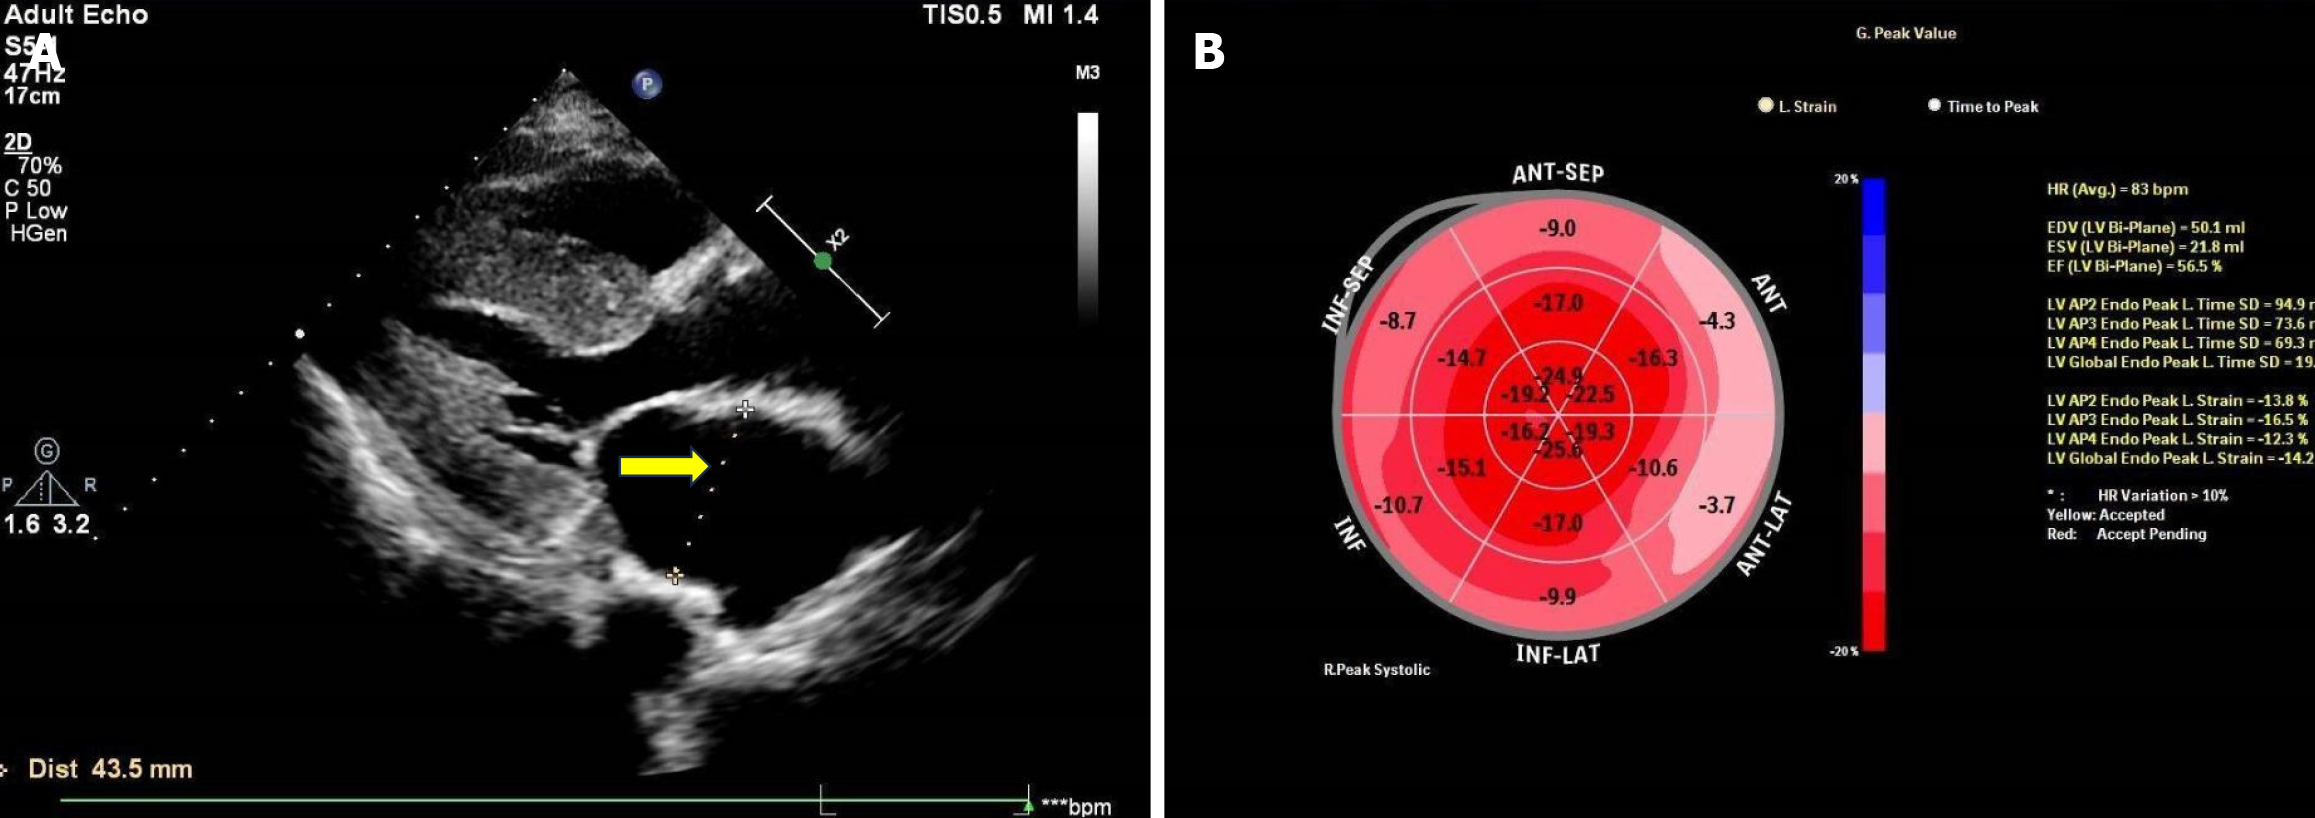
Figure 4 Echocardiography image.
A: Enlarged atria (arrow); B: Reduced left ventricular systolic function.
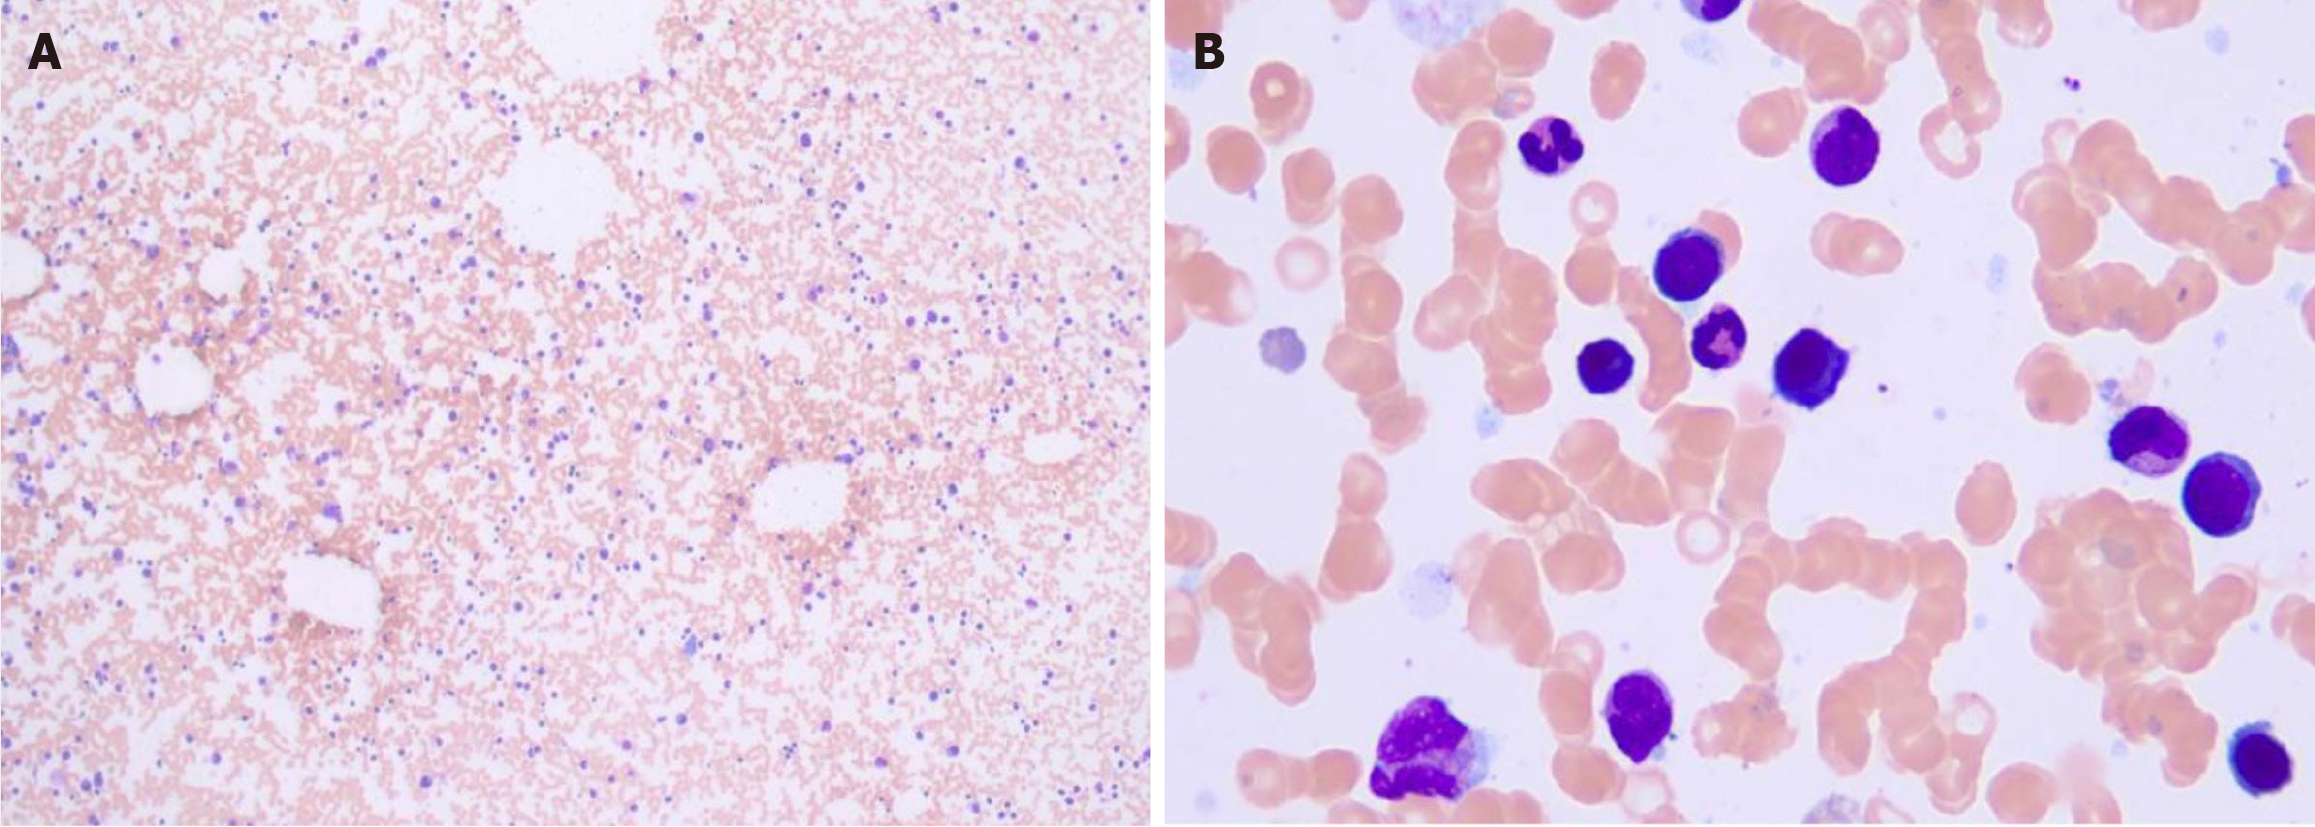
Figure 5 Smear cytology of bone marrow aspirate fluid shows high proportion of plasma cells.
A: × 100; B: × 1000 (hematoxylin-eosin staining).
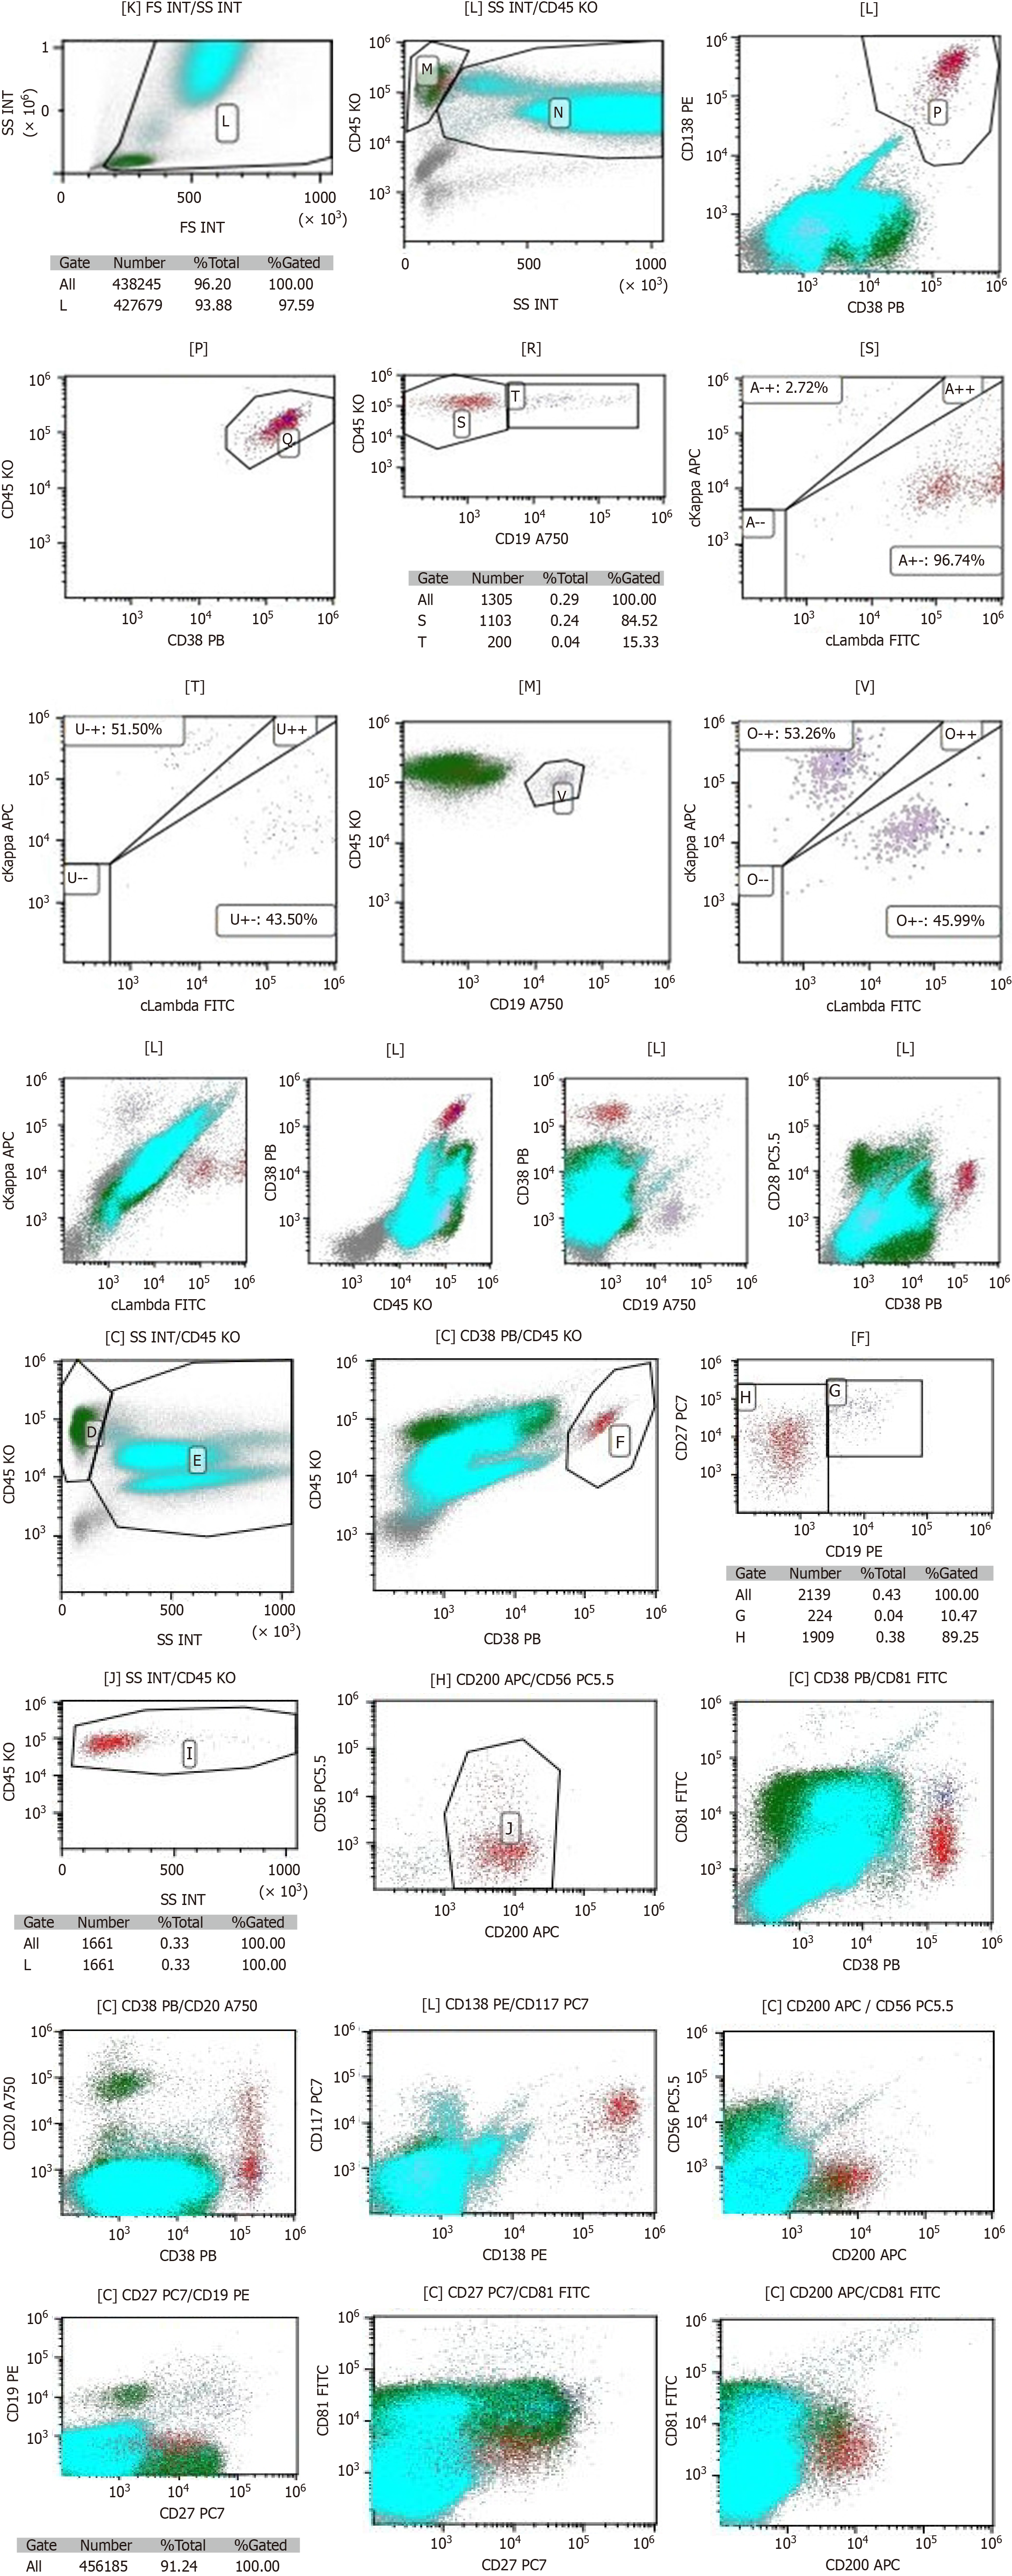
Figure 6 Flow cytometry shows representative cluster of differentiation (CD) molecule expressions.
Figure 7 Histopathology of bone marrow shows granulocytic hyperplasia.
A: × 100; B: × 400 (hematoxylin-eosin staining).
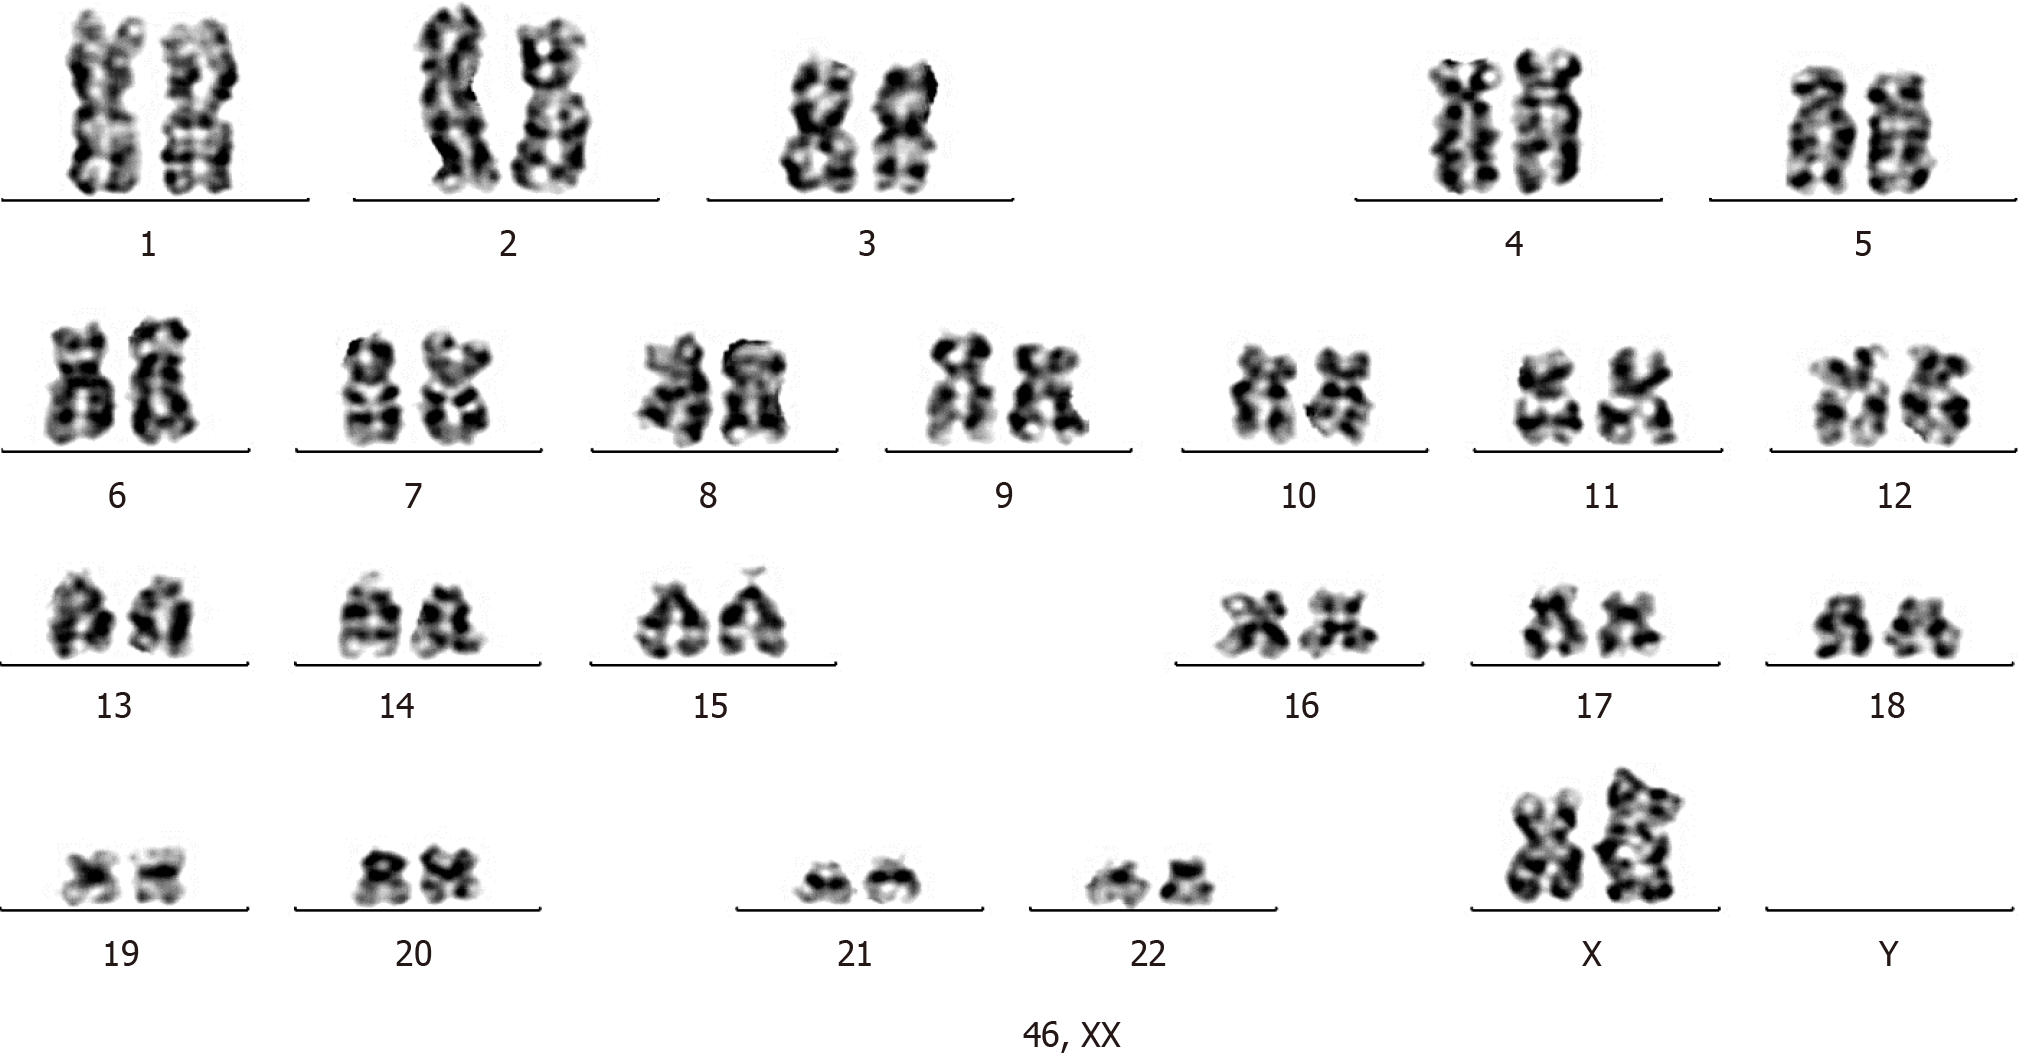
Figure 8 Cytogenetic testing of bone marrow shows 46 XX karyotypes.
- Citation: Yan MX. Pleural effusion, ascites, colon ulcers and hematochezia: What we can learn from the diagnostic process of a patient with plasma cell myeloma: A case report. World J Clin Cases 2024; 12(22): 5196-5207
- URL: https://www.wjgnet.com/2307-8960/full/v12/i22/5196.htm
- DOI: https://dx.doi.org/10.12998/wjcc.v12.i22.5196


